
Abstract
When confronted with a small sample, feature-selection algorithms often fail to find good feature sets, a problem exacerbated for high-dimensional data and large feature sets. The problem is compounded by the fact that, if one obtains a feature set with a low error estimate, the estimate is unreliable because training-data-based error estimators typically perform poorly on small samples, exhibiting optimistic bias or high variance. One way around the problem is limit the number of features being considered, restrict features sets to sizes such that all feature sets can be examined by exhaustive search, and report a list of the best performing feature sets. If the list is short, then it greatly restricts the possible feature sets to be considered as candidates; however, one can expect the lowest error estimates obtained to be optimistically biased so that there may not be a close-to-optimal feature set on the list. This paper provides a power analysis of this methodology; in particular, it examines the kind of results one should expect to obtain relative to the length of the list and the number of discriminating features among those considered. Two measures are employed. The first is the probability that there is at least one feature set on the list whose true classification error is within some given tolerance of the best feature set and the second is the expected number of feature sets on the list whose true errors are within the given tolerance of the best feature set. These values are plotted as functions of the list length to generate power curves. The results show that, if the number of discriminating features is not too small—that is, the prior biological knowledge is not too poor—then one should expect, with high probability, to find good feature sets.
Introduction
One of the most challenging issues facing cancer informatics, and bioinformatics in general, is feature selection for classification. A typical microarray contains tens of thousands of genes from which a set must be chosen to form the features for whatever kind of discrimination is desired, be it for diagnosis or prognosis. Not only is feature selection problematic in high-dimensional settings; it is made more difficult by small samples, which are commonplace in high-throughput genomics and proteomics.
The supplementary table lists 20 cancer classification studies, showing the sample size, method of cross-validation error estimation, and classification problem for each. As we will discuss, finding and validating a single good feature set for these sample sizes is virtually impossible; on the other hand, reporting a list of small feature sets can, with high probability, assure one of obtaining one or more well-performing feature sets.
Numerous feature-selection algorithms have been proposed during the last few decades.1,2 and this number has increased dramatically since the advent of high-throughput genomic technology..3,4 All feature-selection methods suffer from two problems, one inherent in the multivariate nature of classification and the other a consequence of sampling. First, even given the joint distribution of all the features and labels, if one wishes to select the best feature set of size
Perhaps the most well-known consequence of sample-based feature selection is the peaking phenomenon.6–9 With full knowledge of the feature-label distribution, increasing the number of features cannot produce poorer classification; however, when using sample data, increasing the number of features beyond a point can degrade classification. For certain classification rules and feature-label distributions this point may consist of very few features when samples are small. Classically, peaking has been studied in the absence of feature selection, meaning that the features are added in a pre-determined manner. Peaking becomes far more complicated in the presence of feature selection. 10 Moreover, classical studies do not consider the extremely large numbers of features found in genomics, so that feature-selection performance for moderately large feature families must be re-examined in the framework of high-throughput biology. 11 In sum, the peaking phenomenon argues for limiting the number of features unless there is reason to believe that peaking will not be a problem.
When applying a feature-selection algorithm, given a classifier design rule, two basic related questions arise 12 : (a) Can one expect feature selection to yield a feature set whose error is close to that of an optimal feature set? (b) If a good feature set is not found, should one conclude that good feature sets do not exist? These questions translate quantitatively: (a) Given the error of an optimal feature set, what is the conditionally expected error of the selected feature set? (b) Given the error of the selected feature set, what is the conditionally expected error of an optimal feature set? Rather than using the conditional expectation, one can take a simpler route and look at the linear regression in both cases. For small samples it is commonplace to have very little regression in both cases and little correlation between the two errors. Thus, one cannot expect to find a close-to-optimal feature set or draw any conclusion regarding the existence of a good feature set when a good one is not found. 12
Perhaps one might be fortunate and select a good feature set. But how would it be known that the feature set is good? Since the sample size is small, error estimation will be done on the training data and, when samples are small, error estimators such as cross-validation and bootstrap give generally poor results, 13 and the performance of these error estimators gets even worse when used in conjunction with feature selection..14,15 The problem is that, with small samples and a large number of features (using feature selection or not), these error estimators have substantial variance, especially cross-validation, and they possess little correlation or regression with the true error. 16
To address the dual problems of feature selection and error estimation, one can invoke two constraints. First, the number of potential features can be cut without using the data by restricting attention to features known to have some relation with the labels to be classified, say to a particular cancer of interest, and by not considering features whose measurements are suspect, say by throwing away features with missing values. Second, one can use small feature sets. Not only does this avoid the peaking phenomenon and enhance error estimation, it can also avoid feature selection altogether by facilitating an exhaustive search of feature sets. By only considering feature sets of size 1, 2, and 3, so long as the total number of features is not too large, one can test every feature set. Not only does such a restriction mitigate the statistical and computational issues, it also facilitates biological understanding. Studies have shown good classification can be achieved with 2 or 3 genes when re-examining data from studies that had originally used much larger feature sets,.17,18 with the advantage that the error estimates for the small gene sets are more credible.
While small feature sets help reduce the uncertainty introduced by feature selection and error estimation, even an exhaustive search with small feature sets does not fully overcome the problem. 19 Rather than report a single feature set when samples are small, reporting a list of the best performing feature sets increases the likelihood of finding good features sets, the idea being that some in the list of top-performing feature sets will be close to optimal. This strategy has been taken in a number of cancer classification studies that give lists of the best performing 1, 2, and 3 gene feature sets.20–23 Given the list, one can either focus on the feature sets in the list for further sampling or take a classical wet-lab approach to determining which ones are predictive.
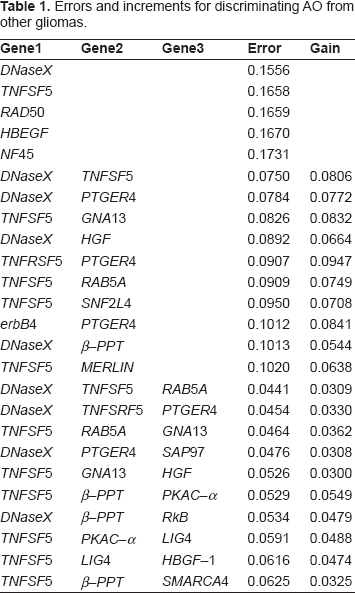
For illustration purposes, we briefly describe some results from a study that designed linear classifiers to distinguish four types of glioma (leaving details to the original paper): oligodendroglioma (OL), anaplastic oligodendroglioma (AO), anaplastic astrocytoma (AA), and glioblastoma multiforme (GM)—in particular, classification of OL from others, AO from others, AA from others, and GM from others. 20 The study involved 25 patients and the gene list was reduced to 597 genes prior to utilizing the data. Table 1 gives the best 5 single-gene sets and the best 10 two-gene sets based on the estimated errors. It also gives the three-gene sets among the top 50 three-gene sets for which the estimated error of the three-gene set is at least 0.03 less than the estimated error of its best two-gene subset. The purpose for placing this requirement on the marginal gain of a three-gene set over its two-gene subsets is to avoid redundancy caused by adjoining features to already strong performing feature sets. For each feature set, the table gives the error and the marginal gain.
Errors and increments for discriminating AO from other gliomas.
The risk with this strategy is that, just as selecting a single feature set may be biased by a low error estimate, and thereby in actuality provide a poor feature set, an exhaustive list will be affected at the low end by optimistic error estimates and at the high end by pessimistic error estimates. The problem is illustrated in Figure 1, in which the

Error curves for a gaussian model.
This paper uses a model-based approach to investigate the kind of results that can be expected from generating feature-set lists. This is accomplished via a characterization of the goodness of the list relative to the number of potential features and the sample size. Since our purpose is to quantify the effects of forming a feature list and since quantification depends on the number of potential features selected by the biologist for consideration and the number of those features that are significant contributors to discrimination, only a model-based approach can provide meaningful results, since the contributive and non-contributive features are not known
Systems and Methods
Ranking power
We define a measure of goodness for the list based on the closeness of the estimate-based feature sets to optimality It depends on the feature-label distribution, the classification rule, the total number

The ranking power gives the probability that at least one feature set in the list has error within
We consider
In a sense

where
In the remainder of this paper we will investigate properties of these power curves, in particular, how they are affected by
Model
We consider a hybrid Gaussian model
The covariance matrix, Σμ, for

where Σρ has variance
The noise features are modeled as zero-mean random Gaussian noise, with a total of
Given the adopted model, for any feature set of size
Two points regarding
To find the true error of a designed classifier we generate a very large test set of independent data from the feature-label distribution and compute its error rate on the test set. Estimated errors are computed by bolstered resubstitution, which has been shown to perform well in comparison with other training-sample-based error estimators when it comes to ranking feature sets. 19
To illustrate the advantage of obtaining a list of feature sets by exhaustive search, we compare the list to ordinary feature selection by computing

where ∊
Implementation
We focus on the LDA classification rule, the power curve method being applicable to any classification rule. We utilize the following simulation procedures:
Compute
Set up
Randomly select
Generate
Compute the true error, ∊0, for
For every feature set of size
Compute the true and estimated errors for the classifiers from step (5).
Rank all the feature sets by their estimated errors to get the top
Select the feature set in the list with the lowest true error, ∊1.
If ∊1 – ∊0 <
Repeat steps (2) through (9) a total of
Compute
Repeat the steps of the procedure Compute
Use the t-test to select the first
Find the true error, ∊
If ∊
Repeat steps (3) through (7) a total of
A summary of the experimental parameters is provided in Table 2.
Summary of experiments. ES stands for exhaustive search methods and FS stands for feature selection methods.

Experimental Results
For a given model we are mainly interested in the effects of
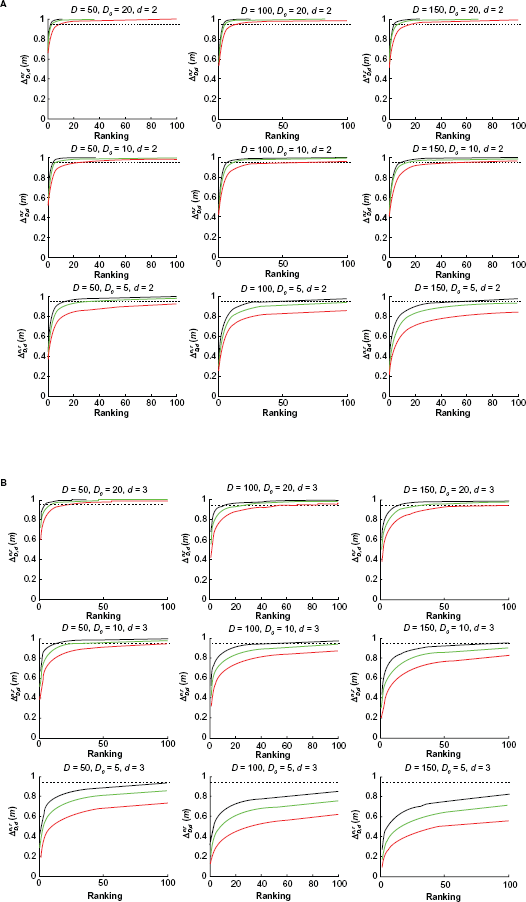
Power curves for different model parameters. Red:

Average good features for different model parameters. Red:
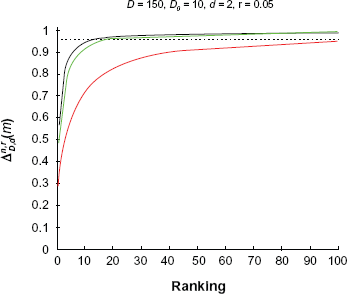
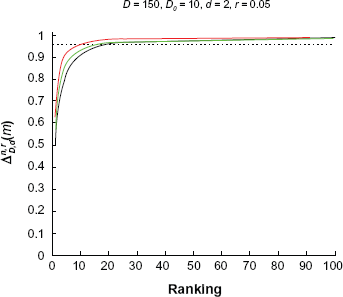
A related effect concerning prior knowledge has been discussed. 24 In current molecular epidemiology studies, it is common to claim an association between a genetic variant and a disease when the corresponding P value is below a certain level, say 0.05. However, the false positive report probability (FPRP) can be close to 1 if the prior probability of the true association is below 0.01. In our paper, this corresponds to the situation where a low percentage of suggested features are markers and, consequently, the power curves will be significantly lowered (Fig. 2).
The effect of increasing

error difference curves. Green: true error, red: estimated error, black: error difference.
Figure 5 illustrates the effect of variance in the marker model

Power Curves for
Figure 6 shows the effect of a different number of blocks, a larger number of blocks representing features that are spread among more pathways. We set
Power curves for
Figure 7 shows the effect of correlation. We set
Power curves for ρ = 0.1; 0.5; 0.8, respectively. Red: ρ = 0.1, green: ρ = 0.5, black: ρ = 0.8.
It is informative to compare the ability of feature-set lists created by exhaustive search to what one obtains using feature selection. Table 3 shows the probability of finding a feature set whose error is within
Probability of finding a good feature set using feature selection:

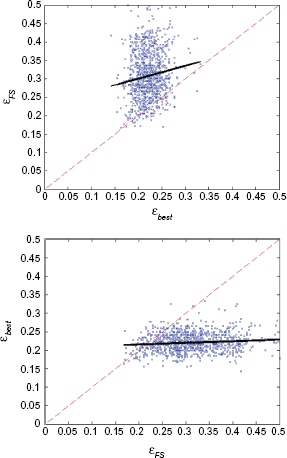
Scatter plot and robust linear regression line (bold line) for feature selection,
Conclusion
The problem of developing a classifier based on biological features such as SNPs, patterns of differential gene expression, or differential protein abundances, with sufficient sensitivity and specificity for medical use has proven much harder than originally hoped. Indeed, a current question frequently raised in the field is whether it is possible to find features that are even of the same reliability as the clinical features developed by physicians in the course of treating particular diseases. One reason for the current low levels of production of these molecularly-based classifiers is that a researcher attempting to discover such features typically starts by using a “non-biased” approach where as many features are tested for candidacy as is possible with the current high-throughput methodologies appropriate for the kind of marker being studied. Such an approach has the virtue of not missing the opportunity to evaluate a candidate feature that might have been missed if a smaller set of features were examined. The approach carries the liability of not being able to recognize predictive features because the availability of sample data and the cost of the analysis has restricted the study to examining too few individuals from the study populations to provide a reliable estimate of the discriminatory power of the features. A validation study of a large number of SNP associations with acute cardiovascular syndromes based on sample sets containing no more than hundreds of sample points has produced the most explicit example of how devastating the inability to accurately estimate predictive error in such sample sets can be. 25
This study further illustrates the degree of difficulty of producing classifiers by showing that even under highly idealized, mathematically favorable conditions—two Gaussian classes sharing the same uncorrelated-block covariance matrix and zero-mean random Gaussian noise—it is still difficult to find a close-to-optimal feature set with small samples (Table 3). These idealized conditions are far from most biological situations, since the array of cellular processes that play a role in a disease are highly integrated with other processes, have varying degrees of correlations with other cellular processes, and must be searched for not in a milieu of random operations, but in a setting of other processes that do not display a great deal of randomness.
The findings in this study suggest an alternative to the current sequence of operations employed in “non-biased” discovery methods that start with a small sample set and many thousands of candidate features. The suggestion is to apply as much biological prior knowledge and insight about the disease as possible to limit the list of features to be examined in the study. In “non-biased” discovery, prior knowledge and insight are applied after the classifier design process has been run in order to further prioritize the candidates for validation studies. If the process has failed to nominate predictive features that can be recognized on the basis of the possible fit of their functions with the disease, then they will be lost to the analyst. Alternatively, if the biologist had correctly proposed as few as five valid features as candidates for analysis in a list of fifty such candidates, then even in an examination of as small as fifty sample points, then the analyst would have an excellent chance of recognizing the predictive power of several of those features (Fig. 2).
This and previous studies.9,13,16 suggest that experimental campaigns to establish classifiers with the predictive strength required for medical use can be defensibly mounted in two ways. For those indications where the existing biological knowledge is insufficiently certain that well-informed experts feel that they are unlikely to be able to produce a candidate list of one to two hundred genes with five to ten percent accuracy and where a predictive classifier would produce sufficient benefit to justify a well-powered study (thousands of sample points), a large study examining many features could be carried out. If, on the other hand, the indication is well enough studied that a candidate list with a hit rate of five to ten percent could be expected to be developed, a modest sample set is available, and the classifier would justify a smaller-scale study, then this type of study could be run. Studies between these bounds, which lack either sufficient sample size to successfully recognize predictive features or sufficient prior knowledge to reduce the set of candidate features to a level where they can be successfully identified with smaller sample sets, are unlikely to provide classifiers that could be validated and should be avoided.
Disclosures
This manuscript has been read and approved by all authors. This paper is unique and is not under consideration by any other publication and has not been published elsewhere. The authors report no conflicts of interest.