
Abstract
Background
Microarray techniques provide promising tools for cancer diagnosis using gene expression profiles. However, molecular diagnosis based on high-throughput platforms presents great challenges due to the overwhelming number of variables versus the small sample size and the complex nature of multi-type tumors. Support vector machines (SVMs) have shown superior performance in cancer classification due to their ability to handle high dimensional low sample size data. The multi-class SVM algorithm of Crammer and Singer provides a natural framework for multi-class learning. Despite its effective performance, the procedure utilizes all variables without selection. In this paper, we propose to improve the procedure by imposing shrinkage penalties in learning to enforce solution sparsity.
Results
The original multi-class SVM of Crammer and Singer is effective for multi-class classification but does not conduct variable selection. We improved the method by introducing soft-thresholding type penalties to incorporate variable selection into multi-class classification for high dimensional data. The new methods were applied to simulated data and two cancer gene expression data sets. The results demonstrate that the new methods can select a small number of genes for building accurate multi-class classification rules. Furthermore, the important genes selected by the methods overlap significantly, suggesting general agreement among different variable selection schemes.
Conclusions
High accuracy and sparsity make the new methods attractive for cancer diagnostics with gene expression data and defining targets of therapeutic intervention.
Availability
The source MATLAB code are available from http://math.arizona.edu/∼hzhang/software.html.
Keywords
Introduction
With the boost of modern techniques such as microarrays and next-generation sequencing in biological sciences, more and more high-throughput data are generated and utilized for basic science and for translational medicine. A typical gene expression data set contains tens or hundreds of thousands (p) input variables, which greatly exceeds the sample size n, i.e., p ≫ n. Many classical multivariate analysis methods have difficulties in handling such data because of the curse of dimensionality. However, the support vector machine (SVM),1,2 originally designed for binary classification, has shown success in learning large p small n data and is useful for cancer classification.3,4
Cancer classification using gene expression data often results in multi-class problems, classifying tumor cells to multiple subtypes. In previous studies, samples were defined as (x i , yi), i = 1, …, n, where x i is the gene expression profile of the ith sample and yi ∈ {1, …, K} is the cancer type. There are several methods available to extend the binary SVM (K = 2) to K ≥ 3. One common approach is to decompose the multi-class problem into multiple binary problems,5,6 using one-versus-rest or one-versus-one schemes, and combine learned multiple binary rules by a voting method. These approaches are useful in practice but have some limitations. First, the one-versus-rest approach may fail if no class dominates the union of the others. 7 Second, the one-versus-rest approach tends to yield unbalanced classification problems, especially if one class is much smaller than the union of remaining classes. Third, the one-versus-one approach trains each classifier based on only a portion of samples, which may increase the solution variablity. Fourth, these procedures do not effectively capture the correlation between different classes. 8 For example, tumor sub-types are more correlated to each other than to normal samples.
A better method for handling multi-class problems is to separate all the classes by estimating K discriminating functions (f1(x), f2(x), …, fK(x)) simultaneously. The decision rule is then defined as Φ(X) = arg
Besides classification, another question of primary interest to biologists is to identify important genes for tumor classification. Since including too many redundant variables in a model may negatively impact its prediction performance, 3 variable selection is important and necessary for accurate cancer classification. The redundant variables include both noise variables and variables which are highly correlated with the predictor variables. Furthermore, building a sparse and more interpretable model can reduce the number of follow-up experiments to a manageable size. One common approach of variable selection is gene-ranking: first, rank genes using univariate measurements such as p-values from hypothesis tests or correlation coefficients between individual inputs and the response, then sequentially add/remove genes to/from the model, and finally select the model based on cross-validation or the validation error. Despite their popularity in practice, gene-ranking methods have some drawbacks. First, genes are pre-selected based on individual effects, so their combined effects cannot be taken into account. This can be an issue since many genes tend to be highly correlated. In addition, these procedures separate variable selection and classification in two stages, and hence selected variables are not guaranteed to contribute significantly to the final classifier. This may result in suboptimal performance of classification.
The standard SVMs are equipped with L2 penalty for regularization; see Guyon et al. (2002) 11 for the binary SVM and Lee et al. (2004) 7 for the MSVM. Since L2 penalty shrinks the fitted coefficients towards zero, it effectively controls the model variability and improves prediction performance especially when many variables are highly correlated. 3 However, L2 penalty can not set small coefficients to exactly zeros, so all variables are utilized in the learned model. For the purpose of variable selection, Bradley and Mangasarian 12 introduced L1 penalty to the binary SVM for achieving sparsity in the solution. By shrinking small coefficients to exact zeros, L1 SVM can build a parsimonious model with more accuracy than the standard L2 SVM when many redundant variables exist. A large p and small n data set can be directly fed into the L1 model without pre-screening.
In this paper, we consider variable selection for the multi-class SVM, which is more challenging than the binary case because of the increased complexity in multi-class learning. The work on the MSVM variable selection in literature is limited but includes Wang et al. (2007), 13 Lee et al. (2006), 14 and Zhang et al. (2008). 15 In particular, Wang et al. 13 studied the L1-norm MSVM and developed the solution path algorithm, while Zhang et al. 15 proposed a new penalty form, called the sup-norm penalty, which was shown to lead to more sparse models than L1 penalty. Lee et al. 14 proposed to first make a functional ANOVA decomposition for the decision function and then conduct variable selection by imposing a soft-thresholding penalty on the functional components. All of these methods are based on the loss function of Lee et al. 7
In this work, we suggest several new variable selection procedures for MSVM based on the loss function of Crammer and Singer. 8 Compared to other loss functions, this particular function provides a direct generalization of the hinge loss in binary SVMs and has a natural interpretation in terms of the functional margin. In practice, the resulting classifiers have shown competitive performance. We first considered linear classification problems. A group of regularization problems are proposed for sparse multi-class learning, and the computational algorithms are discussed as well. We then extended the methods to nonlinear cases. Our methods are particularly useful for analyzing large p and small n data, for example, high dimensional microarray or other “-omics” data. We applied the methods to two microarray data sets, acute leukemia study 16 and small round blue cell tumors. 17 The results suggest promising performance of the new methods in terms of accurately predicting the classes using a minimal number of genes.
Methods
Given a training set {(x
i
, yi), i = 1, …, n}, where x
i
∈ Rp and yi ∈ {1,2, …, K}, the goal of multiclass classification is to learn the optimal decision rule Φ : Rp
When K = 2, the label y is coded as {+1, –1} by convention. Consider the linear classifier f(x) = ß0 + xTß. The binary SVM minimizes
Binary SVM

In the binary SVM objective function, the term
Crammer and Singer 8 extended the hinge loss from the binary SVM to multi-class problems. In the separable case, the discriminating functions are required to satisfy constraint (3) for all observations: if x belongs to class y, then fy(x) is greater than any fk(x) with k ≠ y by at least margin 1. In the non-separable case, ξ i ≥ 0 are introduced to get the relaxed constraint (4):
MSVM

For linear classification, we assume fk(x) = ßk0 + xTßk for k = 1, …, K. The MSVM of Crammer and Singer 8 solves:
subject to :

To avoid estimation redundancy, the constraint
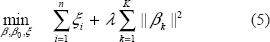
Crammer and Singer 8 imposed L2 penalty on the coefficients ß in (5). The resulting solution utilizes all variables, which may diminish the prediction accuracy when there are many redundant noise variables. In the following sections, we utilize the same loss function but suggest different penalty forms to control model complexity and achieve sparse solutions. In particular, we investigate four different penalties: L1 penalty, adaptive L1 penalty, sup-norm penalty and adaptive sup-norm penalty, and discuss computational algorithms for each type of regularization.

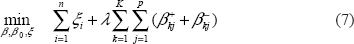
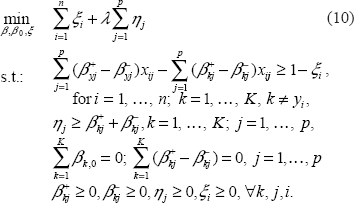
To eliminate the absolute operation in (6), define


Choices of weights in (8) are essential to adaptive procedures. We propose the construction of weights as


Nonlinear Extension
We have given four new regularization forms of MSVM for variable selection in linear classification. Next, we show that these methods can be easily extended to the non-linear case by using the basis expansion approach. Let
Model Tuning
The choice of tuning parameter λ is crucial in the above regularization problems, since it controls the trade-off between the training error and generalization performance of classifiers. It also has an impact on sparsity of the solution. To select the optimal λ, we use a validation set in simulated examples and use five-fold cross validation in real data analysis. A fine grid search is conducted over a wide range of values of λ, and the best λ is identified as the one which gives the least tuning error or cross validation error.
Results and Discussion
Simulation Study
We illustrate the performance of new methods for prediction and variable selection in both linear and nonlinear settings using simulated data sets. The Bayes rule and L2 MSVM of Crammer and Singer 8 (denoted as “L2 MSVM (C&S)”) are also included. The Bayes rule is the optimal classification rule if the underlying distribution of the data is known. It serves as the golden standard to evaluate the performance of the trained classifiers. We conducted 100 simulations for each classification method and report the average performance of the methods, including test error on test samples, model size, and the total selection frequency of individual inputs in 100 runs.
Linear Example
This is a linear classification problem with p = 20 and k = 4. The first two components of x from class k are from N(μk, σ
2
I2), with μ's values being
Table 1 reports the selection frequency of each variable over 100 runs. Important variables x1 and x2 are never missed by any method. The rest of the variables, either noise variables or informative but redundant variables, are selected with different frequencies by different methods. The adaptive sup-norm MSVM selects noise or informative but redundant variables with fewer than 10 times in 100 runs, which is a much lower selection frequency than that of L1 MSVM. Furthermore, all methods except L2 MSVM can handle informative but redundant variables very well. The
Selection frequency of individual variables over 100 runs for the linear example.

Table 2 summarizes the average test error and model size of 100 runs. The numbers in the parentheses are standard errors (SE) of the mean of test errors from 100 simulations. The Bayes error (i.e., the optimum classification error) is 0.246 and L2 MSVM has test error 0.296. All new methods are statistically better than L2 MSVM, with adaptive sup-norm MSVM giving the smallest test error 0.255. Adaptive penalties tend to enhance model sparsity, and the adaptive sup-norm yields the most compact model of size 3.25 on average. Overall, adaptive sup-norm MSVM is the best for both variable selection and prediction accuracy.
Average test error and model size for the linear example.

Nonlinear Example
Consider a nonlinear three-class example in a large p small n setting. Generate x ∈ R 20 as following: (x1, x2) are uniformly distributed in the square [–3,3] × [–3,3], and the remaining 18 components x3, …, x20 are i.i.d. from N(0, 2). Define the three functions:

For
Table 3 reports the average test error and model size over 100 runs for each method. Note that L1 MSVM and sup-norm MSVM are equivalent for three-class problems. 15 The Bayes error is 0.120, L2 MSVM has the test error 0.441, and all the new methods show a significant improvement over L2 MSVM. Adaptive sup-norm MSVM gives the smallest error 0.147, very close to the Bayes error. L2 MSVM does not perform well here, mainly due to a large number of noise variables contained in data. With regard to variable selection, L2 MSVM includes almost all variables in the fitted model, and the average model size is 221.87. The new MSVMs produce much smaller models while identifying the three important variables correctly. Adaptive sup-norm MSVM yields the most parsimonious model of size 8.58 on average. Adaptive L1 MSVM works similarly, with test error 0.152 and on average, selecting nine variables. Again, adaptively-weighted penalties are shown to produce more sparsity than equally-weighted penalties.
Average test error and model size for the nonlinear example.
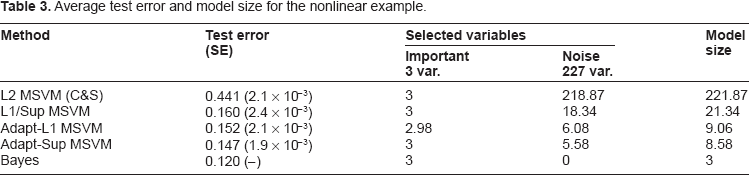
Table 4 summarizes the selection frequency of each term in the adaptive sup-norm MSVM model: those of main effects given in the first row, those of quadratic terms given on the main diagonal line, and those of 190 two-way interaction terms given in intersections of the corresponding rows and columns. We observe that the three important effects
The variable selection frequencies of adaptive sup-norm MSVM over 100 runs for the nonlinear example.

Real Data
One important application of our new methods is classification and variable selection of microarray or other “-omics” data. We analyze two cancer gene expression data sets: leukemia data 16 and small round blue cell tumor data. 17 In addition to distinguishing multi-type tumors, another primary goal is to identify signature genes which are responsible for classification and helpful for understanding the underlying mechanism of cancer. Since microarray data typically represent a large number of genes (p >> n), one common practice is selecting relevant genes before building a classifier. A popular approach of gene selection is gene ranking based on univariate statistics such as F-statistic and p-value. The weaknesses of ranking methods include: (1) classification and variable selection are performed separately and (2) the correlation and interaction among genes cannot be fully taken into account. However, rank-based screening has been found useful at an initial step by filtering irrelevant features and therefore beneficial to the refined variable selection process that follows, as in Lee et al., 7 Wang and Shen, 13 Zhang et al., 15 and so on. Pre-screening is commonly used in microarray data analysis to remove genes which do not contribute expression changes across the samples (i.e., those that are considered flat), as uninformative genes add noise to the downstream analysis. In practice, it is recommended to conduct two-stage modeling: feature screening (based on simple tests) followed by formal model building (based on more sophisticated variable selection procedures) to enhance the final variable selection results. We adopted the two-stage modeling in our real data analysis. Compared to univariate analysis done in most gene-ranking approaches, our new classification methods conduct joint selection and can account for gene-gene interactions naturally. The following results show that the methods effectively select important genes and achieve high accuracy at the same time. Therefore, they provide alternative promising tools for cancer classification using gene expression data.
Leukemia Study
The leukemia study 16 analyzed human bone marrow samples using oligonucleotide microarrays produced by Affymetrix. The data consist of 7129 probe sets, which represent 6817 human genes and 72 samples in three classes: acute myeloid leukemia (AML), T-cell, and B-cell acute lymphoblastic leukemia (ALL_T and ALL_B). There are 38 training samples (19 ALL_B, 8 ALL_T, 11 AML) and 34 test samples (19 ALL_B, 1 ALL_T, 14 AML). We preprocessed the data following Dudiot et al. 22 and selected the subset of 742 genes by F-ratio test for memory and computational efficiency. Then, L2 MSVM and four new approaches were applied for gene selection as well as model building. Variable selection and parameter choice during model building were done strictly on the training data set.
Table 5 shows that L2 MSVM only misclassifies 1 out of 34 test samples, but its solution depends on a large number of genes (429 genes). In contrast, our new methods select a very small set of genes (14, 9, 4 genes for L1 MSVM, adaptive L1 MSVM, and adaptive sup-norm MSVM respectively) while giving comparable accuracy. Table 6 shows a significant overlap in the selection: all four genes selected by adaptive sup-norm MSVM are also selected by others, and 8 of 9 genes selected by adaptive L1 MSVM are selected by L1 MSVM. Not all these genes are top-ranked by F-test, which does not take into account gene interactions.
Classification and selection results for the leukemia study.

Selected genes by various methods for the leukemia study.

To interpret the role of selected genes in classification, we now examine the three discriminant functions given by adaptive sup-norm MSVM:

Each test sample has three predicted decision values

Hierarchical clustering of all training and test samples based on 4 selected genes in leukemia study.
Small round Blue Cell Tumor(Srbct)Study
The SRBCT data are from cDNA microarrays using standard protocols of the National Human Genome Research Institute (NHGRI). 17 There are 63 training and 20 test samples, categorized into 4 classes: neuroblastoma (NB), rhabdomyosarcoma (RMS), non-Hodgkin lymphoma (NHL), and the Ewing family of tumors (EWS). We began with 2308 genes available at http://research.nhgri.nih.gov/microarray/Supplement/, and conducted gene screening with F-ratio tests. We include the top 333 and bottom 300 genes for analysis and show results in Table 7. Variable selection and parameter choice during model building were done strictly on the training data set.
Classification and selection results for the SRBCT study.

We observe that all the new methods have test error 0 except L1-norm SVM, which misclassifies 1 out of 20 test samples. With regard to gene selection, all the new methods successfully exclude the bottom 300 genes from the final model. The number of selected genes ranges between 28–36, with adaptive sup-norm MSVM selecting the smallest number of genes. Compared to other MSVM methods applied by Lee et al. 14 and Zhang et al. 15 on the same data set, our new methods give better or comparable prediction accuracy overall and they select a smaller number of genes. When examining the genes selected by the four new methods, we observe a large overlap across the final lists. In particular, 10 genes are commonly selected by all four methods, and 13 genes are selected by three methods, demonstrating general agreement among different variable selection schemes.
Conclusions
We proposed to improve the standard MSVM of Crammer and Singer 8 by constructing a new class of regularization methods which incorporates variable selection in the model learning. Performance of the new methods is demonstrated via numerical studies. Compared to the standard L2 MSVM, the new methods are shown to achieve high prediction accuracy and are able to build sparse and more interpretable models. In both simulations and real data analyses, adaptive sup-norm MSVM shows the best performance among all the methods with regard to either variable selection or prediction accuracy. The combination of high accuracy and effective selection makes the new methods attractive for high-dimensional data analysis and powerful tools for cancer biomarker discovery based on gene expression data.
Authors Contributions
HZ and LH designed the penalized MSVMs. LH developed and implemented the method. HZ supervised the study. ZZ and PB provided valuable suggestions and evaluated the results. All authors contributed to writing this paper; proofread and approved the final manuscript.
Funding
This work was supported by National Science Foundation [DMS0645293 to HZ], National Institute of Health [R01CA085848 to HZ; R24GM078233, RC2GM092729 to ZZ], and National Institute of Environmental Health Sciences [ES102345-04 to PB].
Competing Interests
Author(s) disclose no potential conflicts of interest.
Disclosures and Ethics
As a requirement of publication the authors have provided signed confirmation of their compliance with ethical and legal obligations including but not limited to compliance with ICMJE authorship and competing interests guidelines, that the article is neither under consideration for publication nor published elsewhere, of their compliance with legal and ethical guidelines concerning human and animal research participants (if applicable), and that permission has been obtained for reproduction of any copyrighted material. This article was subject to blind, independent, expert peer review. The reviewers reported no competing interests.