
Abstract
The tremendous rate of accumulation of experimental and clinical knowledge pertaining to cancer dictates the development of a theoretical framework for the meaningful integration of such knowledge at all levels of biocomplexity. In this context our research group has developed and partly validated a number of spatiotemporal simulation models of
Keywords
Introduction
An inelastic prerequisite for an effective treatment of cancer is understanding and modeling the corresponding spatiotemporal natural phenomenon of tumour growth and response to therapeutic schemes concurrently on several
This section provides a brief outline of several of the concepts and earlier research efforts to model tumour behaviour. Duechting et al
5
introduced a simulation model which concerns the
An effort to overcome some of the above mentioned limitations has been previously made by our research group through the development of four-dimensional patient-specific
Looking now at the problem of cancer from a broader theoretical perspective we realize that the impressive rate of production of experimental and clinical knowledge pertaining to the disease dictates the development of a generic and desirably universal theoretical framework for the meaningful integration of such knowledge. The obvious reasons for knowledge integration are both deeper understanding of cancer and optimization of therapeutic schemes on the patient individualized context by performing
Stimulated by these remarks we present the introduction of an operator notation into the malignant tumour response to therapeutic schemes
Discretization of the Biological Problem
Collection of the appropriate imaging data (e.g. MRI T1 contrast enhanced, CT/PET, etc.), registration, interpolation and three dimensional reconstruction constitute the initial steps of an
Operator and Hypermatrix Notation
The following mathematical entities are considered in the proposed treatment: 

where the following symbols have been introduced:


where
ξmin, ξmax denote the minimum and maximum value respectively of the generic variable ξ during the simulation

Obviously this binary character of the oxygen and nutrient provision is to be considered only a first simplifying approximation.


It should be noted that in general all physicobiologically different components of each hypermatrix element can be considered dependent on all five dimensions of the proposed abstract space of tumour dynamics. For example oxygen and nutrient provision can change dramatically in space and time within the tumour. The treatment outcome is generally dependent on the phase in which a cell resides when irradiated or treated with chemotherapy. Cell cycle phases have generally different durations and therefore the mean time spent within each phase equivalence class of a given geometrical cell is dependent on the cell phase. Even the oxygen and nutrient provision (to the biological cells belonging to the same phase within a geometrical cell) may be microscopically related to the phase under consideration. A relatively large number of tumour cells within the G0 phase located around a given point may imply inadequate oxygen and nutrient provision, although in this particular case dormancy is normally the outcome rather than the cause of inadequate oxygen and nutrient provision
Figure 1 provides a schematic representation of the proposed five dimensional discrete abstract space of tumour dynamics. Three dimensions (those corresponding to the variables
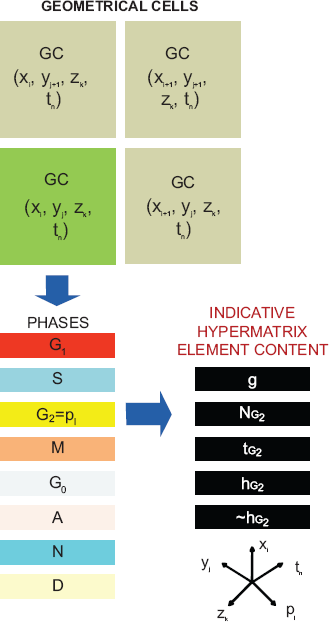
A schematic representation of equation 1 showing the location of an indicative hypermatrix element
The various modules of algorithmic manipulations on the hypermatrix can be thought of as corresponding to discrete operators acting on the hypermatrix in analogy to the action of continuous operators on a wave function in quantum mechanics (Schiff 31 pp. 148–186). The critical importance of considering abstract (vector) spaces and operators has been made clear by practically all fields of physics (Morse and Feshbach, 32 Part 1, pp. 76–92).
In order to proceed to a symbolic formulation of the operator application we make use of the following symbols:

The composite operator can be written as

where

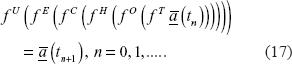
or in a more compact writing:

where the application of the operators takes place from the right to the left.
It is noted that the term
It is quite obvious that the above mentioned concepts and symbols cannot include all the information needed for the simulation to run. Their role is (at least at the present stage) rather to identify and decompose the major conceptual mathematical treatment steps than to represent any assumption details. The proposed approach is to be seen as a continually evolving and optimized process. Examples of such evolutionary stages could be the following. In order to address the non imageable components of highly invasive tumours such as glioblastoma multiforme at a large time scale further operators could be proposed so as to explicitly handle diffusion phenomena at the cellular/tissue level. Additional operators could handle the refined biomechanics of the tumour and adjacent normal tissues as well complex molecular networks which largely determine the response of a single tumour cell to treatment (see Section 5).
A careful study of the behaviour of any two of the “partial operators”
Multilevel Biology Considerations: The “Summarize and Jump” Strategy
In order to achieve a quite realistic prediction of the response of a tumour to therapeutic interventions several levels of biocomplexity have to be addressed at the same time. The decomposition of the composite discrete operator
Some Indicative Points of the Model and their Correspondence to Specific “Partial Operators”
The introduction of the suggested notation is demonstrated through a version of a simulation model of (
In order to clinically validate the simulation model, a series of simulation executions corresponding to the various arms of the RTOG study 83–02 have been performed. 34 This was a randomized Phase I/II study of escalating doses for Hyperfractionated radiotherapy (HF, 1.2 Gy twice daily to doses of 64.8, 72, 76.8, or 81.6 Gy) and Accelerated Hyperfractionated radiotherapy (AHF, 1.6 Gy twice daily to doses of 48 or 54.4 Gy) with carmustine (BCNU) for adults with supratentorial glioblastoma multiforme (GBM) or anaplastic astrocytoma. The study has revealed that GBM patients who received the higher HF doses had survival superior to the patients in the AHF arms or lower HF doses.
The


In all cases, we set (Kocher;
7
Perez and Brady,
45
p. 99):

and

The meaning of the symbols used is the following:
α
α
α
The delivery of irradiation takes place at 08:00 and 16:00 every day, 5 days per week (no irradiation during weekends). The distribution of the absorbed dose in the tumour region is assumed to be uniform. It should also be noted that carmustin, which was administered to all patients enrolled in the RTOG—83–02 study, is assumed not to significantly modify the relative effectiveness of the radiation therapy schedules considered, as the chemotherapy administration schedule was the same for all patients.
The first process that takes place before the application of the operators is the discretization of the anatomic region of interest and the construction of the corresponding hypermatrix. The imaging data (e.g. T1 gadolinium enhanced MRI slices, PET slices etc.) including the definition of the tumour contour, its metabolically active sub-regions and the anatomical structures of interest, the histopathological (e.g. type of tumour) and the genetic data (e.g. p53 status and other molecular data) of the patient are collected. The clinician delineates the tumour and the anatomical structures of interest by using a dedicated computer tool. In the case of radiotherapy, the planned distribution of the absorbed dose (e.g. in Gy) in the region of interest is also acquired. For the purpose of the 3D reconstruction and visualization of both the initial tumour and the simulation outcome, the 3D visualization package AVS/Express 4.2 has been used, (for details concerning the use of AVS/Express in the simulation model refer to Stamatakos et al). 18 The description of the biological activity of the tumour is implemented by introducing the notion of the “geometrical cell (GC)”, the elementary cubic volume of the 3D discretizing mesh covering the region of interest as previously mentioned.
We assume that each GC of the mesh initially and normally accommodates a Number of Biological Cells (NBC). However, the maximum number of biological cells that is allowed to be accommodated within a GC is assumed to be NBC + [a fraction of NBC]. NBC apparently depends on the selected size of the GC and determines the quantization error of the model. The fraction of NBC considered in the code executions in this paper was 1/10 as this was shown to be the optimal one from both the convergence and CPU time demands points of view. 24
Typical clonogenic cell densities are 104 to 105 cells/mm3,4 Since most GBM tumours are poorly differentiated and rapidly growing, we assume a clonogenic cell density of 2 × 10⁵ cells/mm3 in the proliferating cell region, 105 cells/mm3 in the G0 cell region and 0.2 × 10⁵ cells/mm3 in the dead cell region of the tumour.
It is noted that each multidimensional element of the proposed hypermatrix has a clear physical and/or biological meaning (e.g. number of biological cells within a given phase, number of therapy hit cells residing in a given phase etc.). Therefore, the hypermatrix (such as the exemplary one outlined above) is used to describe the distribution of several critical physical and biological quantities over space and time.
Operator Based Presentation of the Simulation Model Basics
In the following the various processes constituting the entire simulation algorithm are briefly and separately described with reference to the corresponding operators.
Operator fT
Time is discretized and incremented. One hour has been adopted as the unit of time since 1h is the approximate duration of mitosis, the shortest cell cycle phase. According to the prescribed radiotherapy scheme the specific instants corresponding to the delivery of a radiation dose to the tumour region are defined. In each time step the geometrical mesh is scanned and the updated state of a given GC is determined on the basis of a number of behaviour algorithms:
Operator fO
During each scan of the discretization mesh the effect of the oxygen and nutrient provision on the cells of each geometrical cell is taken into account. This provision, determining the metabolic potential of a region, is based on the imaging data and determines the distribution of the tumour cells in the proliferative, dormant and necrotic states within the regions without taking into account the eventual therapeutic interventions effects. Furthermore, distribution of the cells over the cell cycle phases (G1, S, G2, Mitosis) is considered based on experimental evidence (Katzung (Ed), 37 ).
Operator fH
(I) At the time instants corresponding to the delivery of a specific radiation dose to the tumour (according to the prescribed radiotherapy scheme and the acquired distribution of the absorbed dose in the region of interest) the number of cells killed in a particular GC is calculated based on the Linear Quadratic (LQ) Model, which is widely used in the pertinent literature.5,7,38,39 The fraction of cells surviving from a radiation dose D is given by

where α (Gy−1) and β (Gy−2) characterize the initial slope and the curvature, respectively, of the survival curve.
In an untreated tumour simulation case, the dose D would be set to zero.
(II) Lethally damaged cells following exposure to radiation undergo two mitotic divisions prior to death and disappearance from the tumour. 39
Note: Any eventual molecular perturbators of the cell surviving fraction are to be incorporated into this operator.
At each time step the time registers of all GCs are incremented by one hour. Cell loss due to apoptosis and necrosis is computed. According to the cytokinetic model appearing in
23
possible transitions of the cells within a GC include: G1 →S (if time spent in the
The cell cycle duration TC has been taken equal to 40 h. This is the average of the cell cycle durations we have found in the literature for GBM cell lines.40,41 In Katzung 37 the approximate percentage of the cell cycle time spent in each phase by a typical malignant cell is assumed as follows: TG1 = 0.4TC, TS = 0.39TC, TG2 = 0.19TC, TM = 0.02TC. The duration of the G0 phase is taken to be TG0 = 25 h. 42
The cell loss factor (CLF) is considered equal to 0.3. 43 In 44 the authors note that cell loss is mainly due to necrosis (CLFN) and apoptosis (CLFA) and that gliomas have a low CLF in general. We assume that the total CLF (0.3) is the sum of the CLFN (0.27) and CLFA (0.03). We hypothesize low levels of apoptotic cells for GBM, as we have found that this is in general the case for gliomas.35,36,44
Operator fE
The differential tumour expansion and shrinkage algorithms are based on the use of random number generators in conjunction with adequately formed morphological rules. These rules lead to tumour shrinkage or expansion conformal to the initial shape of the tumour (if the mechanical properties of the surrounding normal tissue are considered uniform around the tumour and the tumour is not in contact with practically undeformable tissues such as bone). Two versions of the expansion and shrinkage algorithms have been tested. First version (a): For each GC, one out of the six possible directions of shrinkage or expansion is randomly chosen (Cartesian coordinate system XYZ centered at the current GC. Each axis defines two possible directions of movement). Second version (b1) Shrinkage: The outermost tumour GC is detected along each one of the six possible directions of shrinkage (Cartesian coordinate system XYZ centered at the current GC. Each axis defines two possible directions of movement). Its “6-Neighbour” GCs belonging to the Tumour (NGCT) are counted. The direction corresponding to the maximum NGCT is finally selected out of the six possible directions as the direction along which the shifting of the GCs will take place (shifting direction). In case that more than one shifting directions have the same maximum NGCT, then the selection is based on the use of a random number generator. Second version (b2) Expansion: A similar, though inverse, morphological—mechanical rule can be applied in the case of tumour expansion. The need for the formulation of the second improved version of the tumour shrinkage and expansion algorithm has arisen from the inspection of the macroscopic results of the simulation algorithms. Specifically, the completely random selection of one out of the six possible shifting directions, according to the first version, results in a premature extensive fragmentation of the tumour region in case of radiotherapy, which is usually incompatible with clinical experience. The general trend is a conformal shrinking of most solid tumours (Perez and Brady, 45 Figs. 1—4, p. 10). Using the second version of the algorithms this problem is solved. The mechanical properties of the surrounding normal tissue are considered uniform around the tumour, with the exception of an absolute lack of deformability of the bone. As a first approximation immunological reactions, invasion and formation of metastases have been ignored.

The proposed ten levels of biocomplexity.

number of surviving tumour cells as a function of time for the glioblastoma tumour with mutant p53 gene (see section 6). The radiotherapeutic schemes correspond to schemes considered by the RTOG 83–02 clinical study.
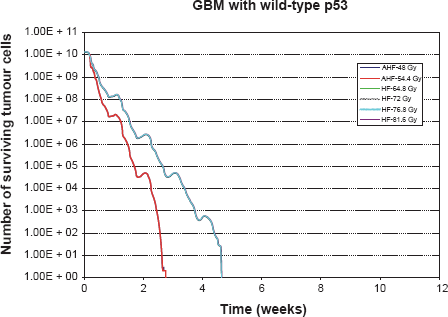
Number of surviving tumour cells as a function of time for the glioblastoma tumour with wild-type p53 gene (see section 6). The radiotherapeutic schemes correspond to schemes considered by the RTOG 83–02 clinical study. The curves on the right correspond to the HF schedules whereas the curves on the left correspond to the AHF schedules.
After having completed a scan of the discretizing mesh the oxygen and nutrient field is updated based on the criterion determining the relative position of the proliferative, dormant and necrotic regions of the tumour. The reason for this process is to take into account any eventual expansion or shrinkage of the tumour that would lead to a perturbation of the previous metabolic potential field.
Results
In order to clarify the actual effect of the composite discrete operator

Number of surviving tumour cells as a function of time for the glioblastoma tumour with intermediately adjusted radiosensitivity parameters (see section 6). The radiotherapeutic schemes correspond to schemes considered by the RTOG 83–02 clinical study.
More specifically, the inspection of the simulation results reveals that AHF schedules, which employ a higher fraction dose compared to HF schedules, seem at first to be beneficial as they achieve the maximum tumour cell kill at some instant. Nevertheless, the duration of the AHF schedules is smaller; as a result, if they fail in eradicating “all” tumour cells, tumour repopulation begins earlier (as in the cases of the tumour with mt p53 and the tumour with intermediate radiosensitivity). Only in the case of the tumour with wt p53, do all radiotherapy schemes kill all the clonogenic cells we have initially assumed (although this may not be the case in reality due to considerable instabilities of the simulation when it comes to the last few living tumour cells (chaotic behaviour limits)), so the tumour does not regrow after the end of the treatment. Of course, regions of potential microscopic disease have not been considered, and the accuracy of the simulation model decreases as the number of tumour cells is reduced.
The introduction of operator notation into the process of modeling malignant tumour response to therapeutic schemes has led to a brief and comprehensive description of the major steps of the simulation process. In this way highly complex algorithmic treatments are decomposed into simpler procedures which are readily identifiable by the wider research community. The use of mathematical symbols to denote complex algorithmic processes is expected to function as a stimulant for the advancement of multilevel biological modeling through
Obviously the treatment presented should be viewed only as an initial step of a rather long term modeling process as more and more experimental and clinical knowledge could be incorporated into the models which are under continuous development and optimization. Specific aspects that are currently addressed in parallel include i.a. the mitotic potential categories of the cancer stem, progenitor and differentiated cells (leading to a new dimension in the discrete abstract space),28,29 adjacent normal tissue response,
46
molecular networks (adapting the cell survival probability to the patient individualized context), chemotherapy optimization20,21,28,29 etc. A possible application of the approach presented in this paper is on the development of the
Conclusions
The introduction of the proposed hypermatrix and operator notation in order to denote, decompose and identify complex biological mechanisms that contribute to the hypercomplex phenomenon of malignant tumour growth and response to therapeutic schemes has been presented through the use of a discrete mathematics simulation model concerning radiotherapy response. Several aspects of the model had been developed by our research group in the past. Symbolic operator notation has provided a compact way of describing the most crucial simulation steps thus offering a possible basis for quantitative multilevel biology based on discrete mathematics. Furthermore, simulation results mimicking branches of the RTOG 83–02 clinical study have provided both clarification of the actual content of the composite discrete operator and additional evidence for the potential of the simulation approach presented.
Disclosures
The authors report no conflicts of interest.
Footnotes
Acknowledgements
This work was supported in part by the European Commission under the projects “ACGT: Advancing Clinicogenomic Trials on Cancer” (FP6–2005–IST-026996) and ContraCancrum: Clinically Oriented Translational Cancer Multilevel Modelling” (FP7-ICT–2007–2–223979). The authors acknowledge N. Graf, University Hospital of Saarland and N. Uzunoglu, National Technical University of Athens for stimulating discussions as well as the anonymous reviewers for their highly constructive comments and suggestions.