
Abstract
Colorectal cancer (CRC) is one of the major causes of death in the developed world and forms a canonical example of tumorigenesis. CRC arises from a string of mutations of individual cells in the colorectal crypt, making it particularly suited for multiscale multicellular modeling, where mutations of individual cells can be clearly represented and their effects readily tracked. In this paper, we present a multicellular model of the onset of colorectal cancer, utilizing the cellular Potts model (CPM). We use the model to investigate how, through the modification of their mechanical properties, mutant cells colonize the crypt. Moreover, we study the influence of mutations on the shape of cells in the crypt, suggesting possible cell- and tissue-level indicators for identifying early-stage cancerous crypts. Crucially, we discuss the effect that the motility parameters of the model (key factors in the behavior of the CPM) have on the distribution of cells within a homeostatic crypt, resulting in an optimal parameter regime that accurately reflects biological assumptions. In summary, the key results of this paper are 1) how to couple the CPM with processes occurring on other spatial scales, using the example of the crypt to motivate suitable motility parameters; 2) modeling mutant cells with the CPM; 3) and investigating how mutations influence the shape of cells in the crypt.
Introduction
Colorectal cancer (CRC) arises from the buildup of mutations in the cells of the colonic epithelium that lines the walls of the gut. In particular, these mutations occur in structures known as colonic crypts, a series of test-tube-shaped invaginations in the wall of the large intestine. These mutations cause cells to proliferate without the usual cell cycle regulation and to alter their mechanical properties, eventually leading to polyp-type formations where all structure of the epithelium is lost. 1
Much work has been done to try to understand the processes underlying the onset of CRC, both experimental and theoretical. 2 Early theoretical work mainly focused on the development and use of continuum models of the crypt, and CRC, and consisted primarily of compartmental models.3, 4 However, some of the first modeling work in the crypt was actually undertaken using a two-dimensional cellular automata (CA) model to investigate the distribution of cell types within the healthy crypt. 5 More recently, multiscale multicellular models, the spiritual descendants of the CA models, have been used to study the crypt and the onset of CRC. These approaches model the interactions of individual cells and study the resulting ensemble behaviors. They are the ideal modeling approach when you are looking to consider the effect of mutant cells, as you are able to adjust the properties of individual cells and see the effect on the tissue as a whole.
A multiscale model of the crypt based on the off lattice cell center was presented in Van Leeuwen et al. 6 This work coupled a previous model of the crypt 7 (which extended the earlier CA model but used force balance, instead of probabilities, to define cell-cell interactions) with a model of the cell cycle 8 developed for crypt epithelial cells. This model of a healthy crypt has since been extended to consider the effect of geometry on cell distribution, 9 to represent deformable substrates, 10 and to test hypotheses about active migration within the crypt. 11 The model has also been used to study the onset of CRC, by including cells with mutant phenotypes, and has given insight into how mutant cells take over the crypt.12, 13 Recently, additional three-dimensional multicellular models have been developed that consider cells of multiple types (absorptive and secretory), where the cell type is determined by the internal state of the cell, which is updated at each timestep according to the state of neighboring cells, allowing the composition of the epithelial layer to be investigated. 14
Rather than considering force balance, a popular method for representing interacting cells is the cellular Potts model (CPM), which is derived from the Ising model of ferromagnetics and the large-q Potts model.
15
The first use of the CPM was by Graner and Glazier
16
and by Glazier and Graner,
17
where they used it to represent the aggregation and sorting of cells
Wong et al. 26 presented the first model of the colonic epithelium using the CPM. This work focused on the pedigree model for cell proliferation. The pedigree model has an explicit population of immortal stem cells at the base of the crypt; these cells divide asymmetrically to produce an additional transit amplifying cell, which will subsequently divide a specified number of generations before differentiating. This pedigree model was compared to a positional-based model (where proliferative type is determined by external signaling factors) in Van Leeuwen et al. 6 which was shown to be unable to reproduce the colonizing of crypts seen experimentally. More recently, the random Boolean network models for cell-type specification have been coupled to a CPM to represent the spatial structure of the crypt. 27 This model includes cell mutations through the evolution of hyperproliferative cell phenotypes in the random networks, but does not change the mechanical properties of cells. For more details of the history of experiments and modeling of CRC, see the reviews by Kershaw et al. 2 and De Matteis et al. 28
The key biological aim of this work is to investigate whether mutant cells can colonize the crypt by altering their mechanical properties. Moreover, we will study how different these mutant cells need to be (compared to healthy cells) in order to become persistent in the crypt. In addition, we aim to demonstrate how to include mutant cell phenotypes (with altered mechanical properties) in to the cellular Potts framework.
The remainder of this paper is structured as follows. First we introduce the mathematics underlying the CPM and discuss how to couple this model to temporal models of subcellular processes such as those for the cell cycle. The result of this section is a multicellular model of a healthy crypt based on the CPM framework which is subsequently investigated. We then discuss a method for implementing mutant cell phenotypes in the framework and present a model for the onset of CRC. We conclude by discussing future avenues for this work.
A CPM Wnt-Dependent Model of a Healthy Crypt
We now detail the elements of our multicellular model of the crypt. The model is similar to that used in Osborne et al. 12 ; however, here physical interactions between cells are modeled using the CPM. As in Osborne et al. 12 , the cell cycle is represented stochastically with proliferation and cell cycle duration controlled by the level of an external stimulus, Wnt. This stimulus can affect different cell types in different ways, allowing mutant cells to be represented. Moreover, due to the multiscale construction of the model, a more complicated cell cycle model (like the one in Van Leeuwen et al. 6 ) or other subcellular processes (as reviewed in Kershaw et al. 2 ) could be included.
A CPM for cellular interaction
Here we use the CPM to represent the physical interactions between cells in the crypt. The traditional CPM has been used for many biological processes, including cell sorting,
16
morphogenesis,
18
and vascular tumor growth.
21
The CPM is described in detail in Izaguirre et al.
18
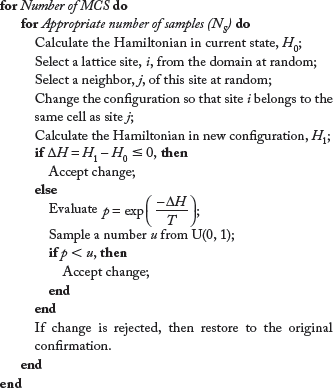
, among others, so here we just give an outline of the CPM and detail the changes to the general model, used previously, in order to represent the crypt and the onset of CRC. In the CPM, the spatial domain is discretized in to a finite collection of lattice sites, as shown in Figure 1A. Here, these sites form a regular lattice but they could be a set of arbitrarily connected sites of different shapes. Each cell is represented by a collection of such sites, and each site is contained in at most one cell. The shape of the cells is evolved by minimizing the energy of the system. This is done in a stepwise manner through evaluation of a Hamiltonian,

Potts model and the multiscale coupling. (
where the neighborhood of a lattice site is defined by the Moore neighborhood (ie, the eight sites that surround it, with appropriate adjustments for periodicity on the left and right domain boundaries). The parameter 
This choice is arbitrary, as we are just specifying that one sweep of the domain corresponds to the timestep,
The dependence of the CPM, and therefore the simulations, on these key model parameters is an important property of the CPM and allows multiple behaviors to be considered and also allows simulations to be tailored to the system being investigated and the questions being asked. A detailed investigation in to this dependence will be undertaken for our system of the colorectal crypt in the next section.
The Hamiltonian is central to all CPM simulations and specifies how the cells evolve as the simulation progresses. It is comprised of multiple components, which can be included in the model to represent different biological properties or phenomena depending on the problem you are investigating. This is analogous to the idea of including forces in off-lattice models.10,12,14,29 The most commonly used Hamiltonian components are cell-cell adhesion and area (volume in three dimensions) constraint. 17
In this model, we use


We include an area constraint in the Hamiltonian, and this leads to cells tending to a set target area 
Crypt domain and multicellular coupling
Following Osborne et al. 12 , we consider the crypt to be an unwrapped cylinder. Here we restrict cells to lie on the periodic regular lattice of width 50 and height 110 lattice sites. Once the center of a cell (defined by its center of mass) is above the height of 100 lattice sites, then it is assumed to be sloughed from the crypt and is removed from the simulation.
Cell proliferation is controlled by an imposed gradient of a signaling molecule Wnt (shown in Fig. 3). Cells of different types respond to the gradient in different ways. Normal cells can proliferate only in the lower third of the crypt where there is a plentiful supply of Wnt. While proliferating, each cell has a model of the cell cycle, and here we draw the duration of the whole cell cycle from a normal distribution with mean

Cellular Potts model of a healthy crypt. Illustrative snapshots of the crypt simulation at

Comparing the CPM to existing models for the crypt. (
Note that cell division can occur only between MCS and not during them, as each MCS represents the rearrangement of cells during one timestep. Also note that, if a cell is only occupying one lattice site when the subcellular machinery dictates the cell should divide (as could be the case for poorly chosen parameters or an unrealistic proliferation model), then the cell cannot divide and the simulation is halted.
In order to represent cell growth when a cell divides, its daughter cells have a target area of half the mature target area, and this increases linearly until it reaches the mature target area. In line with previous models of the crypt, we increase this over the first hour of the cell cycle.6, 12, 13
Traditionally, within the CPM framework, cell division is usually modeled by constantly increasing the target area of individual cells, and once the actual cell area reaches a predefined threshold, it divides. 18 The approach taken here is more in line with established multiscale multicellular frameworks and allows cells to divide based on internal cues, permitting a full coupling between cellular and subcellular levels.
Parameters, initial conditions, and simulation
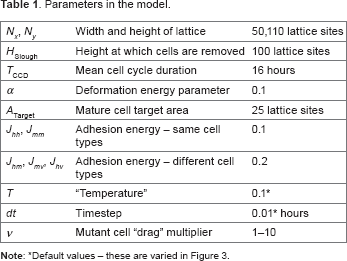
As specified above, all simulations presented here are on a domain of 110 lattice sites tall and 50 lattice sites wide, with periodic boundaries applied on the left and right, and cells are removed from the simulation when their center is more than 100 lattice sites from the base of the crypt. Cells have a mature target area of 25 lattice sites, and so the crypt is approximately 10 × 20 cell diameters (CDs) in size (in agreement with Osborne et al. 12 ). All model parameters are given in Table 1.
Simulations are initialized by creating a regular array of 10 × 20 square cells, each containing 25 lattice sites. Cell ages and cell cycle durations are drawn from a normal distribution with mean
All simulations are undertaken using the open source Chaste (Cancer, Heart, and Soft Tissue Environment) framework.29, 30 Further details on Chaste are available at http://www.cs.ox.ac.uk/chaste. All the codes used to run the simulations presented here are released under an open source BSD license. The code and tutorials on how to use it can be found at https://chaste.cs.ox.ac.uk/trac/wiki/PaperTutorials/PottsCrypt2015. The time taken to run simulations depends on the size of the domain, the number of cells, and the timestep
Simulations of a CPM Wnt-Dependent Model of a Healthy Crypt
Before looking at the effect of mutant cell phenotypes on the development of the crypt, we investigate the dynamic equilibrium of the crypt model with only healthy cells. In particular, we investigate the model's dependence on the dynamic parameters resulting from the use of the CPM:
Figure 2 presents results from two realizations of the model introduced in the previous section. In Figure 2A we present a snapshot at dynamic steady state (
A comparison of how the cell compression and vertical velocity vary as we move up a healthy crypt is given in Figure 3. In Figures 3A and 3B, the dependence of compression defined as
It is clear from Figures 3A and 3B that with larger values of
In order to fully investigate the way the parameters
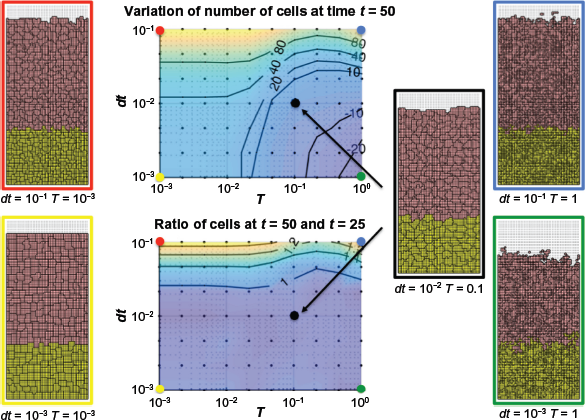
Selecting dynamic parameters for the crypt. Center top: deviation of cell number at
Mutations in the Crypt
Following Osborne et al. 12 , we now perturb the homeostatic healthy crypt by including mutant cells. Mutant cells are considered to have gained independence from proliferative signaling, and have altered their mechanical properties to promote invasion. 32 In fact, there is experimental evidence that Wnt-independent mutant cells (which have an inactivation of Ape) have stronger cell-stroma adhesion than normal Wnt-dependent cells. 33
Modeling mutant cells
When using off-lattice models for cell interactions, the increased adhesion often observed in mutant cells (in order to promote invasion) is represented by increasing the resistance to motion (“drag”) experienced by mutant cells. This is possible because in off-lattice models the movement of cells is determined by a force balance and therefore increasing the “drag” a cell experiences will represent increased adhesion to a substrate (see Osborne et al.
12
for details). The CPM framework utilized here does not use force balance to define cell movement, so there is no such thing as a “drag” parameter in the model as it stands. However, the reduced motility of specific cells in the CPM can be achieved by modifying the success probability of site swaps involving mutant cells. This can be achieved by rejecting a specified proportion of all moves involving mutant cells, and is implemented by adding the following term to the Hamiltonian, Equation (2):

The effect of mutant cells
In order to show how our implementation of mutant cells within the CPM framework behaves, we again follow Osborne et al.
12
, and place a patch of mutant cells with varying “drag” ratios in the crypt and track the size of the patch over time. Simulations of a healthy crypt as in the previous section are run until they are in a dynamic steady state (ie, for 50 hours), a patch of cells is then selected, all cells contained in the patch are converted to mutant cells, and we track the size and shape of the patch over time. We define the patch by specifying its center and radius, and all cells who's centers are within this radius from the center of the patch are defined to be mutant cells. In this work, we consider a radius of 2 CDs and investigate a “high patch”, placed at (5 CDs, 4 CDs) and a “low patch” placed at (5 CDs, 12 CDs); these can be seen in the

Invasion of crypts by mutant cells. (Center) Plots showing how the vertical height of the center of the lowest cell (solid line) and the highest cell (dashed line) in the mutant patch changes over time as the mutant cell “drag” ratio varies. The initial patch is a circle of radius 2 CDs, centered at a height of 4 CDs (top) and 12 CDs (bottom). Results are plotted at times
In Figure 5, we track how the position of the mutant patch is affected as we increase the mutant “drag” parameter, μ, from 1 to 10. We do this by tracking the position of the base (and top) of the mutant patch at times
We see from the central plots of Figure 5 that, as in the off-lattice case, 12 as the “drag” μ of the mutant cells increases, the base (and top) of the patch are lower down the crypt. This can also be seen in the illustrative simulation snapshots in Figure 5. Additionally, we see that in the case of a low patch, for a mutant “drag” ratio of greater than about μ = 6, the mutant cells are migrating downward. This downward invasion is more pronounced in these CPM simulations than the off-lattice simulations in Osborne et al. 12 (as also seen in Fig. 6), and may provide more evidence for the top-down mechanism for morphogenesis. 1

Comparison of CPM with center-based model. How the vertical height of the center of the lowest cell in the mutant patch changes overtime as the mutant cell “drag” ratio varies, with initial mutations centered at a height of 4 CDs, in (
In order to see how adjusting the Hamiltonian, as in Equation (5), compares to increasing the drag coefficient in off-lattice models, we present a comparison with some of the results from Osborne et al.
12
in Figure 6. As discussed above, the qualitative behavior is the same as we increase the mutant “drag” parameter, and we see that increasing the parameter μ has the same effect as increasing the drag coefficient in center-based simulations. By matching the value of μ for which cells invade down the crypt, below the initial height, we can see that (for the other parameters as defined) a value of the “drag” parameter of
One key advantage of the CPM over the traditional cell-center off-lattice model used previously is that the cell shape (ie, area and perimeter) is a driver of cell movement, and we are able to easily track how cell shape within the crypt is affected by the presence of mutant cells. In Figure 7 we present how, due to the presence of mutant cells, the average cell area,

Changes in cell shapes due the presence of mutant cells in the crypt, showing how the average area (
From Figure 7A, we see again that, in the case of a crypt of only healthy cells (dotted line) there is an increase in the level of compression as you go down the crypt. This was shown to depend on the dynamic parameters of the CPM in Figure 3A, and here the typical values (of
When including mutant cells with a high “drag” ratio, the mutant cells remain lower in the crypt (seen by the blue histograms in Figs. 7A-C and the simulation snapshots in Fig. 5) and the effect on cell shape is much more marked. We see that the level of cell compression toward the base of the crypt is much larger for all cells, but it is actually slightly less for healthy cells (solid and dashed blue lines, respectively, in Fig. 7A). (Note that the average compression decreases again at the base of the crypt compared to that of healthy cells. This is because there are fewer mutant cells there. In fact, there are none at the very base, as seen in the blue histogram, and therefore the contribution from mutant cells is less.) This is due to the fact that a by-product of cells having an increased “drag” in the CPM is that it will take longer for cells to grow and therefore they may divide before reaching full mature size, resulting in slightly more compressed cells. However, here the perimeter for healthy cells is smaller than the average for all cells (dashed and solid blue lines, respectively, in Fig. 7B). These two observations combine together when looking at the circularity, and we see that healthy cells have a relatively constant circularity in the crypt, whereas we see a decrease in the average circularity from all cells where mutant cells are present (dashed and solid blue lines, respectively, in Fig. 7C). The result of this is that, when a population of mutant cells is fixated in the crypt (as is the case for μ = 10), the circularity of the mutant cells is lower, suggesting that the cells are no longer approximately spherical in shape and are more irregular. This can be seen in Figure 8, where we present magnifications of the cell boundaries in a region of healthy cells and a region of mutant cells in an illustrative simulation with a large mutant “drag” ratio (μ = 10). We see that the cell boundaries are much more irregular in the mutant region, explaining the lower circularity when mutant cells are present.

Loss of mutant cell shape regularity. Snapshot of illustrative simulation for a low initial mutant patch with μ = 10 at
Discussion
In this paper we have presented a model of mutations in the colorectal crypt. This model builds upon previous work,6, 12, 13 by utilizing a different cell-based modeling paradigm, the CPM. The presented crypt model is the first, to the authors knowledge, to represent mutations, with different mechanical properties, in the colorectal crypt using a CPM. The implementation of mutations here represents a mechanism by which mutations could be represented in the CPM for other biological systems. The use of a CPM has allowed us to not only verify the results of earlier publications using off-lattice models 12 but has also enabled us to undertake a detailed investigation of the effect that mutant cells have on the shape of cells within the crypt. While parts of this would have been possible using the vertex-based model presented previously, 12 the level of cell deformations would of be much less observable.
This work could be extended in two key ways. First, further investigation into the workings of the colorectal crypt could be undertaken; in particular, other types of mutations could be investigated. In addition, the crypt model could be extended to include more realistic models of the cell cycle, as discussed in Kershaw et al. 2 or using a different representation for the cell cycle and cell fate specification, for example, a random Boolean network 27 or a state-based model. 14 Further models of cell interactions, for example, the subcellular element method (SEM), 34 could be used to represent the mechanical components of the system. The second main avenue of future work would include using the implementation of the CPM, developed here, for other biological systems, for example, problems in development or avascular tumor growth. This would involve introducing other components into to the Hamiltonian to represent other biological constraints, for example, surface area constraints and Chemotaxis,18, 21 but this would be straightforward given the modular framework developed and used here.
In summary, the work presented here gives new insight into the effect of mutations on the structure of the colorectal crypt and, moreover, presents a framework for including cell phenotypes with varied mechanical properties within the CPM.
Author Contributions
Conceived and designed the experiments: JMO. Analyzed the data: JMO. Wrote the manuscript: JMO. The author reviewed and approved of the final manuscript.
Supplementary Materials
Supplementary Movie 1
Video of simulation of healthy crypt from t = 0 to t = 100 hours with sensible motility parameters. The end point of this movie is shown in Figure 2A. SupplementaryMoviel.mp4 or http://youtu.be/pmj_KOX1LIg.
Supplementary Movie 2
Video of simulation of healthy crypt from t = 0 to t = 100 hours with inappropriate motility parameters. The end point of this movie is shown in Figure 2B. SupplementaryMovie2.mp4 or http://youtu.be/gszAMMQAKUA.
Supplementary Movie 3
Video of a comparison between three simulations of a crypt with mutant cells from t = 0 to t = 50 hours. The video shows ‘drag’ ratios of μ = 1, 5, and 10 (from left to right) with the initial mutant blob placed low in the crypt. Snapshots from this movie are shown on the left of Figure 5. SupplementaryMovie3.mp4 or http://youtu.be/RKiNzip2ZPM.
Supplementary Movie 4
Video of a comparison between three simulations of a crypt with mutant cells from t = 0 to t = 50 hours. The video shows ‘drag’ ratios of = 1; 5; and 10 (from left to right) with the initial mutant blob placed high in the crypt. Snapshots from this movie are shown on the right of Figure 5. SupplementaryMovie4.mp4 or http://youtu.be/8qlLFpV7ugI.