
Abstract
This paper presents the R/Bioconductor package stepwiseCM, which classifies cancer samples using two heterogeneous data sets in an efficient way. The algorithm is able to capture the distinct classification power of two given data types without actually combining them. This package suits for classification problems where two different types of data sets on the same samples are available. One of these data types has measurements on all samples and the other one has measurements on some samples. One is easy to collect and/or relatively cheap (eg, clinical covariates) compared to the latter (high-dimensional data, eg, gene expression). One additional application for which stepwiseCM is proven to be useful as well is the combination of two high-dimensional data types, eg, DNA copy number and mRNA expression. The package includes functions to project the neighborhood information in one data space to the other to determine a potential group of samples that are likely to benefit most by measuring the second type of covariates. The two heterogeneous data spaces are connected by indirect mapping. The crucial difference between the stepwise classification strategy implemented in this package and the existing packages is that our approach aims to be cost-efficient by avoiding measuring additional covariates, which might be expensive or patient-unfriendly, for a potentially large subgroup of individuals. Moreover, in diagnosis for these individuals test, results would be quickly available, which may lead to reduced waiting times and hence lower the patients’ distress. The improvement described remedies the key limitations of existing packages, and facilitates the use of the stepwiseCM package in diverse applications.
Introduction
Classification in high-dimensional spaces is a recurrent problem in many fields of science, for instance in cancer genomics or in spectrometry. Indeed, the data used in these fields are often high-dimensional and this hinders the direct use of most classification methods. Classifying cancer subtypes with high precision and predicting treatment outcomes are intensive research topics. Traditional cancer prognosis relies on a complex and inexact combination of assessment of clinical and histopathological data. These classic approaches, however, may fail when dealing with atypical tumours or morphologically indistinguishable tumor subtypes.
The use of molecular assays to analyze clinical tissues in the diagnosis likely allows for more accurate characterization of the aggressiveness of individual tumors and may allow for the early diagnosis of recurrence Michiels et al. 1 on the contrary, showed in seven large cancer prognosis studies that signatures derived by high-dimensional molecular data do not achieve prediction accuracy better than random. While each of these data types provides one view of the molecular machinery, it may be fruitful to view them as complementary. Lack of data integration may explain why in cancer research or chronic disease, mostly only moderate predictive accuracy can be achieved with clinical or single biochemical or molecular markers. 2 It has been shown in many studies that classification using multiple data types is more robust and achieves better accuracy than either of the data types alone. 3
The R package stepwiseCM (currently version 1.7.1) implements the stepwise classification strategy 4 to combine two heterogeneous data sets in a novel way. The package taken here mainly considers the practical utility of each classifier and takes a somewhat different stance in reviewing what is the optimal combination of two related data types. Unlike existing packages, it accepts partial measurements for one of the data sets, and yet achieves the same classification accuracy as existing packages (sometimes even higher). The ideal setting for the stepwiseCM package is as follows: two types of data can be used for prediction. One is the preferred method of choice in a practical setting (because of cost, or because it can be collected in a non-invasive way). The other should only be used for those patients whose prediction is likely to benefit a lot. An additional setting is one with DNA copy number data and mRNA expression data. In this set-up the copy number data is advised to be used at the first stage, and the expression data at the second stage. This is because DNA is a more stable molecule than the mRNA, hence easy to store and use in the laboratory. Section 5 includes real-life examples for both settings. The large number of samples being saved from measuring their high-dimensional covariates makes this package a promising alternative to its competitors.
In the next section, the motivations and the stepwise classification are shortly reviewed before delving deep into illustration of features and the use of the stepwiseCM package. Then, we present the technical details of the learning and predicting routines in Section 3. The practical use of the package is illustrated in Section 4. Section 5 represents application of the package to multiple real-world data sets that are not included in the package. Section 6 concludes with a discussion. It briefly discusses the limitations of the present package as well as how these limitations can provide inroads for further research. The R scripts for reproducing the illustrations throughout and the results reported in Section 5 are provided in the Supplementary File. The package is available from Bioconductor at http://www.bioconductor.org/packages/2.13/bioc/html/stepwiseCM.html.
Stepwise Classification
Biology is rapidly turning into an information science, thanks to enormous advances in biotechnologies leading to the ability to generate various types of high-dimensional data on the same sample. Consequently, there is an ever-increasing demand for integrative analysis of data sets from multi-platform genomic experiments or with patients’ clinical outcomes. This integrative analysis enables the understanding of complex biological processes that characterize a disease, as well as how these processes relate to the development of the disease. Recently a body of work emerged on combining different data types for the purpose of classification. Most of these are designed to combine clinical covariates with high-dimensional molecular data. For example, in Boulesteix et al. 3 a method that uses partial least squares (PLS) dimension reduction on molecular data and applies the random forest algorithm (RF) on both clinical and reduced molecular data is proposed LÊ Cao et al. 5 Proposed a mixture expert model to combine clinical and gene expression using different functions to incorporate both types of features.
These approaches are, however, not immune to problems. They share the following limitations: 1) Requirement of high-dimensional data on all patients, which may be costly, invasive or inefficient. Possibly, not all patients benefit from measuring their high-dimensional covariates. 2) Two heterogeneous data types are combined in the same model (some apply complex dimension reduction techniques to high-dimensional data prior to modeling) using sophisticated algorithms. However, there is not an unequivocal strategy for optimal combination of these two data types yet.
6
If the two data types have different classification powers (in terms of accuracy), unique contributions of the data type with weak prediction power may be overshadowed by the other. 3) Lack of flexibility in algorithm design. Existing packages do not allow users to insert their own classification algorithms. For example, the MAclinical package only works with the RF. 4) Application to integrate
The motivations for writing the stepwiseCM package are connected to the desire to develop improvements that address these limitations. This package has two aims:
To alleviate the restrictions on input data and algorithms types. Such exibility increases the package utility for diverse applications. To be cost-efficient. All existing packages aim at high classification accuracy. Although high-level accuracy is interesting and important, the focal point of this package is to be more economically affordable while preserving reasonable accuracy.
The basic logic behind the stepwise classification is that two available data sets (say

Schemata of the stepwise classification strategy.
To better understand the underlying principle of the classification strategy implemented in this package, we use the following three scenarios to illustrate how our algorithm predicts whether reclassification is beneficial for a new sample. Data sets used at the first and second stage will be termed In the scenario where a new sample (red filled triangle) is located in a good neighborhood in the data space of Where a new sample is located in a bad neighborhood in the data space of Where a new sample falls in a bad (or good) neighborhood in both data spaces (Fig. 2c–2d), the new sample will be assigned a moderate RS. Thus, reclassification with

Illustration of the scenario where (
Besides enjoying advantages existing approaches do not have, the classification method implemented in stepwiseCM is robust against variations produced by the different classification algorithms. 4 Such robustness is important, because the user may not know, most of the time, which algorithm is best beforehand.
While the stepwiseCM package introduced herein does not have constraint on the (inputs the data types requested to be used at the first and second stages) our illustrations, focus on the cases where the two data types are commonly available clinical data and high-dimensional molecular data. We use clinical data at the first stage and molecular data at the second stage, because clinical covariates are usually more easy to collect and relatively cheap compared to the latter. We are aware that in some cases this might not be true. The exible implementation of stepwiseCM allows a user to reverse the roles of the two data types or to supply two types of data with similar dimensions. To well integrate with the Bioconductor structure and make the package more accessible, the package is designed to accept an
Learning and Predicting Routines
In this section we give details about the inputs and outputs of the functions implemented in the stepwiseCM package.
Learning with Selected Classification Algorithms.
The first step of the stepwise classification is to obtain the prediction labels of the training set using two given data types separately. The goal of this step is to assess the classification power of the two data sets. Currently, only binary classification is allowed. The prediction is performed by calling the function Classifier. Users may choose the type of classification algorithms via the argument type. Currently, nine well-known algorithms are available. They are:
TSP: Top scoring pair
7
(only for high-dimensional data). PAM: Prediction analysis for microarrays
8
GLM: Logistic regression
9
GLM_L1: Logistic regression with L1 penalty
10
GLM_L2: Logistic regression with L2 penalty
10
SVM: Support vector machine
11
plsrf_x: PLS dimension reduction plus Random Forest
12
(only for high-dimensional data) plsrf_x_pv: Pre-validated PLS dimension reduction plus Random Forest
12
(only for high-dimensional data) RF: Random Forest
13
Prediction labels of the given set can be obtained either with the Leave-One-Out-Cross-Validation (loocv) or the K-fold (k-fold) cross-validation (CV) via the argument CVtype. If CVtype is set to “k-fold”, the given set will be split into
If parallel computation is desired, the function Classifier.par can be called instead. The user can take advantage of its powerful parallel computation capability by specifying the number of CPUs allowed in computation via the argument ncpus. When called, prediction on
Note that the output of this function will be used at a later stage to calculate the reclassification score (RS). RS does not depend on the classification algorithm used here. Thus, the types of classification algorithms that can be used are not constrained to the ones included in this package. The user can choose different algorithms among those already available, or use their own pre-made predicted labels. If so, this step can be skipped.
The function Classifier (or Classifier.par) returns an object of list class. It contains slots that include the predicted labels of the training set and the test set (if test was given).
Proximity Calculation.
One of the critical steps in the stepwise classification is to accurately assess the neighborhood information in the two data spaces. This package tries to find regions in each data space where misclassified samples are clustered. Thus, the degree of proximity between each pair of samples using the two heterogeneous data types needs to be calculated. It is possible that the two data sets are measured in different scales. For example, 
Function to calculate the proximity matrix is Proximity, which has the following arguments:
train: An object of train.label: A binary vector of length equal to the number of columns in train contains the actual class label of the training set. Should be numeric not factor. test: An object of N: The number of forests to construct. Since the RF constructs each tree by randomly sub-sampling from the original feature set, proximity between two observations differs slightly between runs. To attain a reliable estimate, this function repeats the whole process N times and returns their average. We recommend giving a large number to this parameter. Default is 50. Parallel: A logical argument determines parallel or sequential execution to be conducted. If set to \TRUE” the parallel computation will be executed. Default is FALSE. We recommend using this option when N is large and it is feasible to run the computation on a computer with multi-cores. ncpus: The number of CPUs requested for the parallel computation. Note there is a limit on CPUs used in one program. The current limit is 32 CPUs. Default is 2. If N < ncpus, computation will be executed on N CPUs.
This function returns an object of list class that includes a square symmetric matrix (
By extensive experiments with real data sets, we observed that the range of proximities obtained from clinical covariates differs from high-dimensional molecular data (see Figure 5). Unlike clinical data, the proximities from molecular data hardly level off. We suspect that this is due to the large number of features the latter contains. One of the possible remedies employed in this package is to utilize the rank of proximity instead of proximity itself. Our intuition is that although the numerical values are incomparable, they should appear in roughly the same rank order. We observed that the rank-based approach is usually superior.
Reclassification Score Calculation.
This is the pivotal part of the stepwiseCM package, which encompasses many new features. The predicted labels and the proximity matrices will be used in this step to calculate the reclassification score (RS). Function RS.generator aims to determine a group of samples that potentially benefit by measuring their covariates in B. An RS expresses our belief on how likely it is that a prediction from
When a new sample comes in, RS.generator projects it onto the data space of A to find its k nearest neighbours among the training set, then projects these pred1.train: A numeric vector contains the predicted class labels of the training set from A. pred2.train: A numeric vector contains the predicted class labels of the training set from train.label: A numeric vector contains the actual class labels of the training set. prox1: A rectangular matrix contains the proximities between the test set and the training set calculated from prox2: A symmetric square matrix contains the proximities of the training set obtained from type: The type of proximity requested to calculate the RS. If set to \proximity”, RS will be calculated directly from the proximity. If set to \rank”, the rank of proximity will be used instead (more robust). \both” returns both.
If “proximity” or “rank” is selected, function returns a numeric vector of length
Reclassification Reference Curve Generation.
The RS generated in the previous step is in a continuous scale that does not show which sample is recommended for classifying with which data set. The user needs to decide an RS threshold, which affects the final classification accuracy as well as the number of samples for which measurements in
Curve.generator has the following arguments:
RS: RS of the test set. pred1. test The predicted class labels of the test set obtained from pred2. test The predicted class labels of the test set obtained from test. label The actual labels of the test set. plot. it If set to “TRUE”, function generates a plot in which the Y-axis denotes accuracy and the X-axis denotes the percentage of samples that are classified with
Practical Examples in R
This section aims to illustrate the use of functions in the stepwiseCM package. The central nervous system (CNS) tumor data from Pomeroy et al. 15 that is included in the package will be used for the illustration. This data set has been used in predicting the response of childhood malignant embryonal tumours of CNS to the therapy. The data set is composed of 60 patients, of whom 21 patients died and the rest survived at least 24 months. Each sample has measurement on 7128 genes and 5 clinical covariates that are Chang stage (nominal), gender (binary), age (nominal), chemo Cx (Cytoxan, binary), chemo VP (Vincristine and Cisplatin, binary).
Classifier and Classifier.par.
We use the first 40 samples as the training set and the rest as the test set. We perform prediction on the training set via 5-fold CV using the Random Forest algorithm in both data settings. To visualize the concordance and discordance in prediction between clinical covariates and gene expression data, we project the training set onto the space defined by the first two components, which are derived through applying multidimensional scaling (MDS) to the proximity matrix for each data set separately (see Figure 3–4).

Visualization of the classification performance from the clinical data. Numbers denote the indices of samples in the training set.
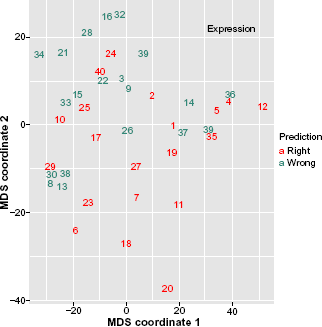
Visualization of the classification performance from the gene expression data. Numbers denote the indices of samples in the training set.
From two figures we observe that there are 7 samples for which only the clinical data made correct predictions. For 6 samples, classifier made correct predictions when using the expression data. For rest of the samples, predictions from both data sets were correct or wrong at the same time. Thus, clinical data is the practical choice for them.
Proximity.
Proximities between these 40 samples in the training set are calculated and visualized in Figure 5. Observe from Figure 5 it is clear that there are relatively large range differences in proximities from the two data types.
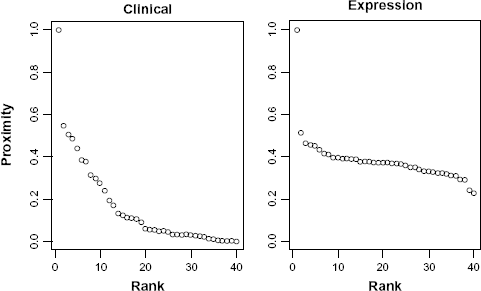
Proximities generated from the two data sets.
RS.generator.
To show that RS is informative in deciding the optimal data type for prediction, we generate RS for all samples and compare with their predicted labels from clinical and gene expression data, separately. Figure 6 shows the results that we expected. Most of the samples with high RS were misclassified by the clinical data, and correctly classified by the expression data. Thus, for those samples prediction with the expression data seems to be beneficial.
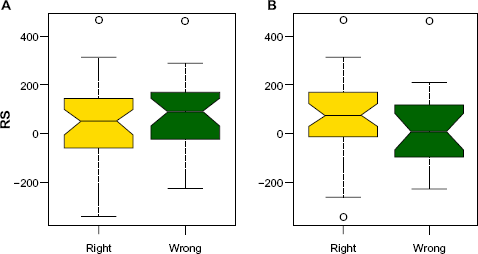
RS versus prediction performances from the two data sets. Box plot of the correctly classified (yellow) and misclassified (green) samples from the clinical data are shown in (
Curve.generator.
Now, we visualize the accuracy curve behavior when different numbers of samples are classified with gene expression data (Fig. 7). Observe that the expression data has higher classification performance (74%) than the clinical data (68%). Stepwise approach obtains the same accuracy as expression data by only utilizing the expression profiles of 30% of the samples. Accuracy begins to increase and reaches its maximum (76%) when 60% of samples are classified with the expression data. Passing further samples to expression data shows no improvement. Instead, after some point accuracy begins to decrease.
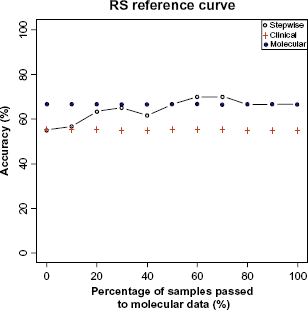
Accuracy curves from three different classification strategies.
Since there is a randomness inside the tree construction step in the RF algorithm, it may render a differing proximity matrix in each run. Consequently, this may lead to slightly different RS curves in each run. But, the difference will not be too big, and can be stabilized by setting the argument N to a large number.
Application
stepwiseCM is now applied to multiple real-world data sets that are not included in the package. The results reported herein are deemed to offer, to some extent, unique insights into the novel aspects of the adaptive stepwise classification central to stepwiseCM. To show general applicability of the package, the following two scenarios are considered:
A: Clinical; B: Gene Expression.
For this application we used a breast cancer data set.
16
Details of the data set are provided in Appendix A. We retrieved the expression profiles of 249 patients with primary breast carcinomas. Among them, 89 experienced recurrence or death from breast cancer and 160 were in remission. Clinical covariates included tumor grade, age, tumor size. To achieve more stable results, prediction accuracy is estimated using 10 times (
Observe from Figure 8 that the stepwise approach achieves higher accuracy than all four alternatives: clinical 59%, expression 63%, Plsrf-xz 59% and Plsrf-xz-pv 61% respectively. To achieve the same accuracy as the Plsrf-xz-pv, stepwiseCM requires the expression profiles of only ∼ 30% of the samples.

Accuracy curves from the four different classification strategies on the breast cancer data set. Each accuracy curve is mean of the 10 runs.
A: DNA Copy Number; B: Gene Expression.
The latest version of glioblastoma multiform (GBM)
17
gene expression and DNA copy number data of 160 patients with partial clinical information are used for this illustration. Details of array platforms, preprocessing, etc. are provided in Appendix A. The data set is comprised of four subtypes: Proneural (50), Classical (35), Mesenchymal (52) and Neural (23). Classifier is trained to discriminate the Proneural group from the rest. We used DNA copy number data at the first stage and the expression data at the second stage, because DNA is a more stable molecule than the mRNA, and hence easier to store and use in the laboratory. Similarly, the prediction accuracy is estimated using 10 times (
Figure 9 shows that the expression data has higher prediction power (96%) than the DNA copy number data (85%). Following the increase in the proportion of samples passed to the expression data, the accuracy from stepwiseCM also increases. The steepest increase is obtained when the proportion is 30%. The accuracy begins to level off after 50% of samples are passed to the second stage. Depending on the desired balance between accuracy and efficiency, a proportion somewhere between 30% and 60% of samples should be passed to the second stage.

Accuracy curves from the three different classification strategies on the GBM data set. Each accuracy curve is mean of the 10 runs.
Conclusion
This paper presents the R/Bioconductor package stepwiseCM to classify cancer samples using multiple heterogeneous data sets. The package provides a novel way of classification in which two types of data are used independently, so that distinct classification power of one will not be overshadowed by the other. After having presented the philosophy behind the method, we illustrated stepwiseCM to show the practical use of the method. In addition, we demonstrated the efficiency of stepwiseCM by comparison with reference methods on multiple real-world data sets.
According to the ‘no-free-lunch theorem’ by
18
no prediction algorithm is uniformly more efficient than the others. Hence, we do not claim that the stepwiseCM package is the panacea for all types of classification problems that use high-dimensional data. This package is not designed to compete with existing approaches in terms of prediction accuracy, although most of the times our algorithm produces the same accuracy as existing packages (and some times even higher). The focal point is the practical utility of the classifier. In general, relatively longer computing time is required for stepwise classification. For example, estimation of the RS for all samples in the CNS data set via 5-fold CV with parameters shown in section 4.3 took about seven minutes in a normal dual core CPU 3.16GHz, 4GB of RAM desktop computer. This number should be multiplied by the number of repeats (N) of the CV, for which we recommend
StepwiseCM may be of use in many practical settings. Standard diagnostic tests like the FIT test for colorectal cancer or the PSA-test for prostate cancer often rely on a cutoff value. In particular, for samples with values close to the cut-off, reclassification by a molecular profile may improve the accuracy of the prediction, whereas this is less likely to occur for values far from the cut-off. StepwiseCM would automatically detect this, and allows for inclusion of other predictive covariates like age in the first stage. Then, accuracy plots like Figure 8 allow the researcher to make an informed decision about which samples require additional molecular data. In addition, StepwiseCM is flexible. If in the near future molecular tests would become cheaper or when they are less invasive than their non-molecular counterparts, the role of the two types of markers may be reversed. The latter may, for example, apply to a blood-derived molecular profile, which would be used as a classifier to decide whether surgery is needed to obtain tumor tissue, in order to improve the classifier based on histological and pathological variables.
Among the possible extensions of this work, is the design of a multi-step approach. After observing the new sample's neighborhood information in the data space of
Author's Contributions
AO wrote the R package and the manuscript, performed data analysis. MvdW critically revised the manuscript. All authors read and approved the manuscript.
Disclosures and Ethics
As a requirement of publication the authors have provided signed confirmation of their compliance with ethical and legal obligations including but not limited to compliance with ICMJE authorship and competing interests guidelines, that the article is neither under consideration for publication nor published elsewhere, of their compliance with legal and ethical guidelines concerning human and animal research participants (if applicable), and that permission has been obtained for reproduction of any copyrighted material. This article was subject to blind, independent, expert peer review. The reviewers reported no competing interests.