
Abstract
Integrative analysis of multi-level molecular profiles can distinguish interactions that cannot be revealed based on one kind of data in the analysis of cancer susceptibility and metastasis. DNA copy number variations (CNVs) are common in cancer cells, and their role in cell behaviors and relationship to gene expression (GE) is poorly understood. An integrative analysis of CNV and genome-wide mRNA expression can discover copy number alterations and their possible regulatory effects on GE. This study presents a novel framework to identify important genes and construct potential regulatory networks based on these genes. Using this approach, DNA copy number aberrations and their effects on GE in lung cancer progression were revealed. Specifically, this approach contains the following steps: (1) select a pool of candidate driver genes, which have significant CNV in lung cancer patient tumors or have a significant association with the clinical outcome at the transcriptional level; (2) rank important driver genes in lung cancer patients with good prognosis and poor prognosis, respectively, and use top-ranked driver genes to construct regulatory networks with the COpy Number and Expression In Cancer (CONEXIC) method; (3) identify experimentally confirmed molecular interactions in the constructed regulatory networks using Ingenuity Pathway Analysis (IPA); and (4) visualize the refined regulatory networks with the software package Genatomy. The constructed CNV/mRNA regulatory networks provide important insights into potential CNV-regulated transcriptional mechanisms in lung cancer metastasis.
Introduction
Lung cancer has the highest mortality rate for both men and women in the world. Lung cancer includes non-small cell lung cancer (NSCLC) and small cell lung cancer (SCLC). NSCLC constitutes 85% of all lung cancer cases, and the other 15% lung cancers are SCLC. NSCLC has two major subtypes of histology: squamous cell lung carcinoma and lung adenocarcinoma (AC). 1 Surgery is the main treatment option for stage I NSCLC. 2 Unfortunately, 35–50% of stage I NSCLC patients will die from relapse or metastasis within 5 years after surgery and adjuvant chemotherapy for patient stages II and III have not shown good results. 3 It is a challenging issue for physicians to identify patients for chemotherapy. In spite of a few studies describing transcriptional profiling for lung cancer prognosis,3,4 currently, there is no fully validated clinical model for predicting lung cancer prognosis or chemoresponse. 5 Therefore, it remains an important research issue to identify prognostic and predictive genes for improving lung cancer treatment.
In the search of clinically important biomarkers, many studies have ranked genes based on clinical outcome and used top-ranked genes in a classifier. 6 However, rank-based feature selection methods cannot model the complex interactions among genes in disease. 7 It has been shown that the genes that have a statistically significant association with outcome results are not necessarily good classifiers.8–10 Discovering networks of molecular interactions is much more important than finding a list of genes in personalized medicine. 11 Molecular network analysis had been shown to be useful in disease classification 12 and identification of novel therapeutic targets. 13
DNA copy number variations (CNVs) refer to the copy number changes in a chromosomal segment, often observed in tumor tissues.14,15 Several studies have shown that CNV may be linked to the change of expression levels in some genes.14,16,17 Recent studies estimate that CNVs are responsible for >15% of heritable variation in gene expression (GE). 18 The relation between GE and DNA copy number is complex. For cancer cells in general, the impact of CNV on GE is found to be important. Many studies have investigated the relation between CNV and GE. Many of them consider correlation between GE and CNV, in a manner of gene by gene across all samples.19,20 Nevertheless, the correlation between CNV and GE was not consistent across all genes. 21 Moreover, each cancer is unique and has its own driver genes. Driver genes are involved in cancer pathogenesis, in contrast to “passenger genes,” which mutate during pathogenesis without having an effect on cancer. 22 It is an important issue to identify driver genes and distinguish them from “passenger genes” that have no discerning advantage. 23 Integrative analysis of CNV and GE could recognize potential cancer driver genes. 24
A challenge in finding the candidate drivers is that the number of regulators (potential candidate drivers) is large and is related to the amount of available data. As CNV regions contain a large number of genes, it is difficult to identify a driver gene that is a correct regulator. 25 Therefore, there is a need to use some information in addition to DNA copy number, such as GE, in the search for the functionally important driver genes. CONEXIC 23 is a method that combines both CNV and GE to detect driver genes located in a deleted or amplified region and constructs regulatory networks based on the identified driver genes. Each potential driver gene changes in some tumors and is considered to have a major role in regulating expression of a group of genes. 23 In this study, we present a novel framework based on CONEXIC to integrate CNV and GE and apply it to model lung cancer progression. First, candidate driver genes were selected from a pool of genes that were either amplified or deleted in NSCLC tumors, or were associated with metastasis at DNA copy number level or mRNA expression level. Second, CONEXIC was used to construct regulatory networks based on these candidate drivers and rank the importance of the driver genes. Third, because the predicted regulatory networks were large, Ingenuity Pathway Analysis (IPA) was used to reduce them to the networks of experimentally validated interactions. Finally, these refined regulatory networks were visualized with Genatomy. 26
Materials and Methods
DNA copy number and mRNA profiles in patient cohorts
Two datasets were used in this study. The first dataset contains 271 NSCLC tumor samples with DNA copy number profiles. These 271 samples are histologically divided into lung AC (n = 179) and squamous cell carcinoma (SQCC; n = 92). This dataset also contains GE profiles for 49 samples (n = 29 for AC; n = 20 for SQCC). This dataset is available in NCBI Gene Expression Omnibus (GEO) with accession number GSE31800. DNA copy number profiles of the first dataset were quantified for each sample with whole-genome tiling path array comparative genomic hybridization (aCGH). Details of the genomic array, DNA extraction, labeling, and hybridization were described previously. 27 aCGH is a technique for measuring the changes in chromosomal segments. 28 The main difference between CGH and mRNA expression is that DNA is hybridized rather than mRNA transcript. 29 CGH consists of log-ratio normalized intensities from disease versus normal samples. With resolution enhancements, aCGH is becoming more powerful. Consequently, this method has more advantages comparing to cytogenetic techniques such as fluorescence in situ hybridization (FISH). 29 The GE for this dataset was generated by Affymetrix GeneChips 30 and is available at GEO with accession number GSE31800.
The second dataset includes SQCC tumors with DNA copy number profiles (n = 201) and mRNA expression profiles (n = 132). DNA copy number values were generated with Agilent 415 microarrays. 31 Copy number estimations for each tumor were refined using tangent normalization. Tangent normalization divides tumor signals by signal intensities from the linear combination of all normal samples. 31 GE of this dataset was quantified using Agilent 244k microarrays. Preparation, hybridization, and processing to produce GE was previously described, 32 and the dataset is available in The Cancer Genome Atlas (TCGA) data portal 1 Lung SQCC section. 31 Clinical information of these two patient cohorts is shown in Table 1.
Clinical information of patient cohorts analyzed in this study.

Matching DNA probes to genes
DNA copy number values were assigned to the corresponding genes with a mapping scheme. DNA copy number datasets contain information about the chromosomal location of each probe and its copy number value. There is no chromosomal information of genes in GE datasets, requiring the use of some public repositories such as UCSC Genome Browser 2 and MatchMiner 3 . To find the chromosomal location for each gene, gene names should be entered to the software in a batch mode, and the output includes chromosomal location. The DNA copy number probes must then be matched to the corresponding genes. Among different methods to match genes to copy number probes, distance matching 33 was used. This method matches each gene to the closest probe that is on the same chromosome.
Detecting DNA copy number aberrations
There is a need to convert raw log-ratio values in the original aCGH data to absolute measures of DNA copy numbers. These absolute measures usually have three states: loss (less than two copies), normal (two copies), and gain (three to four copies). This process is named “calling.” 34 CGHcall was used to detect these different DNA copy number states. 34 CGHcall classifies different regions of CNV based on mixture models. First, it uses circular binary segmentation (CBS) to segment DNA copy number values of aCGH. The CBS method has been shown as one of the strongest methods for segmentation. 35 Second, CGHcall considers the fact that loss, normal, and gain levels are not uniform across all the samples. It allows fluctuation by using random effects. Finally, it uses a combination of segmentation results and mixture model to figure out the most likely state per segment. 34 This package was used in its default setting with human as the tissue type.
Conexic
CONEXIC 23 is a computational algorithm that performs integrative analysis of CNV and GE in cancer. This algorithm is based on module network 36 and combines matched GE and CNV of the samples to identify cancer driver genes. CONEXIC uses a Bayesian scoring function to detect the combination of modulators among the amplified or deleted regions, which explains the behaviors of GE modules across patient samples. The score measures how well a modulator can predict the behaviors of a GE module. CONEXIC searches for high-score modulators to recognize most probable driver genes in a stepwise manner: (1) selection of candidate drivers, (2) a single modulator step that builds an initial network between candidate drivers and gene modules, and (3) an iterative network learning step that improves the initial model. This method not only searches for important driver genes but also constructs regulatory networks. The concept of regulation networks or regulation program originates from Segal et al. 36 This software package was used in its bootstrapping mode.
A score function was used to rank cancer driver genes in the CONEXIC method. The score function is a Bayesian function that maximizes the joint probability of data and model structure. Let D be the data and S represent the structure of the network. The scoring function is:

The first term is the likelihood of the data for a given model, and it has a normal gamma distribution. The normal gamma distribution function gives higher score to the data with lower variance. Therefore, it splits the data into two completely different distributions.
The second part is a priori on the structure of data, which is a penalty score on network complexity. The penalty function has two parts. The first part penalizes the number of leaves in each regulation program using exponential distribution over the total number of leaves. The second part is a network width penalty function that penalizes (1) the number of genes in the module for each modulator and (2) the number of distinct split values that a modulator has. Hence, the scoring function would be:

The parameters of the score are β, x, y, which can be determined by optimizing the log-likelihood of data through cross-validation test.23,37
IPA
IPA 4 is a curated database that enables the search and visualization of experimentally confirmed molecular interactions and networks. Published molecular interactions can be explored from this web-based software application. This database gathers information from multiple resources, including experimental repositories or text collections of published literatures. In this study, only direct interactions among genes in human tissues were considered experimentally and confirmed molecular interactions in IPA analysis.
Genatomy
After constructing regulatory networks with CONEXIC and refining them using IPA, Genatomy was used for visualizing the networks. Genatomy is a software toolset for visualizing biological data such as GE, genotypes, and DNA copy number information. 26 The software package was used based on its default settings. The CNV and GE values were normalized with the min and standard deviation to be in the range of [-1, 1].
Results
The scheme to perform integrative analysis of CNV and GE contains the following steps (Fig. 1). First, candidate driver genes were selected using DNA copy number information and mRNA prognostic genes. CGHcall 34 was used to detect the aberrant regions of DNA copy numbers. Genes that showed consistent copy number aberrations in NSCLC compared with normal tissues in both datasets were selected. In addition, genes that had a significant association with patient survival time based on their copy number status were selected. The remaining candidate driver genes were mRNA prognostic genes identified in our previous studies. Second, after identifying candidate driver genes, CONEXIC was used to construct regulatory networks for good prognosis and poor prognosis NSCLC patients, respectively. Third, as the constructed regulatory networks were large, IPA was used to reduce the gene interactions to only experimentally validated ones. Finally, the Genatomy package was used to visualize the refined regulatory networks.

Overview of integrative analysis of DNA copy number and GE.
Selecting candidate driver genes
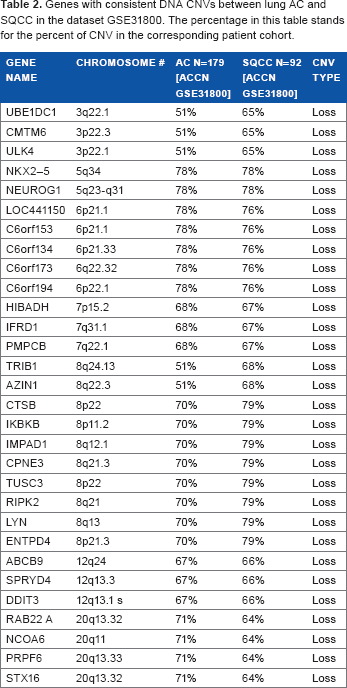
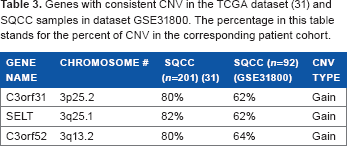
The selection of candidate driver genes consists of two parts: first, DNA copy number information was used to find the aberrant regions and second, mRNA prognostic genes previously identified in our studies7,38,39 were included. To identify candidate driver genes based on DNA copy numbers, the CGHcall package was used. This method distinguishes three different states of CNV: loss (deletion), normal, and gain (amplification). Genes in the normal state have two copy numbers, in a loss state have less than two copies, and in a gain mode have three or more copy numbers. The CGHcall package was run on three datasets (the dataset GSE31800 containing both AC and SQCC was analyzed separately according to histology). Based on results from CGHcall, genes that showed to be aberrant in more than 50 percent of the NSCLC tumor samples compared with normal tissues were selected for further analysis. Supplementary Tables S1–S3 list the genes with CNV in three corresponding datasets: SQCC and AC in the dataset (GSE31800), respectively, and SQCC in the TCGA data-set. 31 To further select relevant genes with CNV in NSCLC initiation, genes that had consistent CNV among different datasets were pinpointed. There were 30 genes in common with CNV of type loss between AC and SQCC in the dataset GSE31800 (Table 2). Among these genes, NEUROG1 was found to be an important marker in early detection of colorectal cancer. 40 LYN was a mediator of epithelial–-mesenchymal transition and a therapeutic target of dasatinib in breast cancer. 41 CPNE3, ABCB9, and AZ1N1 were shown to be involved in promoting NSCLC metastasis or mediating chemoresponse.42–44 Table 3 shows the common genes among SQCC tumors in the TCGA dataset 31 and the GSE31800 dataset. Only three genes (C3orf31, SELT, and C3orf52) were found to have consistent CNV with gain copy number aberration in both patient cohorts. Among them, C3orf52 was a prognosis gene of cancer in a US patent. 45 Genes listed in Tables 2 and 3 showed a consistent CNV in multiple patient cohorts and histology of NSCLC, indicating their important role in NCLSC initiation.
Genes with consistent DNA CNVs between lung AC and SQCC in the dataset GsE31800. The percentage in this table stands for the percent of CNV in the corresponding patient cohort.
Genes with consistent CNV in the TCGA dataset (31) and SQCC samples in dataset GsE31800. The percentage in this table stands for the percent of CNV in the corresponding patient cohort.
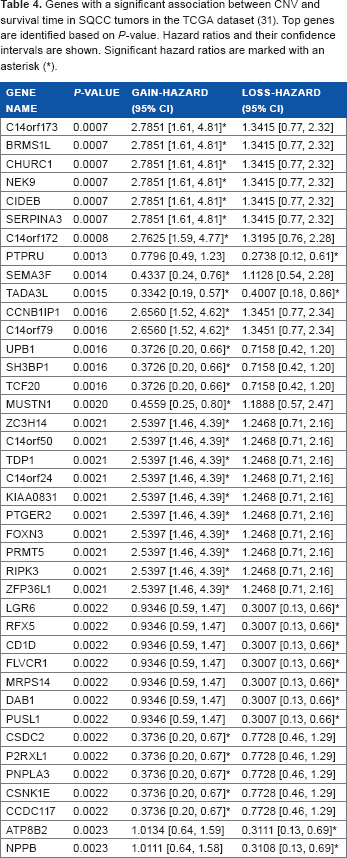
Next, we sought to identify prognostic genes using three categories of CNV status (amplification, normal, and deletion). A Cox proportional hazards model was fit for the SQCC patients in the TCGA dataset. 31 Genes with a significant (P < 0.05; Cox model) association between their CNV status and survival time in SQCC patients are listed in Table 4. Hazard ratios and their confidence intervals for the gain and loss categories are shown as well. A total of 30 genes had a significant association with patient survival time based on the gain status of DNA copy number, and 11 genes showed a strong association with survival time with their loss status. TADA3L is the only gene that had a strong association with survival time for both gain and loss DNA copy number value. TADA3L was associated with tumor suppressor gene p53 during the differentiation of hematopoietic stem and progenitor cells. 46 As metastasis/relapse is the major treatment failure of lung cancer, aberrations in DNA copy numbers of genes in Table 4 are related to NSCLC metastasis and relapse.
Genes with a significant association between CNV and survival time in SQCC tumors in the TCGA dataset (31). Top genes are identified based on P-value. Hazard ratios and their confidence intervals are shown. Significant hazard ratios are marked with an asterisk (*).
Additional candidate driver genes were from mRNA prognostic genes identified in our previous studies, showing a significant association with NSCLC patient survival and/or chemoresponse.7,38,39,47 These genes were further validated with Reverse transcription polymerase chain reaction (RT-PCR) assays of additional NSCLC patient samples (unpublished results). Supplementary Table S4 shows the complete list of candidate driver genes considered for constructing regulatory networks. Among these candidate driver genes, 30 genes had loss (Table 2) and 3 had gain CNV (Table 3) in the studied NSCLC cohorts. Forty genes had a strong association with SQCC survival time (Table 4), and the rest of the genes are mRNA prognostic genes identified in our previous studies.7,38,39,47 These candidate driver genes were used to construct regulatory networks.
Constructing CNV/MRNA regulatory networks
Having selected candidate driver genes as the first step, the second and third steps of the CONEXIC method were used to construct regulatory networks and rank the importance of driver genes based on DNA copy number and GE information.
In the second step of the CONEXIC method, the single modulator step, network initialization between candidate drivers and gene modules, was completed. Genome-wide CNV and GE datasets were filtered before this step. Specifically, genes with a variance above 0.2 in each patient cohort were considered for further analysis, because genes with a constant level of copy number or expression across all samples are unlikely to have a role in the regulatory networks. 23 After the data filtering, the TCGA dataset 31 was separated into good prognosis and poor prognosis groups. Patients who survived more than 3 years after surgery were grouped as good prognosis, whereas those who had survival time less than 2.5 years were grouped as poor prognosis. This single modulator step was performed with non-parametric bootstrapping for 10 times 23 on good and poor prognosis groups, respectively. The bootstrapping method guarantees the robustness of the results. The modulators that were selected in at least 60% of the runs were picked. These modulators were used for a final run of the single modulator step. After performing the second step, the relation among genes was initialized and the basic regulatory networks were created. These networks were considered as the starting point for the third step, which is the network learning step.
The third step of the CONEXIC method was performed with non-parametric bootstrapping to ensure robustness of the results. This step was also completed for good prognosis and poor prognosis groups, separately. This step was also run 10 times, and the candidate driver genes that were selected in 60% of the runs were selected for the final run. Supplementary Table S5 shows the top-ranked genes (modulators) after running the final network learning step. As a result, each of these modulators is related to a large number of genes in the constructed module network.
As mentioned earlier, part of candidate driver genes were mRNA prognostic biomarkers identified from our previous studies, with potential clinical utilities for personalized lung cancer treatment.7,38,39,47 After constructing regulatory networks, we sought to investigate the functional roles of these mRNA prognostic genes. As the regulatory networks were constructed separately for good prognosis and poor prognosis patients, respectively, investigating important driver genes and regulatory modules could potentially reveal important mechanisms in NSCLC progression and metastasis and their impact on clinical outcome. Table 5 shows the regulatory role of top-ranked prognostic mRNA biomarkers in poor prognosis patients. Specifically, SAMD4B, APOA2, ATAD4, and VASH1 were top-ranked modulators (driver genes) in poor prognosis, with a potential functional involvement in rendering adverse clinical outcome in NSCLC patients. The other mRNA prognostic genes in Table 5 were not modulators, but they are in the modules of other driver genes such as CTSB. Table 6 shows the regulatory role of the mRNA prognostic genes in the good prognosis dataset. In particular, ADH1B, CCL19, FHL1, VASH1, and RB1 were top-ranked modulators (driver genes) in good prognosis group. Other mRNA prognostic genes were not modulators, but they were in the modules that were regulated by driver genes such as RB1 and VASH1. In the comparison of Tables 5 and 6, modulators in good prognosis and poor prognosis groups were vastly different, suggesting that NSCLC tumor progression and the ultimate clinical outcome are driven by very different molecular mechanisms.
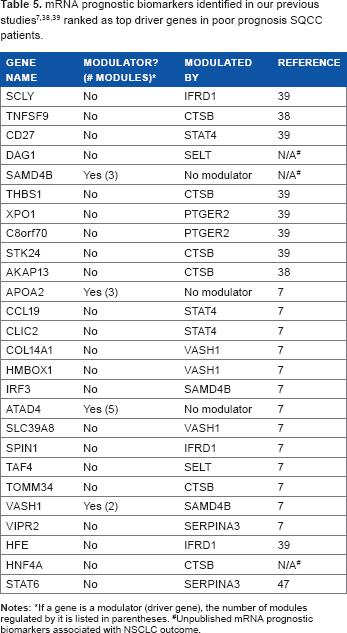
If a gene is a modulator (driver gene), the number of modules regulated by it is listed in parentheses.
Unpublished mRNA prognostic biomarkers associated with NSCLC outcome.

If a gene is a modulator (driver gene), the number of modules regulated by it is listed in parentheses.
Unpublished mRNA prognostic biomarkers associated with NSCLC outcome.
Refinement and visualization of CNV/MRNA regulatory networks
From the results of CONEXIC analysis, top-ranked driver genes were examined for further analysis. Specifically, CTSB was one of the top selected driver genes in poor prognosis patient group, and it was shown to modulate most mRNA prognostic genes, including TNSF9, THBS1, STK24, AKAP13, TOMM34, and HFE. Therefore, CTSB was selected for further analysis. For good prognosis group, RB1 was selected for further analysis because it is a prognostic biomarker gene by itself 7 and modulated multiple mRNA prognostic biomarkers, including C8orf70, AKAP13, MSX2, and 1CA1. In the regulatory network analysis, CTSB was related to 1,043 other genes in 10 different modules. RB1 modulated 681 genes in the 7 constructed regulatory modules. To refine the constructed regulatory networks, IPA was used to select experimentally validated molecular interactions in the module networks. Experimentally confirmed molecular interaction network for CTSB in poor prognosis SQCC patients is shown in Figure 2a, and the confirm network for RB1 in good prognosis SQCC patients is shown in Figure 3a, respectively. Next, Genatomy package was used to visualize the refined regulatory networks based on the text output from CONEXIC. Figure 2b shows the modules regulated by CTSB in poor prognosis SQCC patients, focusing on the modules involving previously identified mRNA prognostic genes. Similarly, Figure 3a shows RB1-modulated mRNA expression in good prognosis SQCC patients, focusing on the modules involving our identified mRNA biomarkers. These results reveal potential regulatory mechanisms of how CNV in a driver gene regulates the expression of a group of genes, among which are prognostic and predictive mRNA biomarkers associated with NSCLC metastasis and chemoresponse. The interactions among these genes in the computationally constructed regulatory networks were experimentally confirmed in the published literature with IPA.
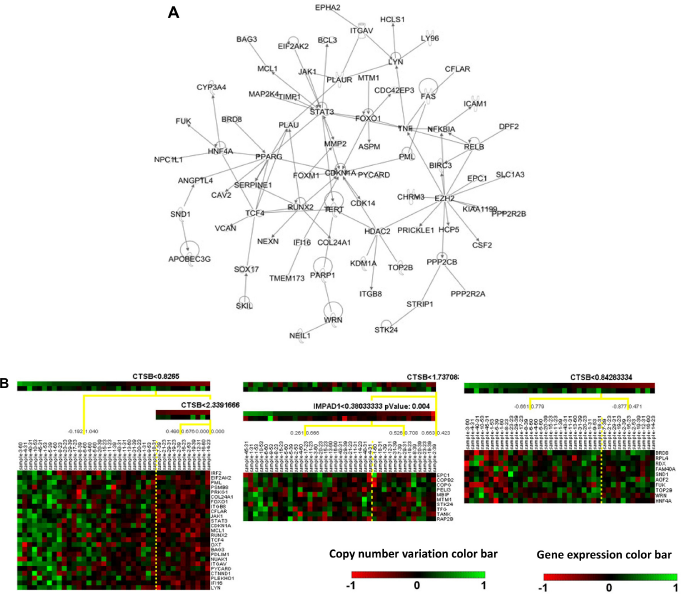
Regulatory networks of CTSB in poor prognosis SQCC patient group. (A) Experimentally validated network of CTSB in poor prognosis SQCC patients (31) with IPA analysis. (B) CNV/mRNA regulatory network of CTSB in poor prognosis SQCC patients (31).

Regulatory networks of RB1 in good prognosis SQCC patient group. (A) Experimentally validated networks for RB1 in good prognosis SQCC patients (31) with IPA analysis. (B) CNV/mRNA regulatory network of RB1 in good prognosis SQCC patients (31).
Discussion and Conclusion
Lung cancer is a complex disease involving numerous somatic mutations, amplifications, and deletions. Tumor relapse and metastasis is the major cause of treatment failure (ie, death) in lung cancer. Chromosomal CNVs are shown to be functionally important in regulating GE changes and genotypes in tumorigenesis and metastasis. While using GE changes alone has been shown to be a precise and feasible tool for clinical diagnostics and prognostics, 48 it does not necessarily reveal molecular functional involvement and cancer mechanisms. Integrative analysis of GE and copy number is expected to identify cancer driver genes and prioritize them, as well as reveal disease mechanisms and provide insight into novel therapeutic targets. Regulatory network approaches have been developed for detecting GE affected by DNA CNVs, genetic biomarkers, or motif data. Lirnet, 25 Geronimo, 37 and CONEXIC 23 are three major approaches based on module networks, which were originally conceived by Segal et al. 36 CONEXIC was used in this study to construct CNV/mRNA regulatory networks because it models CNV together with GE, whereas Lirnet and Geronimo have not been used in such applications before. There are some other regulatory networks that were developed to model other molecular data types,49,50 but not with GE and DNA copy numbers.
The novelty of CONEXIC is that it does not require the correlation between CNV and GE in the search for driver genes. Many methods for identifying driver genes among aberrant regions focus on the genes with correlated CNV and GE.51,52 As a matter of fact, in many cases, the expression of a driver gene is poorly connected with the DNA copy number. 23 The reason behind this is that CNV is only one of the many causes to induce up-regulation or down-regulation of a gene. In fact, the expression of many driver genes is less correlated with their copy numbers compared with passenger genes. In contrast, the expression of genes in a module is more related to the expression of the corresponding driver gene. The algorithm of CONEXIC was designed based on these biological contexts, which has the following advantages over other methods. First, by assessing both CNV and GE, CONEXIC provides a better way to find important areas in the aberrant chromosomal regions as potential candidate driver genes, comparing to the methods that consider only DNA copy number. Second, CONEXIC associates the expression of a driver gene to the expression of genes in the corresponding module in constructing regulatory networks. 23 However, this could be considered as a limitation of CONEXIC, as it does not consider CNV in constructing regulatory networks in the second and third steps of the algorithm. One of the future improvements on this method would be considering two types of regulators (GE regulators and CNV regulators) and combining these two types of regulators in constructing regulatory networks.
In this study, we designed a framework based on CONEXIC to integrate CNV with GE to identify important driver genes in NSCLC and reveal experimentally confirmed regulatory networks in metastasis. In our approach, the candidate driver genes were selected and validated using multiple patient cohorts. Instead of using Genomic Identification of Significant Targets in Cancer (GISTIC) method 53 as proposed in the original CONEXIC method, CGHcall 34 was used to classify different regions of CNV based on mixture models. The selected candidate driver genes had either consistent CNV in different NSCLC patient cohorts and histology subtypes or a strong association with patient survival information based on their CNV status or mRNA expression levels. Next, regulatory networks were constructed for good prognosis and poor prognosis patient groups separately. The candidate driver genes were the same for both groups. After running CONEXIC with bootstrapping, the top-ranked driver genes and the constructed regulatory networks were very different in both groups, indicating that different molecular mechanisms render different clinical outcomes in NSCLC patients. As these computationally derived networks contained a large number of modules, IPA was used to select the genes and molecular interactions in the modules that were experimentally validated and reported in the literature. In this way, the gene modules were refined to the experimentally validated ones. Finally, Genatomy was used to visualize the refined regulatory networks. These experimentally confirmed regulatory networks reveal important CNV-regulated transcriptional activities in NSCLC metastasis. As many genes in the candidate drivers were NSCLC prognostic or chemoresponse predictive biomarkers identified in our previous studies, these results shed light on potential innovative therapeutic targets for NSCLC treatment.
Author Contributions
Conceived and designed the experiments: NLG. Analyzed the data: SMI. Wrote the first draft of the manuscript: SMI. Contributed to the writing of the manuscript: NLG. Agree with manuscript results and conclusions: SMI, NLG. Jointly developed the structure and arguments for the paper: SMI, NLG. Made critical revisions and approved final version: NLG. Both authors reviewed and approved of the final manuscript.
Supplementary Files
Footnotes
Acknowledgments
We thank Julian Dymacek for editing the paper.