
Abstract
Objective:
Network analysis techniques often require tuning hyperparameters for optimal performance. For instance, the independent cascade model necessitates determining the probability of diffusion. Despite its importance, a consensus on effective parameter adjustment remains elusive.
Methods:
In this study, we propose a novel approach utilizing experimental design methodologies, specifically 2-Factorial Analysis for Screening, and Response Surface Methodology (RSM) for parameter adjustment. We apply this methodology to the task of detecting cancer driver genes in colorectal cancer.
Result:
Through experimental validation of colorectal cancer data, we demonstrate the effectiveness of our proposed methodology. Compared with existing methods, our approach offers several advantages, including reduced computational overhead, systematic parameter selection grounded in statistical theory, and improved performance in detecting cancer driver genes.
Conclusion:
This study presents a significant advancement in the field of network analysis by providing a practical and systematic approach to hyperparameter tuning. By optimizing parameter settings, our methodology offers promising implications for critical biomedical applications such as cancer driver gene detection.
Introduction
Social networks have played an important role in spreading information, opinions, ideas, innovations, and rumors around the world. 1 For this reason, several subjects are investigated through the analysis of societal networks, such as diffusion and influence models. One of the most widely used techniques for modeling diffusion processes is a cascade model. The active node v may attempt once to activate one of its adjacent active nodes with a probability of pv in cascading models beginning with seed nodes and continuing each step t. If it works, the new nodes will be launched in step (t + 1) and an identical operation shall be performed for each inactive node to activate them. Active nodes cannot attempt 2 activations of the same node, whether they are successful or not. This process will continue until a new node can no longer be activated.2 -6
A number of social network analysis works have recently explored the diffusion of information. A widely prevalent basic probabilistic model of information propagation through networks is the independent cascade model (IC model). The IC model assumes that the activation of one node in the network does not influence the activation of another node, which may not always hold true in real-world scenarios. Moreover, the model assumes a fixed probability distribution for the propagation of information or influence through the network. The performance of the IC model can be sensitive to the choice of parameters, such as the propagation probabilities or the seed nodes selected for activation. A set of relevant parameter values should be provided in advance for the IC model. However, knowing the likelihood of diffusion via links for a given network in advance is typically difficult. It is therefore a key research question to identify diffusion probabilities using links from an observed set of data about information dissemination
Saito and colleagues have been studying the parameters of an independent cascade model. They used the EM algorithm to define the problem as a probability function and estimate the probability of the links. 7 A timely asynchronous independent cascade model, where the diffusion probability depends on the timing of transport, was suggested by Guille and Hacid. Using machine learning methods, they were able to infer the diffusion probabilities based on features from Twitter’s Social Network. These studies do not reveal the diffusion probability for each connection and model based on the user’s extracted features. 8 Wang et al 9 learned the probability of diffusion in the IC model by assuming that the message is spread between 5 emotions and the diffusion probability differs from emotion to emotion. The issue of learning the diffusion probabilities for IC models is dealt with by Mashayekhi et al. They propose a weighted method for the estimation of diffusion probabilities, which takes into account an information from all previous cascades within the network. Consequently, it is scalable against baselines, resulting in Mashayekhi et al. 10
Even though there have been studies in the literature on IC model optimization using optimization techniques such as EM algorithms, diffusion probability is still tuned by a trial and error approach. GenIC used an IC model for the detection of cancer genes in colorectal cancer. In this study, diffusion probabilities were chosen by trial and error. 2 The independent cascade model edge probability pv is usually selected by trial and error; but selecting pv properly can improve the model to get maximum influence in the network. Experiment design is a statistical method to reach the best value of variables with fewer experiments. 11 The underlying mechanisms of cancer, which may help to identify it more accurately, can be revealed in the regulatory network modules when analyzed quantitatively.12 -14 The identification of cancer genes and their regulation is an important area of research in cancer systems biology.15 -17 In this study, we try to optimize the value of pv for the independent cascade model. The proposed model will be applied to predict cancer driver genes in the regulatory network for colorectal cancer.
Methods
Gene regulatory network
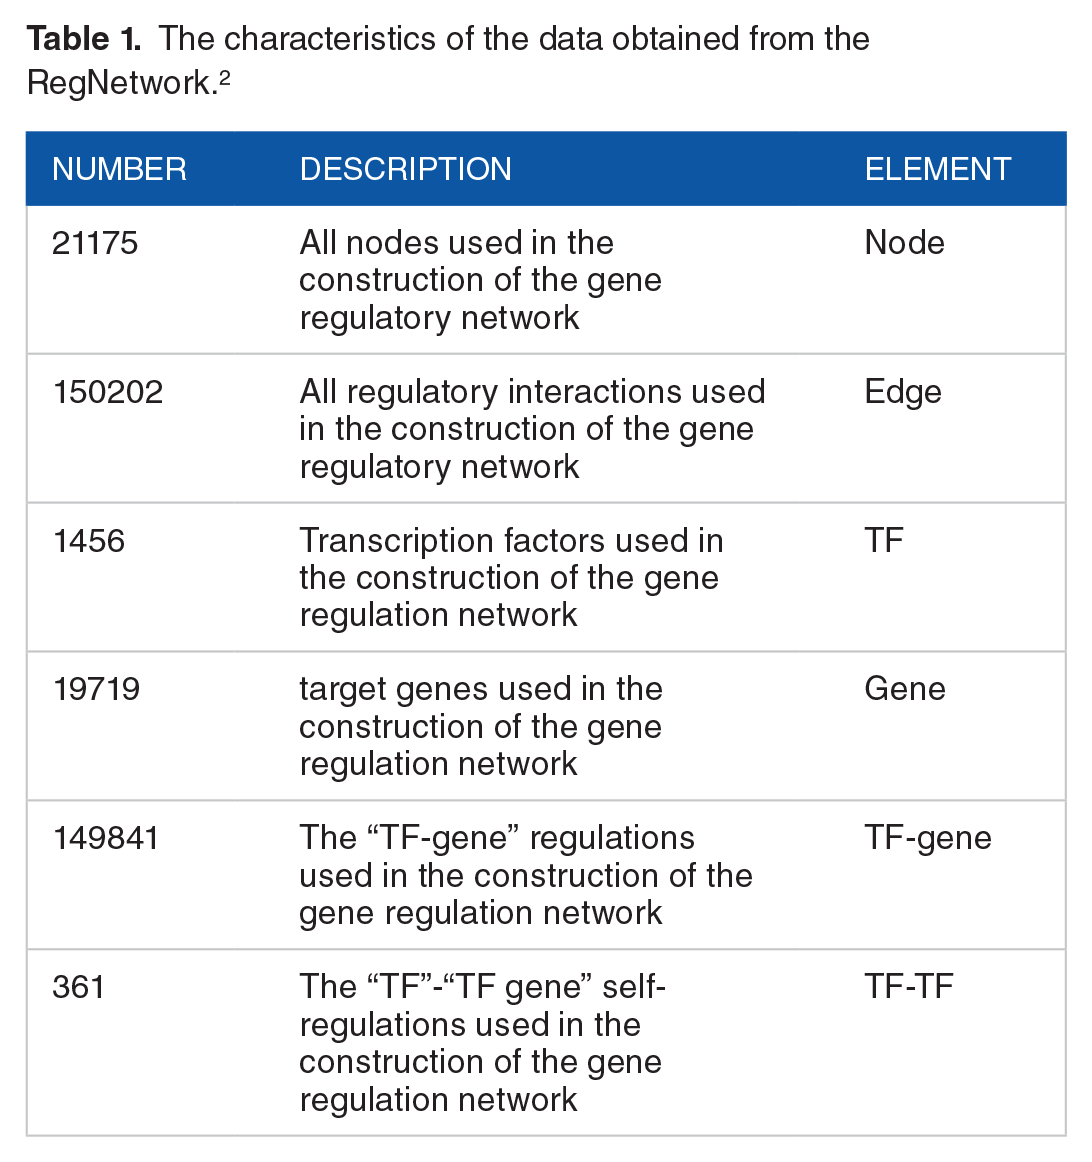
Gene regulatory network events are of critical importance to various physiological and developmental processes within cells, where the macromolecules, such as genes and ribonucleic acid, are coordinated to create operational responses to a variety of conditions. A disruption in the regulatory relationship between molecules within a cell is one of the causes of cancer. Therefore it is possible to identify the cause of the disturbance through the study of the regulatory network. 18 In order to build the gene regulation network in colorectal cancer (Figure 1), it was necessary to establish interactions and gene expression data (Table 1). We have used the dataset that was also used in Akhavan-Safar et al. 2

Network of the colorectal cancer gene regulatory network.
The characteristics of the data obtained from the RegNetwork.2
Response surface methods (RSM)
Design of Experiment (DOE) is a method that allows experimenters to organize their experiments and identify the relationships between causes and effects. As it cuts down on the number of tests needed, DOE is widely used in multidisciplinary scientific fields. 19
As good ways to optimize process parameters, a number of experimental designs have been selected. RSM designs come in a variety of forms, including factorial design, central composite design (CCD), Box Behnken Design. and D-optimal design. 20
Analysis of variance (ANOVA) is necessary to verify the model’s relevance and fitness since it clarifies whether the developed quadratic model has any real-world importance. It looked into the impact of process parameters and how they interacted. The propagation of error (POE) is taken into account to ensure the robustness of RSM designs. In experiments where uncontrollable components (noise) are assumed to be zero, POEs—a measurement of the standard deviation of transmitted variability in the output response—are caused by changes in key controllable process variables. 21
RSM makes the assumption that, within the experimental region, the relationship between the input and response variables is linear and constant. The best results from RSM are obtained from experimental designs that have a continuous response variable and few input variables. For intricate systems with lots of interacting components, it might not be appropriate. The accuracy of the fitted response surface model may be impacted by experimental mistakes or noise in the response variable, as RSM is sensitive to these factors.
The RSM experiment provides a numerical model or equation describing the reaction as an expression of individual factors and levels. A few key pieces of information related to the system under investigation can be identified within this mathematical equation; for example, major factors, factor interactions, and curvatures that indicate whether a response is linear in nature are identified. Another important indicator obtained from a mathematical model based on RSM is the change in direction and magnitude of factor levels to explore an emerging area for improved responses. This process improvement can be achieved using a model based on the steepest ascent. The steepest ascent will allow experimental progress to be made in specific directions with a view to assessing the potential for improving model performance. It is crucial for the experimenter to use all information collected in this model that describes a definite response, rather than relying upon suspicion or speculating about what experimental conditions will be applied in the future.
The starting conditions of an area that proves to have better test performance in the optimization phase of response may not differ much from a more desirable region. An introductory design that is essentially 2 levels of factorial test with repeated focal points may be used in the case of a linear RSM first-order model. However, 2 factors, 2 levels of factorial with center points, as shown in Figure 2, are also applied to a simple 5-point design. If there are only 2 important factors that have an impact on the required response. However, as is usually the case if the improved response region is not close to the original starting conditions, the amount and indication of the direct expressions in the equation below can be adjusted to specify the steepest ascent on the route which leads to 1. If the preliminary RSM test’s fitted model is linear, the response area Y shall be improved.

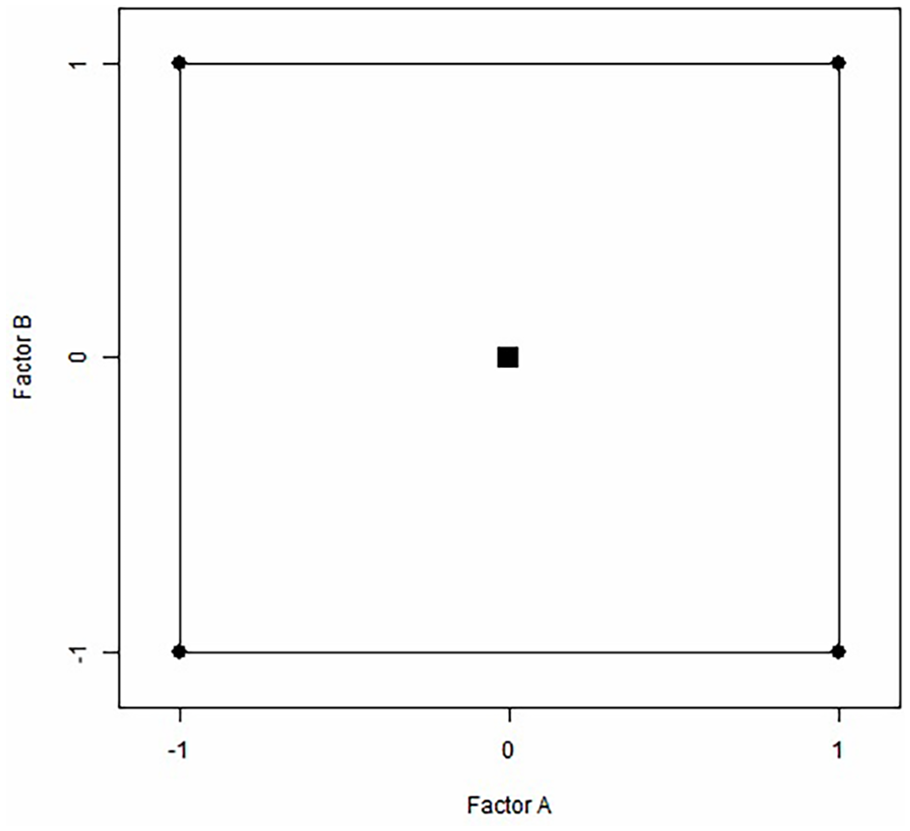
Utilizing the duplicated center and corner points, a simple RSM design. The 2 factors, probability diffusion and iteration, have high, low, and mid-level, respectively, and are represented by +1, −1, and 0, in that order. Square symbol indicates the center points.
Where b-value are parameter estimates that are unaffected by the factors’ scaling rule and characterize the scale and direction of the effects, and xi’s represent significant factor effects that are coded. Alternatively, if the desired response calls for minimization rather than maximization, it would be necessary to descend the path by the steepest descent. The units of measurement are removed by using coded variables, facilitating model interpretation. The lowest and highest values of all these factors are set at −1 and 1 respectively to decode the variables, while the midpoint level is coded as a zero value.22 -24
Two-factor factorial design
A custom 2-level, 2-factorial design with 5 replicated center points has been used to assess the absence of fit, in order to test the surface response and find a first order model. The 5-point design supplies information about possible curvature of the response, which was unable to be retrieved from a 2-level factorial.
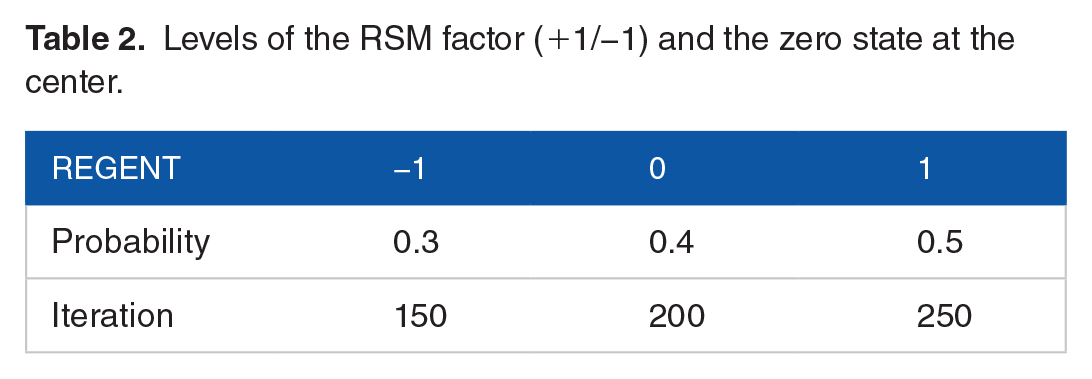
Considering the GenIC model, we choose factor levels as shown in Table 2. The response variable is the F-measure for the cancer driver gene (CDG) that the model can detect correctly. Using R and Python, experiments have been designed, statistical analyses have been performed and model predictions have been made.
Levels of the RSM factor (+1/−1) and the zero state at the center.
Path of steepest ascent
The first-order linear model forecast from the RSM experiment, which stated the connection between the response and the factors, was used to create a new set of experimental steps for determining the factor concentration for the experiment in the steepest ascent direction. In the fitted first-order model, it was necessary to take stages of sizes commensurate with the values of the |bi| parameter to reach a more optimal position on the steepest ascent route, in order to respond. Direction is according to the sign of b values.
The distance in steps from the RSM experiment’s center point was defined by a proportionality constant (ρ). The value of ρ is chosen by the experimenter and is frequently simply set to 1.25,26 To prevent achieving the value outside of the range of the probability of diffusion (0,1) in just a few steps, in this investigation, it was set to 0.5.
Experimental runs through the path
The route began at the RSM design space’s center and served as the starting point for the test’s steepest ascent before branching off to explore the surrounding area. To create a set of experimental runs with various diffusion probabilities and iterations of the IC model, an order of steps with equal spacing along the path was chosen. According to the sign of the b-value terms in the equation of the linear model, factors in each step grew or decreased. By calculating the b1 and b2 parameters in the linear model’s equation, the amount of rise and decrease of the factors was determined.
Results
Response surface methods (RSM)
Factor RSM design
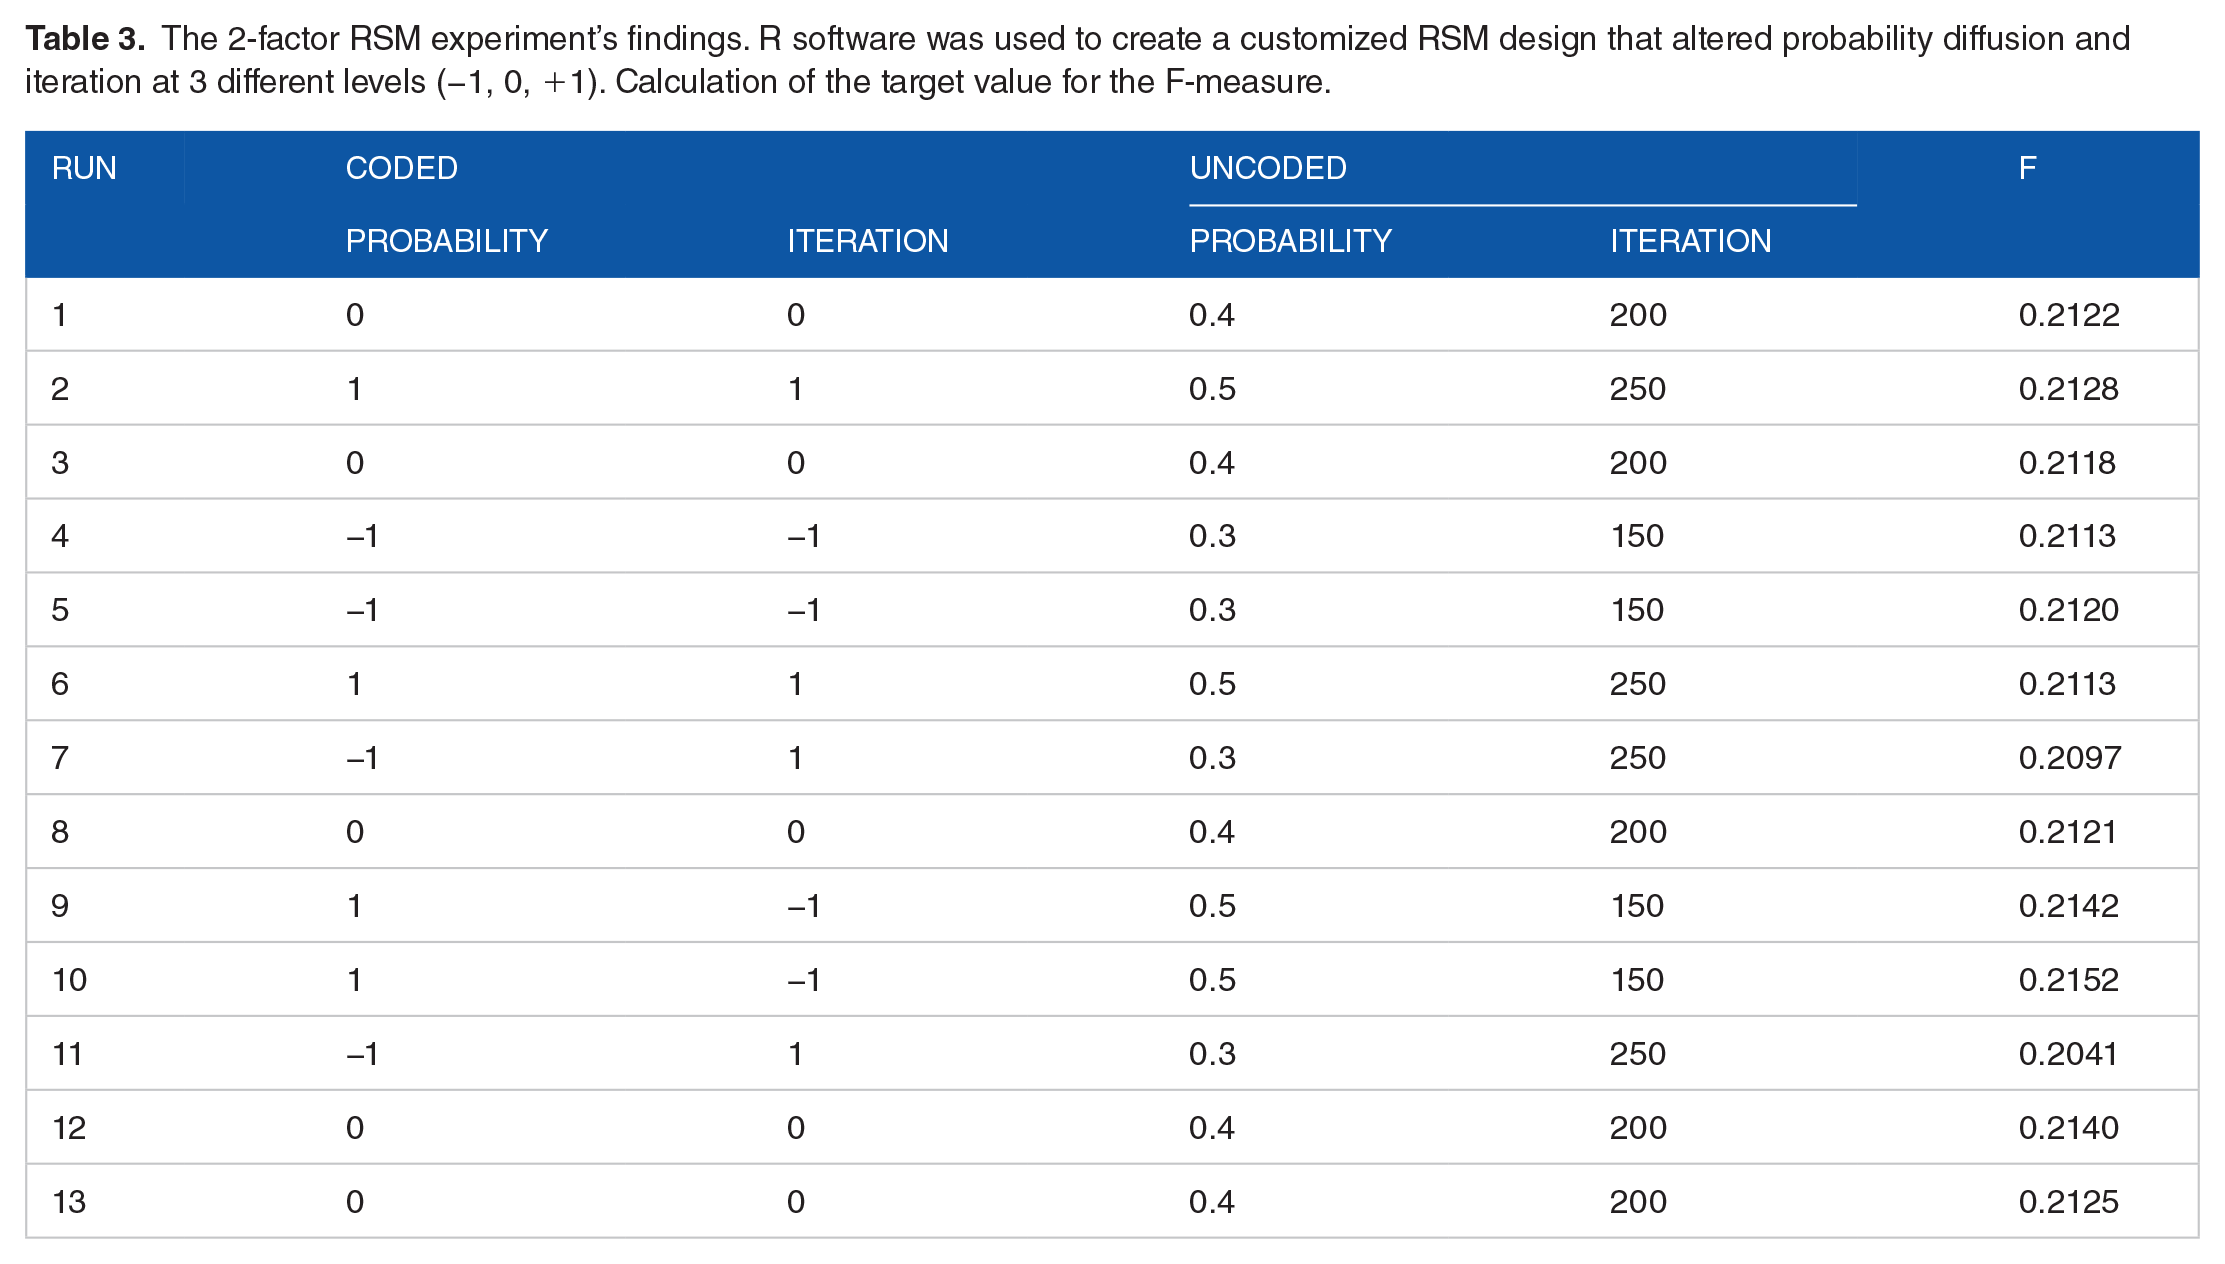
The 2 factors, diffusion probability and iteration, were varied at 3 levels (coded as −1, 0, and 1) using an RSM model. For each set of conditions, tests were randomly conducted with 3 values of diffusion probability (high, medium, and low; specifically, 0.3, 0.4, and 0.5) and 3 levels of iterations (high, medium, and low; specifically, 150, 200, and 250), resulting in a total of thirteen runs. The response was the F-measure for the cancer driver gene detected in each trial. For the fitting of models and for the steepest ascent, this response was analyzed at all standard levels. The response values were calculated using the 2 standard levels of factors with 2 repetitions for each 1 plus 5 center points that are shown in Table 3.
The 2-factor RSM experiment’s findings. R software was used to create a customized RSM design that altered probability diffusion and iteration at 3 different levels (−1, 0, +1). Calculation of the target value for the F-measure.
The model fit assessment for the response was conducted using R software. The overview of the system’s results suggested that a 2-factor model should be applied, based on a significant F-statistic. The linear fit has also been deemed to be a simpler and more practical option when determining the steepest ascent. Table 4 display the analysis of variance (ANOVA) of the linear model, which has been proven to be statistically significant. A significant main effect was found for the probability factor and the iteration factor, with statistically significant P-value of .0062 and .0110 respectively, so the linear model is an appropriate model here.
Analysis of variance (ANOVA) for the fitted linear model.

Equations (2) and (3) show the predicted response F-measure of the detected cancer driver gene, coded in and without code forms as a function of x1 and x2. The factors may consist of a wide range of measurement units, and the codes make it possible to easily compare coefficients according to their scale These factors have low and high levels denoted by −1 and +1. The coefficients are simply converted into their natural units by the no-code form.
In terms of the coded factors, the final equation:

As regards no coded factors, the final equation:

The IC model probability and iteration numbers are shown in coded form as x1 and x2. The probability needed to be increased in order to maximize response F, as demonstrated by the rising b-value for x1 (0.0020). due to the negative x2 b-value (−0.0019), the number of iterations would be reduced in order to maximize the response. According to the higher b-value for that phrase, the probability had the largest impact on the target.
Calculate the path of the steepest ascent
The steepest ascent path, with the slope b2/b1, represents a track that runs from the center point of the RSM design space. The experiment needs to shift positively by 0.00020 units with each 0.0019 unit moving in a negative direction, resulting in an expected improvement of response for the linear model’s coded variables. The proportionality constant, ρ, is usually set to 1 for one of the variables, and commonly, it is the variable with the biggest b-value parameter. Since x1 has a larger parameter estimate in this scenario, the step sizes of other variables are determined in relation to x1, as demonstrated in equation (4).

If ρ = 1, then x2 (iteration) is altered by b2/b1 units for every unit of change in x1 (probability). In other words, if the step length of probability in coded units is 1, then the associated iteration step size in coded unit is Δx2= 1.03. In this case, however, it was warranted to have a smaller step size than 1 in order to derive the appropriate coordinate values along the path due to the probability’s linearity between 0 and 1.
For shorter step lengths the proportionality coefficient was lowered to 0.5, which is as follows:


It is appropriate to revert to no-code units for the calculation of the real value that will be used in the highest climb test. Since the step sizes applicable for both x1 and x2 have been known in the RSM study, it is possible to calculate the likelihood of using coating and detector reagent by way of this method:


These RSM experiments currently operate under the following operating conditions. “c” refers to the step size for diffusion probability from a central point. “d” indicates, at the central point of the current RSM experiment operation, the step size for iteration number.
In other words, during the steepest ascent, with the RSM experiment’s origin as the starting point, the probability should be raised by 0.05 for each step, and the iteration should be reduced by 26 as a result.
These calculations, as shown in Table 5, have been applied to design and run a number of experimental runs within the route for the steepest ascent.
A series of test runs has taken place on the steepest ascent. Be aware that for each step, the iteration is dropped by 26 and the diffusion probability is increased by from the starting point (Run 1).
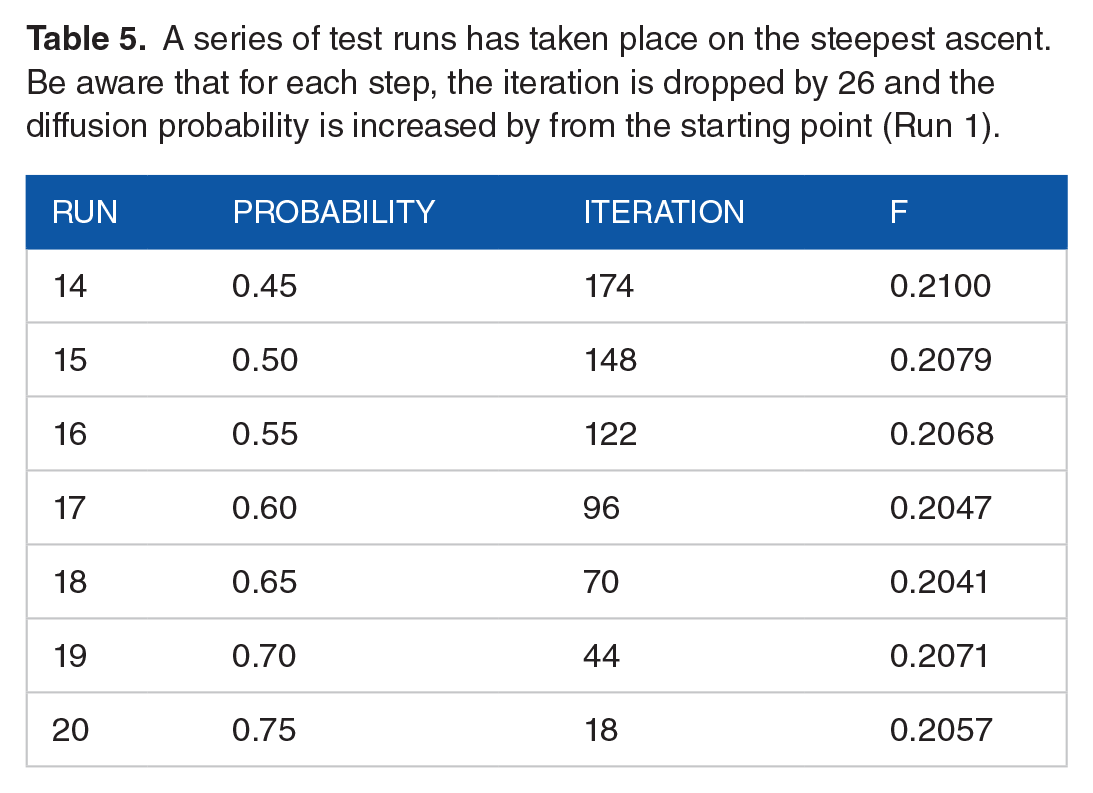
Figure 3 plots the F-measure for each step as well as a path leading to the steepest ascent. Despite the variation in the results, all subsequent steps resulted in a decrease in yield, with the maximum value being shown in the first step. Therefore, another first-order model should be used in the general vicinity of that point.

F-measure versus steps during the path of steepest ascent.
A new first-order model is fitted around the point (
Analysis of variance (ANOVA) for the fitted quadratic model.

Diagnostic plots have been obtained and are given in Figure 4, which was used to evaluate how well the model matched the actual response surface. A normal distribution was observed in the residual probability plot, indicating that an acceptable model had been established for use, and there was no pattern when plots of residual versus fitted values were drawn. The Shapiro-Wilk test also shows a P-value of .027073, which confirms that residuals are normal.

Diagnostic plots displaying (a) the residuals’ normal probability plot and (b) the relationship between the residual and the fitted value.
Figure 5a depicts a contour plot of the response, and Figure 5b display the response surface in 3 planes as a plane that occupies the area between the low and high levels of the 2 factors. As displayed in Figure 5a, we can achieve an F-measure greater than 0.22 around the point (x1 = 0.2, x2 = 0.6) in the coded value. Computing the global optimum for F-measure gives the value 0.222 in point (ζ1 = 0.47 ζ2 = 204

(a) Contour plot of the F response and (b) the response surface plane, in 3-dimensional rendition.
Colorectal cancer-driven gene detection
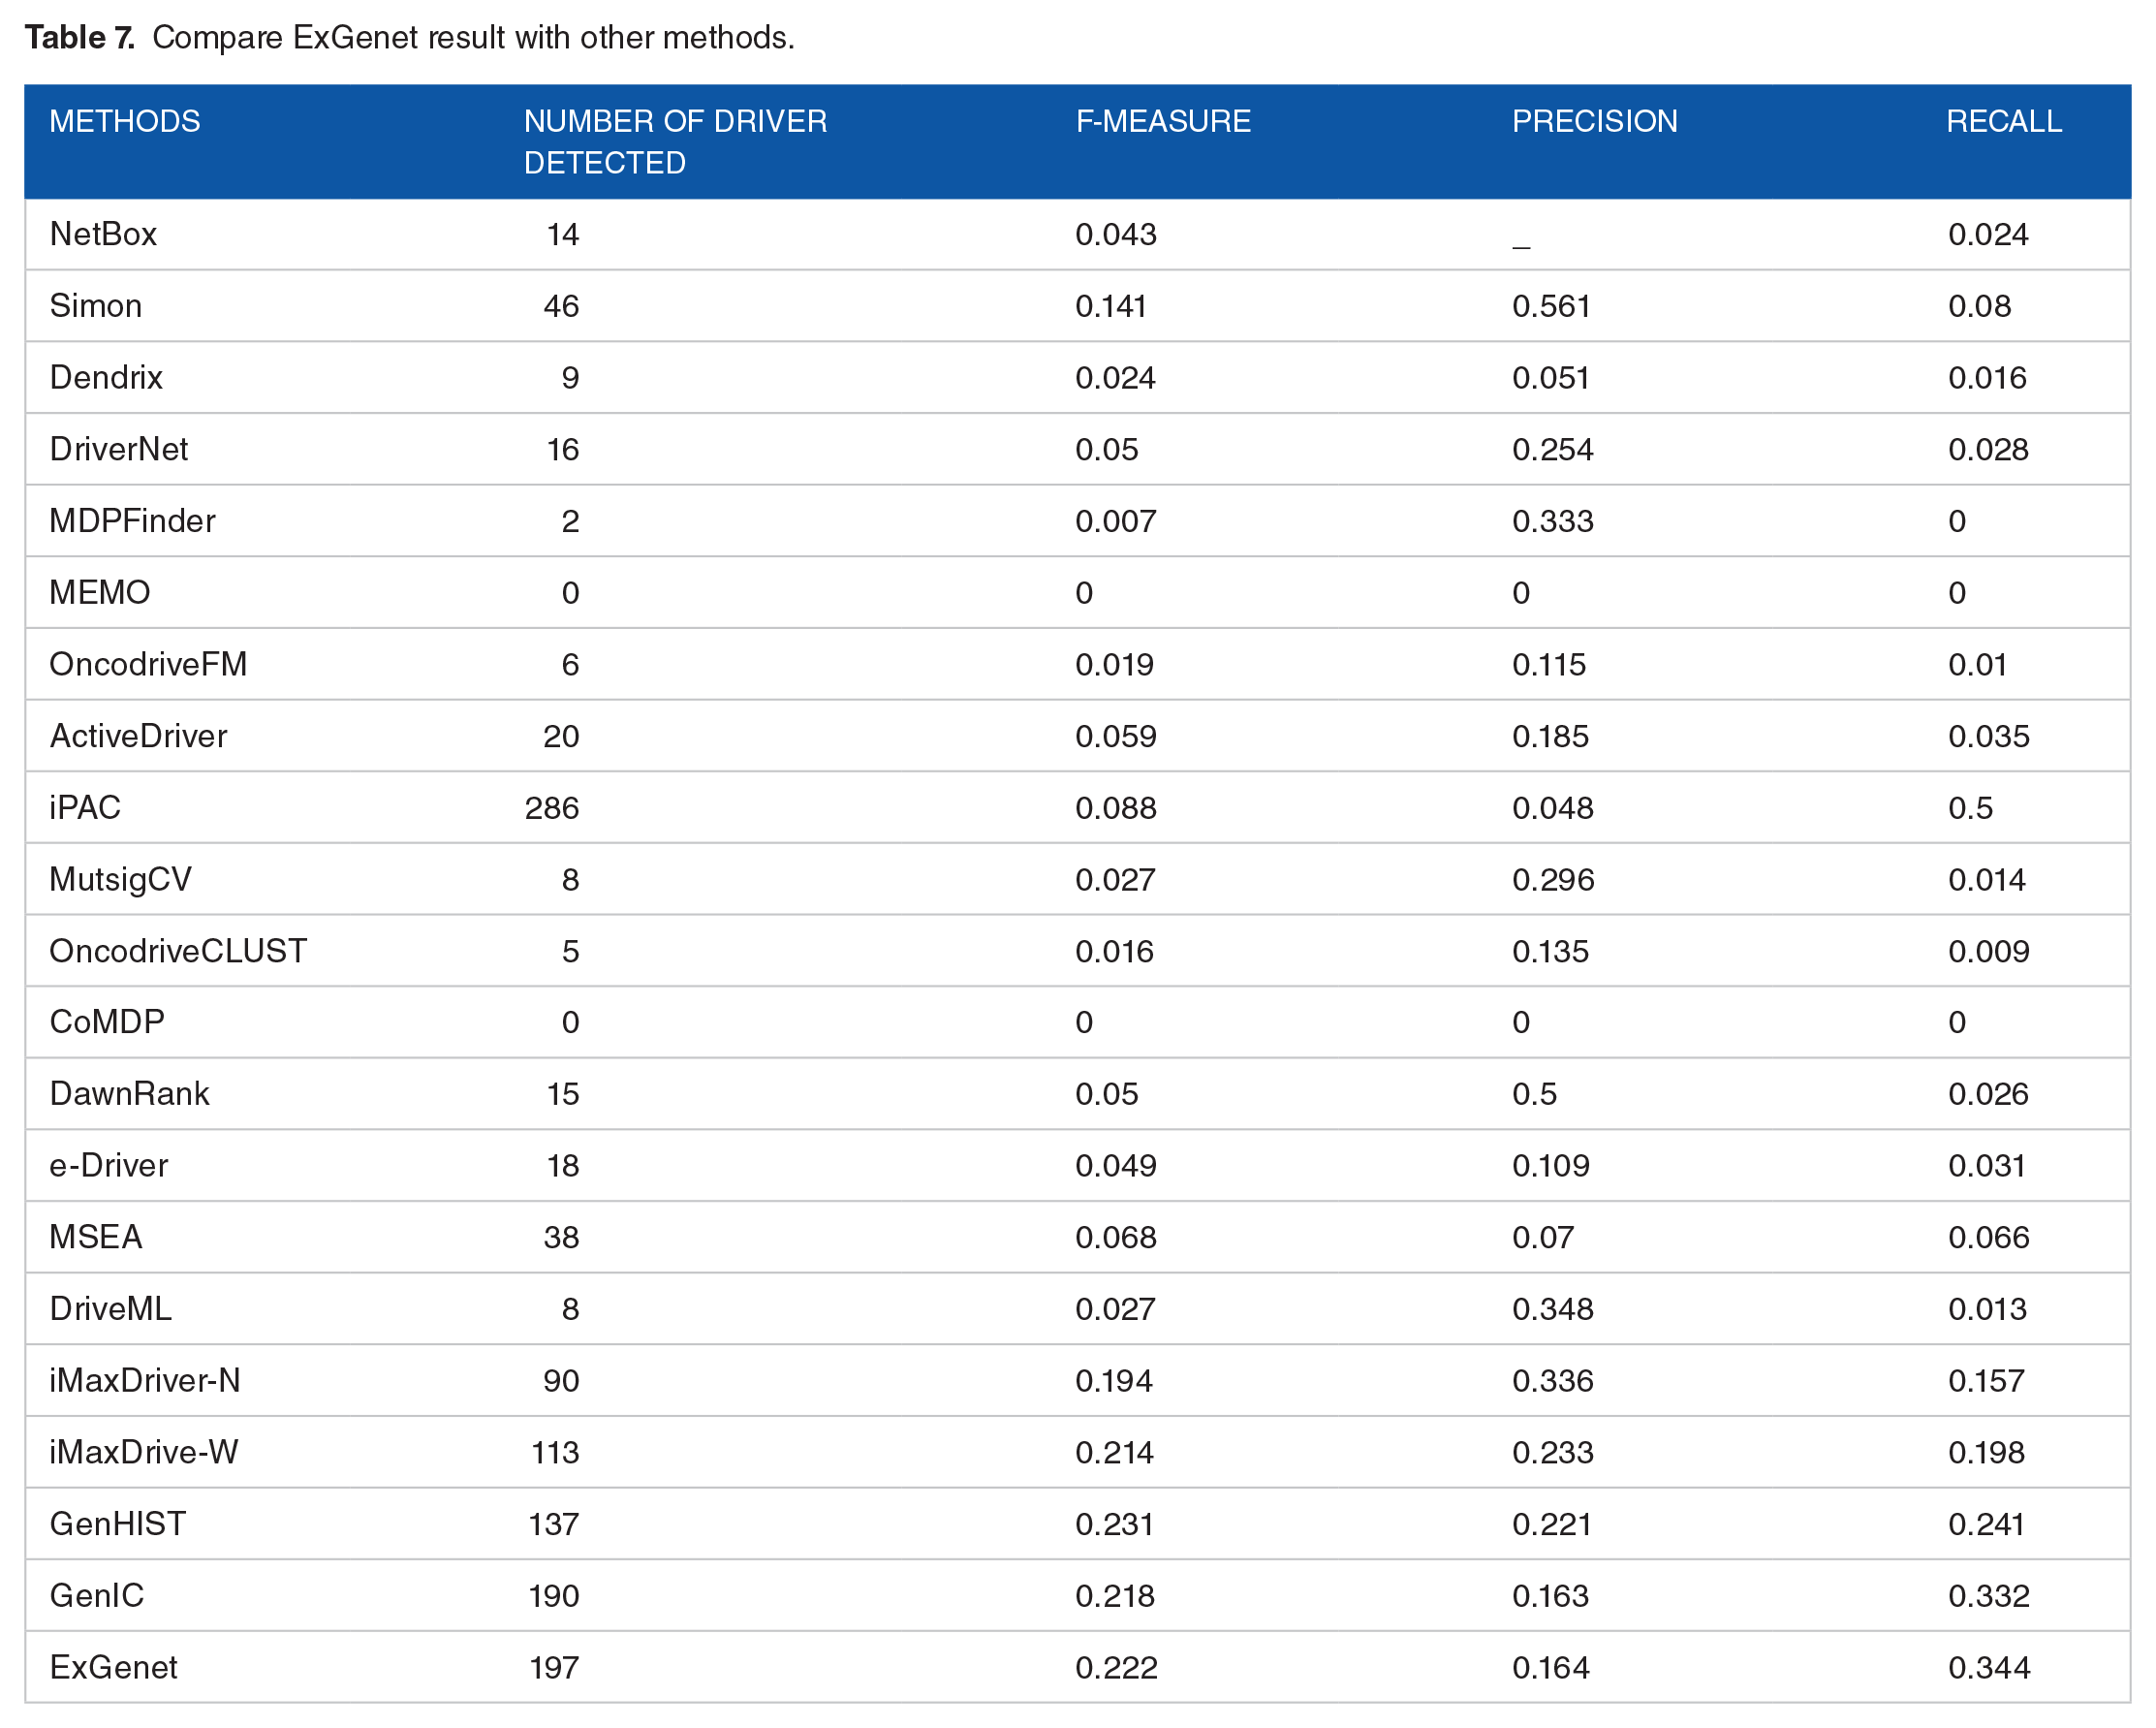
Using RSM for tuning IC model parameters has improved it. The colorectal cancer gene regulatory network is the method’s input, and the amount of coverage for each gene is the method’s output. The number of genes in the gene regulatory network that can be impacted and activated if a gene is active is determined by its coverage in the network. Accordingly, genes that have greater coverage have a higher chance of causing cancer. The study utilized TCGA-COAD, a free TCGA data portal, to identify colorectal cancer genes, with CGC-approved driver genes as the gold standard for evaluation. To evaluate the proposed method, we used common metrics for recall, precision and f-measure performance in binary classification problems. Table 7 display the results of ExGenet for comparison with GenIC and 19 other models, which has a better F-measure as it is maximized by the RSM method. Due to the maximized F-measure, the number of cancer driver genes that the model can detect has improved.
Compare ExGenet result with other methods.
Discussion
Our study employed response surface methods (RSM) to optimize proliferation probability in an independent cascade (IC) model aiming to enhance the detection of cancer driver genes in colorectal cancer through 2-factor RSM implementation plan. Changes in iteration levels were allowed at 3 different levels The results demonstrate that RSMs are both feasible and effective for improving model performance, as evidenced by the analysis of the F-measure as a response variable.
The fit of the linear model was assessed using analysis of variance (ANOVA), which revealed significant statistical results for probability and repeat factors This indicates that the linear model is fitting when the response variable (F-measure) dependent factors are controlled. The observed relationship between proliferation probability, recurrence, and F-measure provides valuable insight into the dynamics of information diffusion in genetic regulatory network.
The identification of a steep ascension path highlights the importance of varying the proliferation probability and repeat level to obtain optimal model performance Our study calculated the steepest ascension path in RSM testing to determine the optimal combination of proliferation probability and repeat for maximize the provided F-measure We evaluated the performance of our proposed ExGenet method for detecting colorectal cancer driver genes and compared it with other existing methods. The results demonstrate that ExGenet identifies a higher number of known driver genes and achieves a better F-measure, indicating its effectiveness in cancer gene discovery. Specifically, ExGenet outperformed the GeneIC method in terms of both the number of known driver genes detected and the F-measure. This validation highlights the importance of optimizing the propagation probability through RSM to improve the performance of the IC model.
The findings of our study hold important implications for cancer genomics research, particularly in the identification of genes causing cancer. Our approach of maximizing the F-measurement through RSM optimization offers a promising approach to improve the accuracy and reliability of cancer gene discovery. Furthermore, the mechanism demonstrated in this study may have broad applications in other cancer types and research areas, paving the way for further advances in cancer genomics Although our study focused on colorectal cancer, future research will investigate the generalizability of our approach to other cancer types and research areas. Additionally, further modifications and extensions of our optimization method may include considering additional factors or integrating multi-omics data for more detailed analysis.
Limitation
Although valuable insights into colorectal cancer are provided using The Cancer Genome Atlas (TCGA) gene database, there are limitations to potential biases with data collection and its validity, and of patient group representativeness.
Furthermore, although the independent cascade (IC) model is widely used to model diffusion processes, it may oversimplify the complex dynamics of information propagation in gene regulatory networks, leading to errors possible results of predicting diffusion probabilities.
Conclusions
In this study, we propose an experiment design to determine the optimal diffusion probability in the IC model. We have demonstrated that RSM experiments are a feasible and efficient method for quickly exploring an area, in addition to the established design space, by using the steepest ascent approach. This approach takes advantage of a mathematical model that allows the experimenter to map an objective response and improve it.
As we have seen, statistical models like RSM can be utilized to tune parameters and improving the model performance. Additionally, choosing seed nodes in the IC model is another challenge when applying this model. Therefore, employing statistical models to select them could be a subject for further future research.
Footnotes
Acknowledgements
None.
Author Contribution(s)
The contributions of each author to this manuscript are as follows: Mahboube Ayoubi conducted the main aspects of the research, including the conceptualization, methodology, and software (running the code). Additionally, she took the lead in writing the original draft of the manuscript. Babak Teimourpour, as the first supervisor, played a critical role in the conceptualization of the work, provided overall supervision, and contributed to the writing process by critically reviewing and editing the manuscript. Alireza Hassanzadeh, as the second supervisor, contributed to the supervision of the project and provided valuable input through the review and editing of the manuscript.
Declaration of conflicting interests:
The author(s) declared no potential conflicts of interest with respect to the research, authorship, and/or publication of this article.
Funding:
The author(s) received no financial support for the research, authorship, and/or publication of this article.
Availability of Data and Materials
The datasets analyzed in this study were obtained from The Cancer Genome Atlas (TCGA), a publicly accessible repository for cancer genomics data. Access to TCGA data can be obtained through the official TCGA website (https://www.cancer.gov/tcga) or through the Genomic Data Commons (GDC) Data Portal (![]() /).
/).
Ethics Approval and Consent to Participate
The research presented in this manuscript did not involve human or animal subjects. All data utilized in this study were obtained from publicly available and free-access sources. As such, ethical approval was not required for this research.
Consent for Publication
Given that this study did not involve human or animal subjects and relied on data obtained from free-access websites, informed consent for publication was not applicable in this context. The data utilized in this study were publicly accessible and used in accordance with the terms and conditions of the respective sources.