
Abstract
DNA copy number variations (CNVs) have been shown to be associated with cancer development and progression. The detection of these CNVs has the potential to impact the basic knowledge and treatment of many types of cancers, and can play a role in the discovery and development of molecular-based personalized cancer therapies. One of the most common types of high-resolution chromosomal microarrays is array-based comparative genomic hybridization (aCGH) methods that assay DNA CNVs across the whole genomic landscape in a single experiment. In this article we propose methods to use aCGH profiles to predict disease states. We employ a Bayesian classification model and treat disease states as outcome, and aCGH profiles as covariates in order to identify significant regions of the genome associated with disease subclasses. We propose a principled two-stage method where we first make inferences on the underlying copy number states associated with the aCGH emissions based on hidden Markov model (HMM) formulations to account for serial dependencies in neighboring probes. Subsequently, we infer associations with disease outcomes, conditional on the copy number states, using Bayesian linear variable selection procedures. The selected probes and their effects are parameters that are useful for predicting the disease categories of any additional individuals on the basis of their aCGH profiles. Using simulated datasets, we investigate the method's accuracy in detecting disease category. Our methodology is motivated by and applied to a breast cancer dataset consisting of aCGH profiles assayed on patients from multiple disease subtypes.
Introduction
DNA copy number variations (CNVs) have been shown to be associated with cancer development and progression. 1 Somatic CNVs can lead to tumorigenesis. For example, loss of copy numbers for tumor suppressor genes or amplification for oncogenes both lead to cancer. The detection of these CNVs has the potential to impact the basic knowledge and treatment of many types of cancers, and can play a role in the discovery and development of molecular-based personalized cancer therapies. 2
In early years, cytogeneticists have been limited to traditionally visually examining whole genomes with a microscope, a technique known as karyotyping or chromosome analysis. In the mid-70 s and 80s, the development and application of molecular diagnostic methods such as Southern blots, polymerase chain reaction (PCR), and fluorescence in situ hybridization (FISH) allowed clinical researchers to make many important advances in genetics, including clinical cytogenetics. However, these techniques have several limitations. First, they are very time consuming and labor intensive, and only a limited number and regions of the chromosome can be tested simultaneously. Further, because the probes are targeted to specific chromosome regions, the analysis requires prior knowledge of an abnormality and is of limited use for screening complex karyotypes. More recently, scientists have developed techniques that integrate aspects of both traditional and molecular cytogenetic techniques called
One of the most common types of high-resolution chromosomal microarrays are array-based comparative genomic hybridization (aCGH) methods that assay DNA CNVs across the whole genomic landscape in a single experiment. 4 With aCGH, differentially labeled test and reference samples’ genomic DNAs are cohybridized to normal chromosomes, and fluorescence intensities/ratios along the length of chromosomes provide a cytogenetic representation of the relative DNA CNV across the whole genome. Whereas early aCGH arrays were mainly used in research settings, recent improvements in algorithms for aCGH data analysis as well as rapidly reducing costs now enable clinical applications of aCGH arrays, particularly in the study of cancer genomic as a diagnostic tool. 2
In this article, we propose methods to use aCGH profiles to predict disease states. We employ a Bayesian classification model, and treat disease states as outcome and aCGH profiles as covariates – to identify significant regions of the genome associated with disease subclasses. Statistical challenges for aCGH classification include not only high dimensionality ie, large number (tens of thousands) of probes but also relatively small number of samples, more importantly, the presence of serial correlation among the features – nearby probes (by genomic location) tend to be highly correlated. Classical methods usually used for multivariate classification of high-dimensional genomic data, eg, penalized approaches (Zhu and Hastie 5 and the references there-in), do not account for the specific structure of aCGH data, as they ignore the serial dependence in the probes. To exploit the serial genomic information, typical approaches first segment the data 6 and then conduct downstream classification. Alternative methods are based on kernel-based techniques such as support vector machine (SVM), 7 and its variants exploit genomic continuity. 8 While incorporating excellent prediction capabilities, these methods do not explicitly utilize the inherent discrete nature of the latent copy number states (gain/loss/normal) in their variable selection procedures, which serves as one of the primary aims in this article.
In the Bayesian framework, several innovative variable selection strategies have been developed in various contexts, with reasonable degrees of success. Some of these approaches can be regarded as
In this article we propose a principled two-stage method for disease classification using covariates exhibiting serial dependence. In general, the technique is applicable to datasets having the following structure. For individuals
The remainder of the paper is organized as follows. Section 2 provides details of the model for the two-stage analysis. Section 3 develops the posterior inference and prediction technique based on Markov chain Monte Carlo (MCMC) methods. In Section 4, using simulated datasets, we investigate the method's accuracy in detecting disease category. Finally, Section 5 analyzes the motivating breast cancer dataset and makes test case predictions.
Model
Our modeling framework consists of two stages: In Stage 1, we model the aCGH emissions, relying on HMMs to account for the serial correlations among the emissions. Then, in Stage 2, the relationship between the HMM parameters and the subject-specific binary responses is specified using a probit regression model and the latent indicator variables using the approaches proposed by George and McCulloch, 13 Kuo and Mallick, 17 and Brown et al. 18 We expound on each of these below.
Stage 1: Relationship between aCGH Emissions and Latent Copy Number States
For subjects
Similarly to Guha et al.
23
conditional on 
where, because of the specific biological interpretations associated with the HMM states, we assume that μ-1 < μ0 < μ+1. This assumption also prevents label switching, a well-known problem with mixture models, thereby making inferences even more efficient. The latent states
Stage 2: Relationship between Disease Classification and Latent Copy Number States
In the second stage of the analysis, we model the relationship between the disease category and latent copy number states of the genomic probes for each individual. These values are copy number states inferred from analysis in Section 2.1.
Let 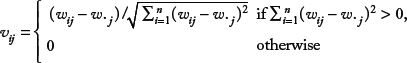
Let
A key assumption of our model is that probes that do not belong to
For individuals

For the intercept β0, we assume the prior 
where δ0 denotes the point mass at 0. In other words, each probe is predictive of disease classification with probability ω. We assume independent exponential priors with mean 1 for
Gibbs Sampling Procedure
Let
Although the Gibbs sampler is conceptually straightforward, updating of γ can be computationally intensive for large 
Applying Theorem 7.1, we have
Outline of procedure
Let Applying Theorem 7.1, the binary indicators for probes where Writing Let β
where τ-2|β-0 is distributed as gamma ω | γ is distributed as beta (ρ,


Test case predictions
Suppose we have the aCGH profiles of 
A consistent (in simulation size) estimate of this probability is then

where β = β(
Simulation Study
We generated a training sample consisting of
Disease 0 was assumed to be characterized by losses (
As described in Section 2, the variables were then transformed to obtain the covariates
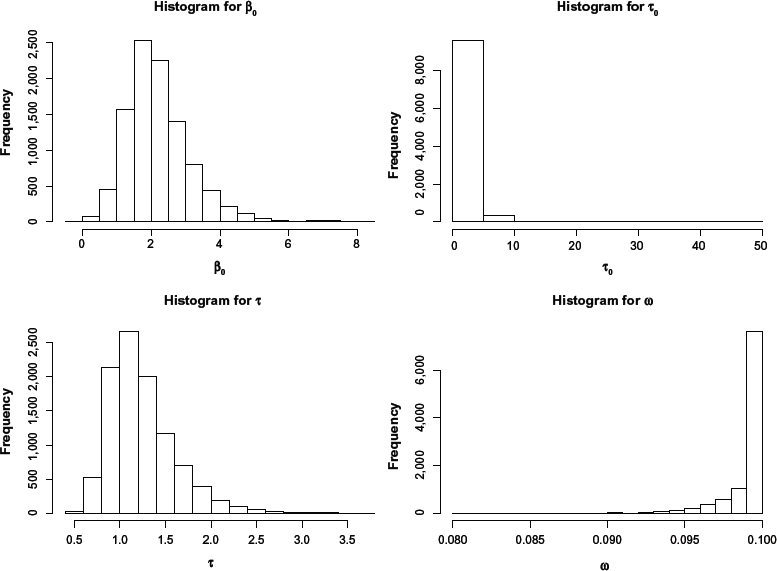
Histogram of selected model parameters for the simulation study.
We evaluated the success of the predictive ability of our approach by drawing 50 independent test samples of
For each dataset, using the stored MCMC sample of size
For the 200 individuals belonging to the 50 test samples of the simulation study, the estimated disease category versus the true category averaged over the 50 test samples. Perfect classification was obtained for each dataset. As a result, the standard errors shown in parenthesis are all zero.

Breast Cancer Data Analysis
We analyzed the breast cancer dataset from Andre et al.
24
which consists of
As described in Section 2.1, we used this information to first infer the latent copy number states
To investigate the reliability of the proposed method of these actual datasets, we performed 50 independent replications of the following steps. (i) We randomly split the data into training and test sets in a 4:1 ratio. (ii) We analyzed the disease subcategories and the
The significant probes (covariates) that were found to be predictive of disease subtype are plotted in Figures 2–4. We assumed a posterior probability threshold of δ = 0.15 that yielded 500 markers along the entire genome predictive of the disease classification. Figure 2 plots a bar graph of the chromosomal breakdown of these markers. As can be seen, most of the significant markers are located on chromosomes 5, 12, 16, and 17. The corresponding karyograms Figures 3 and 4 show the breakdown on the markers by chromosomal locations for negative (red) and positive (green) associations with the disease states, respectively.

Number of significant markers broken down for each chromosome.
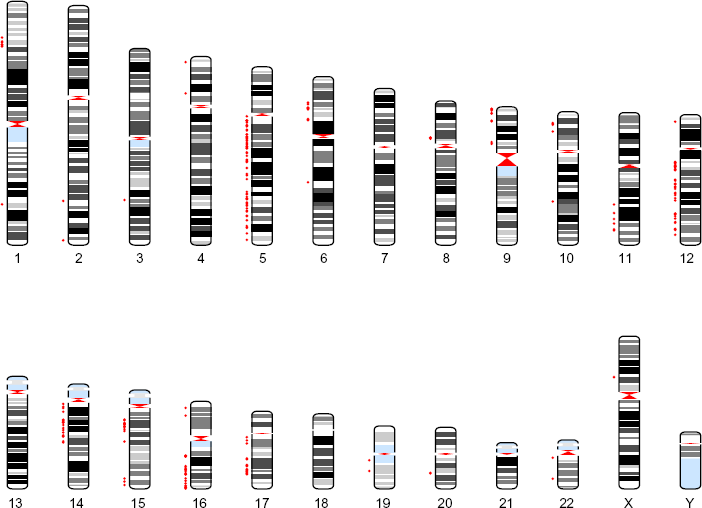
Human karyogram with significant locations. This figure is a karyogram that depicts the significant probes identified using our approach. The red color corresponds to negative regression coefficients.
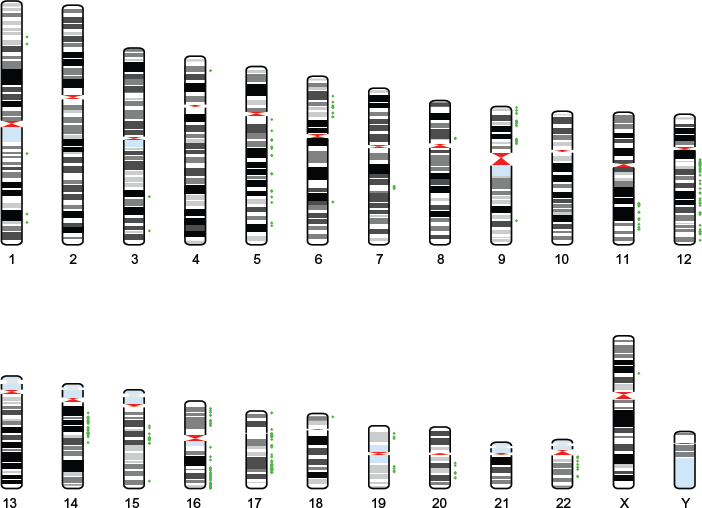
Human karyogram with significant locations. This figure is a karyogram that depicts the significant probes identified using our approach. The green color corresponds to positive regression coefficients.
Our results are promising based on the locations of selected markers. As noted, most markers are on chromosomes 5, 12, 16, and 17. It has been shown that chromosome 5q deletions are the most frequent aberration in breast tumors from
Conclusions and Discussion
The detection of CNVs in aCGH methods is important for the treatment of many types of cancers, especially in the development of molecular-based personalized cancer therapies. We propose a framework for the prediction of disease types using aCGH profiles. We employ a Bayesian classification model and treat disease states as outcome and aCGH profiles as covariates in order to identify significant regions of the genome associated with disease subclasses. Specifically, we propose a principled two-stage method using the covariates exhibiting serial dependence. Stage 1 makes inferences on the underlying copy number states associated with the aCGH emissions based on HMM formulation. Using Bayesian linear variable selection procedures, Stage 2 detects the model parameters associated with the binary responses, conditional on the parameters of Stage 1.
The selected probes and their effects are parameters that are useful for predicting the disease categories of any additional individuals on the basis of their copy number profiles. A simulation study demonstrates the method's remarkable accuracy in detecting disease category. The methodology is applied to a breast cancer dataset, and we find several markers that are associated with disease subtype using the copy number profiles. Some of these discoveries confirm existing literature, and novel associations could be potential targets for future validation studies.
Our methods are general and could be potentially applied to SNP arrays as well that yield copy number profiles. A nice generalization of the method would be to incorporate genotype information (eg, allelic frequencies) in the models (especially, Stage 1) that could lead to more refined estimation of the latent copy number states. Furthermore, current technologies enable collection of multiplatform data on matched patient samples such as mRNA expression (eg, The Cancer Genome Atlas (TCGA)) that can be leveraged to provide a more detailed understanding of the biological mechanisms involved in cancer development and progression. We leave these tasks for future consideration.
Author Contributions
Conceived and designed the experiments: SG, YJ, VB. Analyzed the data: SG, VB. Wrote the first draft of the manuscript: SG, YJ, VB. Contributed to the writing of the manuscript: SG, YJ, VB. Agree with manuscript results and conclusions: SG, YJ, VB. Jointly developed the structure and arguments for the paper: SG, YJ, VB. Made critical revisions and approved final version: SG, YJ, VB. All authors reviewed and approved of the final manuscript.
Footnotes
Appendix
Theorem 7.1: Let
Since
Matrix
Given
We obtain the result on substituting (4) and (5) in the