
Abstract
The 18,352 pancreatic ductal adenocarcinoma (PDAC) cases from the Surveillance Epidemiology and End Results (SEER) database were analyzed using the Kaplan-Meier method for the following variables: race, gender, marital status, year of diagnosis, age at diagnosis, pancreatic subsite, T-stage, N-stage, M-stage, tumor size, tumor grade, performed surgery, and radiation therapy. Because the T-stage variable did not satisfy the proportional hazards assumption, the cases were divided into cases with T1- and T2-stages (localized tumor) and cases with T3- and T4-stages (extended tumor). For estimating survival and conditional survival probabilities in each group, a multivariate Cox regression model adjusted for the remaining covariates was developed. Testing the reproducibility of model parameters and generalizability of these models showed that the models are well calibrated and have concordance indexes equal to 0.702 and 0.712, respectively. Based on these models, a prognostic estimator of survival for patients diagnosed with PDAC was developed and implemented as a computerized web-based tool.
Introduction
Pancreatic cancer is a devastatingly lethal disease, with the highest mortality and the lowest one, three, and five-year relative survival rates of all cancers in the United States.1,2 Although pancreatic cancer accounts for a relatively small number of new diagnoses at approximately 44,000 per year, with over 37,000 deaths per year, 1 pancreatic cancer ranks only behind breast, colon, and lung cancer in total US cancer mortality. 3
Pancreatic cancer is a heterogeneous disease classified by cancer subtypes according to their cell type of origin, structure, and behavior. The majority of pancreatic cancer cases are pancreatic ductal adenocarcinom (PDAC), 2 which has the most aggressive tumor biology and metastatic potential among pancreatic cancer histopathologic subtypes.4,5
The median survival time after PDAC diagnosis is about four months. 6 Only about 19% of patients with this disease survive past one year and only about 2% survive past five years. 2 However, the survival of patients diagnosed with PDAC may vary significantly depending on many factors, including demographic characteristics and the pathologic nature of the tumor, as well as the type of performed treatment. To estimate the relative impact of the distinct risk factors on the survival of patients diagnosed with PDAC, Cox proportional regression models have been used.6–8 It was shown that the following demographic factors have a significant impact on the survival of PDAC: gender, race, age at diagnosis, 6 marital status, 8 and the time period of the PDAC diagnosis. 6 In addition, the following clinical factors have a significant influence on the survival of PDAC: tumor size, nodal status, and distant metastases. 7
The most dramatic influence on the survival of patients diagnosed with PDAC is a surgical resection of the tumor (with our without adjuvant chemotherapy and radiation). 9 Unfortunately, less than 20% of patients diagnosed with PDAC are suitable for surgical resection. 7 For the remaining patients, the extent of disease precludes the use of surgical procedures. The combination of surgery with radiation and chemotherapy has been shown by some to improve survival compared to surgery alone. 9
The estimated parameters (values of the relative impact of risk factors on the survival of cancer patients) obtained by the Cox proportional regression models are largely varied, depending on the quantity and quality of data used, the set of the considered variables, and the technical approaches utilized in developing these models. The obtained estimates depend on the underlying Cox models, the credibility of which can be estimated by values of their concordance indexes (c-indexes), which present the probability that for any pair of randomly drawn patients, the patient with the worst outcome estimated by this model dies earlier than one with the better estimated outcome. A c-index value equal to 0.5 indicates that the predictive power of the model is not better than random chance, while a level of 1.0 of this index signifies perfect discrimination.
The Cox proportional hazards regression models for estimation of survival for patients diagnosed with PDAC were used for the development of two nomograms.10,11 One nomogram estimates the survival for patients who have undergone pancreatectomy of the malignancy and accounts for the following variables (covariates): tumor size, grade, stage, lymph node data, resected tissue amount, weight loss, and pancreatic subsite. 10 This nomogram was constructed using data from highly selected patients treated at a single, specialized center. The other nomogram predicts the risk of perioperative mortality in PDAC patients scheduled to undergo pancreatectomy and accounts for patient demographics (age, gender, race), type of pancreatectomy (distal, radical, and other), hospital characteristics (size, type), as well as the presence of co-morbidities in PC patients (renal failure, neurological disorders, hypothyroid, chronic heart failure (CHF), liver disease, uncomplicated hypertension, cardiac arrhythmia, diabetes, and chronic obstructive pulmonary disease). 11 The utility of these nomograms to patients diagnosed with PDAC, however, is limited to the relatively small fraction of patients with resectable PDAC (less than 20%).12,13
Recently, two new Cox regression models were developed to estimate the survival for patients with resectable and unresectable PDAC. 9 These models use the following variables: age, gender, race, tumor stage, tumor site, tumor grade, and radiotherapy. Based on these models, an interactive, online clinical calculator was developed to estimate survival probability for patients diagnosed with PDAC, based on an individual's unique clinicopathological profile. The calculator is also capable of estimating conditional survival probabilities (defined as the future survival probability or duration that is calculated after a given period of survival that increases over time elapsing since the diagnosis of PDAC). 14 Because this calculator can estimate personalized survival probability, which can influence personal decision making, disease-related anxiety, and quality of life of cancer patients, it has been proposed for clinical use. 9 However, this calculator does not provide the standard errors of the survival estimates and its reliability and generalizability were not checked (or at least not disclosed in that work) with the use of c-indexes. The reliability and generalizability of a model are essential when a model's predictions are considered for clinical practice. 15
In the present work, we used SEER data on 18,352 pathologically confirmed cases of PDAC, diagnosed during 2004–2009, 16 and developed Cox proportional hazards regression models adjusted by the following covariates: race, gender, marital status, time period, age at diagnosis, tumor site, tumor size, T-stage, M-stage, N-stage, tumor grade, type of surgery, and radiotherapy. Based on these models, we developed a web-based, real-time prognostic tool for estimating survival and conditional survival probabilities (as well as their corresponding standard errors) for patients with PDAC. The reliability and generalizability of the developed models were proven by their calibration and discrimination abilities, validated by the use of both “internal” and “external” datasets.
Materials and Methods
In this work, we used cancer data from the Surveillance Epidemiology and End Results (SEER) database from 18 geographical areas (San Francisco-Oakland, Connecticut, Detroit, Hawaii, Iowa, New Mexico, Seattle, Utah, Atlanta, San Jose, Los Angeles, Alaska Natives, Rural Georgia, Greater California, Kentucky, Louisiana, New Jersey, and Greater Georgia). 16 These data were published by SEER in April 2012 and contain cases diagnosed up to 2009. From this release, we extracted survival data for pancreatic cancer patients diagnosed with adenocarcinoma (International Classification of Diseases for Oncology, 3rd Edition histology codes 8140-8149).
We initially queried 33,252 cases of PDAC diagnosed between 2004 and 2009. From this subset we excluded: 5,583 cases that did not have pancreatic cancer as the primary cancer for the patient, 999 cases that were not pathologically confirmed; one case diagnosed at an age younger than 20 years (ages 0–19 are customarily used to classify childhood cancers); 2,032 cases of races that were not black or white (cases for Asian/Pacific Islanders, Native Americans, and individuals of unknown race were not available in sufficient quantities); 906 cases with unknown marital status; 271 cases with unknown radiation therapy status; 259 cases with unknown surgery status or having non-therapeutic procedures; 176 cases marked T0 or Tis stage; and 4,673 cases with unknown tumor extension. This left 18,352 cases prior to stratification into subgroups for T1/T2 stage and T3/T4 stage.
Data on the remaining 18,352 PDAC cases were described by 13 categorical variables (five demographic covariates, six clinical covariates, and two medical treatment covariates). As demographic categorical covariates (the corresponding categories are presented in brackets), we used: (i) race (white, black), (ii) gender (male, female), (iii) age at diagnosis (quartile groups: 20–59, 60–69, 70–77, 78+ years), (iv) year (time period) of diagnosis (January 1, 2007 through December 31, 2009; and January 1, 2004 through December 31, 2006), and (v) marital status (married, single). As the clinical covariates, we used: (i) tumor site, i.e., pancreatic subsite (head, body, tail, other, unknown), (ii) tumor size (separated by the median size into 0.0–4.0 and >4 cm groups), (iii) AJCC 6th Edition T-stage (T1, T2, T3 and T4), (iv) AJCC 6th Edition N-stage (N0, N1, and NX), (v) AJCC 6th Edition M-stage (M0, M1, and MX), and (vi) tumor grade (low, high, and unknown). Finally, as medical treatment covariates we used: (i) pancreatic resection (pancreatoduodectomy/total pancreatectomy, partial pancreatectomy/pancreatic excision, and no surgery), and (ii) radiation therapy (yes or no therapy). It should be noted that comprehensive chemotherapy data are not available in the SEER database, and therefore the effects of chemotherapy could not be studied in this work.
The prognostic effects of these variables were studied in univariate models with the Kaplan-Meier method and in multivariate Cox proportional hazards models, in which the survival function, S, for the failure time, t, associated with a P × 1 column covariate vector, Z, takes the form:

where S0(t) is the baseline hazard function and β is a P × 1 column vector of the regression coefficients (the β′ is the transpose of the β). The proportional hazard assumptions were assessed by visual inspection of log-log plots. 17 All tests were two-sided with a significance level set at P < 0.05.
SAS version 9.2 (SAS Institute Inc., Cary, NC) was utilized to estimate the regression coefficients, β, of the multivariate Cox models. The estimates,
Outputs of the SAS PHREG procedure were used to calculate estimates of the survival probability,

where

Estimates of the standard errors of the estimates of the prognostic index,

Estimates of the standard errors of the estimates of the survival,

In (3),
By definition, the conditional survival, S(t2 | t1), represents the probability that a patient with cancer will survive an additional t2 months, given that the patient has already survived a given t1 months. In this case, the estimate of the conditional survival,

where

where
The accuracy of the Cox models developed in this work were assessed by the c-indexes (to estimate the discrimination power) and calibration plots (to estimate an agreement between observed outcomes and predictions). 20 The reproducibility and transportability of these models were also checked, as we describe below. The reproducibility is defined as the performance of a model on a sample of similar patients not included in the development of the model, while transportability reflects a model's ability to predict among patients from different but “plausibly related” populations. 21
To estimate the reproducibility of the parameters of the developed models, cross-validation with 10 iterations was done. For this purpose, the systematic sample splits were performed in such a way that all patients have served once in the model evaluation dataset. It was done by exclusion in each iteration of about 10% of all cases. The end digit in the unique patient ID number, by which each case is coded in the SEER database, was used as an exclusion criterion. Thus, the systematic sample split was done by varying the exclusion criterion, starting from the digit 0 and sequentially changing it to digits 1, 2, …, and 9. For each iteration, cases not satisfying the considered exclusion criterion were used as the model training dataset, while the excluded cases were used as a testing (validation) dataset. The discrimination power (c-indexes) of the models, obtained with the use of the training dataset, was checked using the testing dataset.
The generalizability or transportability of the models (i.e., goodness of using the same variables and same coefficients) was checked by utilizing the models for predicting the survival of the cancer patients living in different geographical areas. For this purpose, the c-indexes of the models, developed by using the cases from distinct geographic areas as training datasets, were validated on testing (“external”) datasets exclusively containing cases from the geographical areas that were not included in the training datasets.
Results
Estimates of observed survival, stratified by each variable, were obtained using the Kaplan-Meier method. For each variable, the proportional hazards assumption was assessed graphically (data not shown) by log-log plots. 17 We determined that for the following 12 categorical variables the log-log plots are nearly parallel: race, gender, marital status, time period, age at diagnosis, tumor site, tumor size, T-stage, M-stage, N-stage, tumor grade, type of surgery, and radiation therapy. For the T-stage variable, however, the corresponding curves on the log-log plots were not parallel (and, as a result, the AJCC 6th Edition stage group also demonstrates non-proportional hazards). In fact, Figure 1 shows that the curves related to the T1- and T2-stages (tumor extension localized to the pancreas) are not parallel to the curves related to the T3- and T4-stages (tumor extension not localized).

Assessment of the proportional hazards assumption for T-stage.
Data on 18,352 PDAC cases were stratified in two groups by degree of PDAC localization. The first group (which we called localized PDAC, LPDAC) contained 5,422 cases, in which the tumor is localized within the pancreas (T1- and T2-stages). The second group (called extended PDAC, EPDAC) contained 12,930 cases, in which the tumor is extended beyond the pancreas (T3-stage) or is locally advanced and involves the celiac axis or the superior mesenteric artery (T4-stage). After separation of all PDAC cases into these two groups, the proportional hazard assumptions for all categorical variables describing the cases in each of these groups were satisfied. This allowed us to perform the multivariate Cox regression analysis for the LPDAC and EPDAC groups separately.
In the multivariate Cox regression analysis of 5,422 cases for the LPDAC group, we initially did not use the T-stage variable, which is not needed for this group of cases. This is because the LPDAC group contained only cases with T1- and T2-stages that are different from one another only by the tumor size (cases with tumor size equal or less than 2 cm are T1-stage, and cases with tumor size larger than 2 cm are T2-stage), 22 but to categorize tumor size, the tumor size variable can be used. When performing the Cox analysis, we found that the variable tumor subsite (head, body, tail, and other) does not have a significant influence on the survival of the LPDAC patients, and thus we did not use this variable for the development of the final LPDAC Cox model.
In multivariate Cox regression analysis of 12,930 cases for the EPDAC group, we initially utilized all the variables described in Materials and Methods. However, the Cox modeling of the EPDAC cases showed that the variable tumor subsite (head, body, tail, and other) did not have a significant influence on the survival of the EPDAC patients. Analogously, the variable T-stage, which for the EPDAC cases varies by degree of tumor extension, also did not have a significant influence on the survival of the EPDAC patients. Therefore, we did not use the variables tumor subsite and T-stage for the development of the final EPDAC Cox model.
Tables 1 and 2 present the final results of multivariate Cox regression analysis for the LPDAC and EPDAC cases, correspondingly. As can be seen from these tables, the vast majority of the considered covariates have significant influence on the survival of patients diagnosed with PDAC. There is also a good qualitative agreement in the estimated contributions of similar covariates on the survival of patients diagnosed with the localized and extended PDAC. In both cases, the performed treatments (surgery and/or radiation therapy) were the most beneficial for survival.
Cox proportional hazards regression model for LPDAC (localized pancreatic ductal adenocarcinoma) survival.

Cox proportional hazards regression model for EPDAC (extended pancreatic ductal adenocarcinoma) survival.

Among the clinical characteristics of a tumor, the largest risk factors accelerating death from PDAC include the presence of metastasis (M1), poor tumor differentiation (high grade), and large (>4 cm) tumor size. The involvement of lymph nodes (N1) makes a small (likely due to the simultaneous effect of other, larger contributors, such as M1-stage), but significant contribution to survival for patients diagnosed with LPDAC, but not with EPDAC.
Within the demographic characteristics of patients, age at diagnosis is the most influential risk factor on survival. Gender, race, and marital status make modest and comparable contributions to the survival of patients diagnosed with LPDAC and EPDAC.
The accuracy of the Cox models developed for the LPDAC and EPDAC cases were assessed by the c-indexes and calibration plots. 20 The obtained c-indexes of these models were equal to 0.702 and 0.712, respectively. The calibration plots presented in Figures 2 and 3 show how close the survival estimates are to the observed values, predicted by these models at the time point (chosen to be equal to 12 months). As can be seen from these figures, the Cox models developed for the LPDAC and EPDAC cases are well calibrated.

Calibration plot for the LPDAC (localized pancreatic ductal adenocarcinoma) survival model.

Calibration plot for the EPDAC (extended pancreatic ductal adenocarcinoma) survival model.
The reproducibility of the Cox models developed for the LPDAC and EPDAC cases were analysed by cross-validation with 10 repeats (Table 3).
Cross-validation of the LPDAC and EPDAC Cox proportional hazards regression models.

As can be seen from Table 3, the cross-validated c-indexes of the LPDAC and EPDAC models vary within the small intervals, (0.687–0.720) and (0.696–0.732), correspondingly. The averaged values of the cross-validated c-indexes were 0.700 and 0.711, respectively, which are very close to the c-indexes (0.702 and 0.712) initially obtained for LPDAC and the EPDAC models. This suggests high reproducibility of the Cox models for the LPDAC and EPDAC cases presented in Table 1 and Table 2.
The generalizability (transportability) of the LPDAC and EPDAC models to the PDAC patients living in different geographical areas were also checked. Specifically, the cases from one of 18 geographic areas were considered as “external” datasets and used for validation of the LPDAC and EPDAC Cox models trained by cases collected in other 17 geographic areas. Table 4 presents the results of these evaluations. Note that this table shows data for the geographical areas having more than 100 cases of white and black patients, which could be used as external datasets. Because the Utah, Hawaii, Alaska, and Rural Georgia SEER registries had less than 100 cases to be used for external testing of the LPDAC models, we did not perform validation for these areas.
Validation of the transportability of the LPDAC and EPDAC Cox proportional hazards regression models to different geographical areas.

As can be seen from Table 4, the c-indexes of the LPDAC and EPDAC Cox models for individual geographical areas vary within the intervals, (0.651–0.739) and (0.699–0.739), respectively. The averaged values of these indexes for the LPDAC and EPDAC models were 0.700 and 0.714, respectively. These numbers are very close to the c-indexes (0.702 and 0.712) initially obtained for the LPDAC and the EPDAC Cox models. This suggests that the LPDAC and EPDAC models, the parameters of which are presented in Tables 1 and 2, are sufficiently generalized to be transportable for applications to different geographical areas of the US.
Overall, the data presented in Tables 3 and 4 confirm high reproducibility and generalizability of the LPDAC and EPDAC Cox models developed with the use of 18,352 pathologically confirmed cases of PDAC diagnosed between 2004 and 2009. This allowed us to use the parameters of these models, which are presented in Tables 1 and 2, to develop a real-time prognostic estimator of survival for patients diagnosed with PDAC.
This tool allows one to estimate the conditional survival
The estimator is a real-time, web-based computerized tool, compatible with major browsers and user devices, including tablets and smart phones. The estimator's interface implemented on iPad is shown in Figure 4.
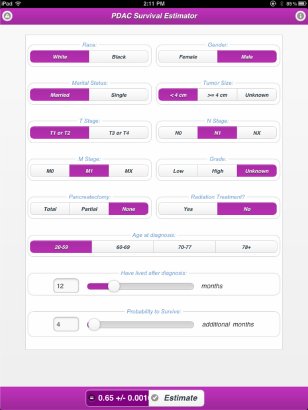
The interface of the PDAC survival estimator implemented on an iPad.
The estimator is available at: http://registry.unmc.edu/estimators/PDAC/.
Discussion
As with any other Cox models, the LPDAC and EPDAC models developed in this work have several potential limitations that may explain why predictions performed by the LPDAC and EPDAC models may be inaccurate in up to 30% of patients (discriminative power of these models, or c-index ∼ 0.70). One limitation is due to the omission of potentially prognostic variables. Specifically, the LPDAC and EPDAC models use variables provided by SEER, while other variables, for instance, co-morbidities in PDAC patients (such as renal failure, neurological disorders, liver disease, and cardiac arrhythmia) that may significantly contribute to mortality risk from PDAC are not utilized. 11
The second limitation is due to the fact that although the public-use SEER data on PDAC contains information on adjuvant radiation therapy, information on chemotherapy data is not provided.23,24However, about 85% of the PDAC patients who received radiation therapy also received chemotherapy. 25 Nevertheless, the absence of information on chemotherapy may lead to a bias in the estimation of the efficiency of radiation therapy when SEER data is used. 25
The third limitation is due to the use of the sum of the model variables, weighted by their coefficient values (log hazard ratio) as the prognostic index. In fact, estimation of the prognostic index, which is at the heart of Cox models, may be accurate for the majority of the observed PDAC population, but it may be inaccurate for relatively small, yet very important patient subpopulations. For instance, for LPDAC patients who have undergone pancreatectomy for a small sized tumor, the benefits of radiotherapy, as determined by our LPDAC Cox model, can be overestimated.
Nevertheless, our newly developed LPDAC and EPDAC models and computing tool (“estimator”) have distinct advantages over the existing models and tools, aimed at predicting survival probabilities for patients diagnosed with PDAC. Some of these advantages are similar to those that were highlighted in the work recently published by Katz et al. 9 These advantages are: (i) the developed models are applicable for the vast majority of PDAC patients (not only for those who are qualified for pancreatectomy) and (ii) the developed web-based computing tools are capable of the real-time prediction of conditional and unconditional survival probabilities for the patients diagnosed with PDAC. However, LPDAC and EPDAC models have additional advantages that can be seen by exploring differences between the models and computing tools developed in our work and the Katz work, as presented below.
The models presented in the Katz work were stratified by surgery status, while our LPDAC and EPDAC models are stratified by tumor extension. Our models use the following covariates (which were not used in the Katz work): marital status, time period, T-stage, M-stage, N-stage, and type of surgery. On the other hand, tumor subsite (which we found did not have significant influence on survival) and a stage covariate (which we found did not satisfy the proportional hazards assumption), were utilized in the Katz models, but not in our models. Further, our models were tested using c-indexes and cross-validated with the use of internal and external datasets, while the accuracy, reproducibility and generalizability of the corresponding models were not disclosed in the Katz work. Finally, our models were trained using data collected in 2004–2009 and account for time period effects, while the models of that work were trained on data collected in 1988–2005 and ignore possible time period effects.
There are also differences in performances of the estimator, developed in our work, and the calculator, developed in the Katz work. In fact, the calculator assesses survival time without adjusting for time period effects and thus implicitly makes predictions anchored to the middle of the 1988–2005 time interval, while our estimator predicts survival, projected to the later time period (2007–2009). In addition, the estimator provides standard errors for the predicted survival probabilities, while the calculator does not have this capability.
Conclusion
We showed that the LPDAC and EPDAC models developed in this work fit the observed survival data well, are well-calibrated, and have good discrimination (c-indexes) between cases. These models were used in the development of a web-based tool (estimator) to assess survival probability, conditional survival probability, and their standard errors. This tool uses the personalized demographic and clinical data on patients diagnosed with PDAC, as well as information on (performed, ongoing, or planned) medical treatment as input data. The estimator performs all calculations anchored to the latest time period, 2007–2009, which contains the latest SEER data available at the time of the preparation of this work.
The use of estimator developed in this work can help in clinical practice. In fact, clinicians mainly rely on personal experience, while the estimator is based upon the combined survival experience and clinical care of many patients and account for the effect of dozens of risk factors simultaneously. The estimator removes preconceived bias and offers assessments based on the personalized demographic and clinical data of a given patient. By toggling different treatment options, clinicians will be able to compare the predicted impacts of possible treatments on survival of the patient. A treatment that will not provide any significant advantage in survival, but would instead be detrimental to the patient's quality of life, should not be considered as an appropriate option. Using the computer-generated assessments and carefully considering the patient's co-morbidities, clinicians will be able to assist patients diagnosed with PDAC in making a more educated decision regarding potential treatments.
Author Contributions
Conceived and designed the experiments: MXG, TM, AS, OS, SS. Analyzed the data: MXG, TM, CA, AS, AS, OS, SS. Wrote the first draft of the manuscript: MXG, SS. Contributed to the writing of the manuscript: MXG, TM, CA, AS, AS, OS, SS. Agree with manuscript results and conclusions: MXG, TM, CA, AS, AS, OS, SS. Jointly developed the structure and arguments for the paper: MXG, TM, CA, AS, AS, OS, SS. Made critical revisions and approved final version: MXG, TM, CA, AS, AS, OS, SS. All authors reviewed and approved of the final manuscript.
Funding
This work was partially supported by the 1 R01 CA140940-03A1 (NIH, SS the PI) grant.
Competing Interests
Author(s) disclose no potential conflicts of interest.
Disclosures and Ethics
As a requirement of publication author(s) have provided to the publisher signed confirmation of compliance with legal and ethical obligations including but not limited to the following: authorship and contributorship, conflicts of interest, privacy and confidentiality and (where applicable) protection of human and animal research subjects. The authors have read and confirmed their agreement with the ICMJE authorship and conflict of interest criteria. The authors have also confirmed that this article is unique and not under consideration or published in any other publication, and that they have permission from rights holders to reproduce any copyrighted material. Any disclosures are made in this section. The external blind peer reviewers report no conflicts of interest.