
Abstract
Objectives:
Breast cancer (BC) stands as the second-leading cause of female-specific cancer-related fatalities globally, necessitating comprehensive research to address its critical aspects. This study aimed to explore the time intervals between surgery and disease recurrence in BC patients and their survival utilizing various parametric and semi-parametric models.
Methods:
After the examination of data collected from 2010 to 2021 at a BC Center in Tehran, Iran, 171 cases met the criteria for analysis out of 2246 datasets. Model fitting, was assessed through the Akaike Information Criterion (AIC), and indicated the logistic distribution as the most fit one among concurrent and independent variable models.
Results:
The Cox proportional hazard regression model consistently demonstrated superior fitting, characterized by the lowest AIC values. The average age at diagnosis was 50.39 years, with a standard deviation of 11.13. Typical survival time was estimated 53.44 months, falling within a confidence interval of 51.41–55.48 months at a 95% confidence level. The 1-year survival rate was determined at 0.92 (95% CI: 0.89–0.94). Notably, patient age while cancer diagnosis, progesterone receptor (PR), tumor grade, and tumor stage were found to be statistically significant (P < .05) risk factors for prediction of BC recurrence after surgery in Iran by Cox model.
Conclusions:
Our findings underscore the importance of further exploration and consideration of the identified risk factors in BC research and treatment strategies.
Introduction
Typically, cancer survival analysis employs parametric models and semi-parametric models. Parametric survival models assume that the duration of survival is associated with established distributions such as log-normal, exponential, Weibull, or log-logistic, while Cox Proportional Hazard (CPH) model is a common semi-parametric approach embraced by biomedical experts for its straightforwardness and mostly absence of assumptions concerning the distribution of lifespan. Parametric models are more efficient than the CPH model when considering sample sizes.1 -3 However, compared to parametric models, the COX model requires fewer assumptions.4,5 A study revealed that survival rates decline with age and there is an indirect correlation between age and survival rates. 6 Additionally, tumor size was found to be one of the factors associated with patient survivability. 7 It has been demonstrated that individuals with a positive estrogen receptor (ER) lived longer than those with negative ones. 8 Moreover, the number of affected lymph nodes was characterized as a crucial prognostic factor for BC. 9 It was found that greater tumor size, more affected lymph nodes, and elevated cancer markers are associated with an increased risk of recurrence in BC patients.10,11
The utilization of the Cox model indicated that BC patients had a median of disease-free survival is 64 months. 12 Moreover, findings revealed a noteworthy recurrence rate in 22% of BC patients. Also, much higher rates were observed among those diagnosed with high CA15-3 levels at diagnosis compared to individuals manifesting normal CA15-3 markers.13,14 Another research demonstrated a substantial correlation between elevated HER2 receptor levels and hormone receptor (HR) status. 15 Furthermore, findings have indicated that heightened estrogen production and the presence of ER greatly contribute to BC development. For individuals diagnosed with estrogen receptor-positive subgroup of BC, Tamoxifen is served as a supplementary treatment.16,17 The time of death in a BC patient in the hospital is influenced by factors such as age, educational status, region, initial tumor size, and pathological features. 18 A study has demonstrated the statistical analyses of time-to-death to showcase mortality benefits for treated females compared to untreated ones can help characterize effective treatments. Increasing chance of survival and delay cancer growth.19,20 On the other hands, another study found that there was a significant discrepancy in overall survival rates between groups with poor or moderate prognosis compared to those with good prognosis. 21 This indicates that patients experiencing higher stages of BC without chemotherapy and lower follow-up rates, were more likely to experience recurrence of the disease. 22
Several studies have employed distinct parametric and semi-parametric models to examine survival data related to BC, taking into consideration of various covariates such as age, stage of the disease and chronic conditions. The utilized models comprise of the generalized gamma distribution model, bounded cumulative hazard model as well as flexible categories for semi-parametric survival modeling. Different criteria encompassing Akaike Information Criterion (AIC), Bayesian Information Criterion (BIC) and log-likelihood value are used to evaluate each model’s performance.23 -28 These investigations offer valuable insights concerning factors that influence BC recovery chance along with identifying appropriate methodologies suitable for effective analysis of these datasets. Our current research aims to identify potential risk factors for BC recurrence using both parametric and semi-parametric methods.
Methods
Data and research variables
Initially, the data underwent pre-processing using both Excel and R software (version 3.6.3). This retrospective cohort study used data on risk factors and epidemiological data gathered from Tehran University of Medical Sciences (TUMS) in Iran between 2010 and 2021. A total of 2246 BC cases diagnosed by oncologists were selected in this study, of which 171 patients met the criteria required for the study, who had recorded/documented dates of surgery and disease recurrence. The primary factor in choosing this specific number of observations was the specific requirement for this study. We needed patients who had undergone surgery and experienced recurrence with clear dates, and among all the data, only this particular set met this criterion. Those individuals, whose recurrence date was not available were treated as right censoring information. Those participants, who had experienced BC recurrence were assigned code 1 (N = 171), while those without recurrence received code 0 (N = 2075).
The written informed consent was collected from all the patients for their contribution to the study and the collected data along with this study was in accordance with the TUMS ethical guidelines with ethical approval number IR.IUMS.REC.1397.1116. The original dataset consisted of 55 fields and 2246 rows. As part of the process, we adjusted dates to the Gregorian calendar format. Furthermore, by analyzing surgery and recurrence dates, survival times were calculated in months. We also identified censored data on the right side based on these variables. We then selected key variables that have a significant impact on BC such as estrogen, progesterone, HER2, ki67, tumor grade, positive lymph node, stage, size, and age using feature selection (Supplementary Table S1). In the study, estrogen, progesterone and HER2 were considered as factors with two categories each—positive (Pos) or negative (Neg). Similarly, ki67 was grouped into A for values lower than 40 and B for higher than 40. The age of participants was determined based on month and year of birth; then categorized into three subgroups: less than 46 years labeled C; between 46 to 69 labeled B; and more than 69 labeled A. The tumor grade was categorized into three numerical groups, 1, 2, and 3. Similarly, the tumor size variable had three subgroups; A for less than or equal to 2cm, B for sizes between 2 and 5 cm, and C for more than 5 cm. BC-afflicted cases with stages 1 to 4 were included in this study.
The data were then prepared using R software tools, which boosted the analysis. As the data contained missing values, various methods were explored to either remove, or estimate and fill these gaps. Ultimately, it was determined that deletion of such values would result in a significant loss of valuable information and appropriate estimation techniques are needed to tackle this issue. In order to perform this task properly, three different methods—mean calculation, regression analysis and multiple imputation-were conducted along with an R add-in package called “mice” which stands for “Multivariate Imputation by Chained Equations.” These measures helped us generate reliable estimates for our dataset based on the percentage of its remaining missing data points. If the missing data is less than 10%, the mean value can be used. For percentages greater than 10%, multiple imputations should be employed into analysis (the missing data in tumor size variable was 5.87% and in tumor grade variable in 9.43%). The “estimation by average” method was found suitable for data containing missing values below or equal to 5%, (through which the average of variables was calculated and substituted with the missing values), while regression and average methods are applicable when percentage of incomplete information ranges between 6% and 10% respectively. If more than twenty percent of data points are absent, then reliance on mice package becomes essential as it provides robust solutions through multiple imputations processes.
Statistical analysis
During this study, survival time was measured in months and also various R add-on packages were used. To this end, we used “mice” (Version:3.16.0) for the imputation of missing values, “Fitdistrplus” (Version:1.1-11) to fit semi-parametric distributions and “Survminer” (Version:0.4.9) for survival analysis facilitation as well as its visualization abilities; in addition, “ggplot2” (Version:3.4.4) was used for further visualizations. Our research aimed at predicting BC risk factors during the interval between surgery and recurrence through three statistical methods: parametric, semi-parametric and non-parametric approaches. The list of parametric models used in this study are provided in Supplementary Table S2.29,30 We used the following statistical fitting measure
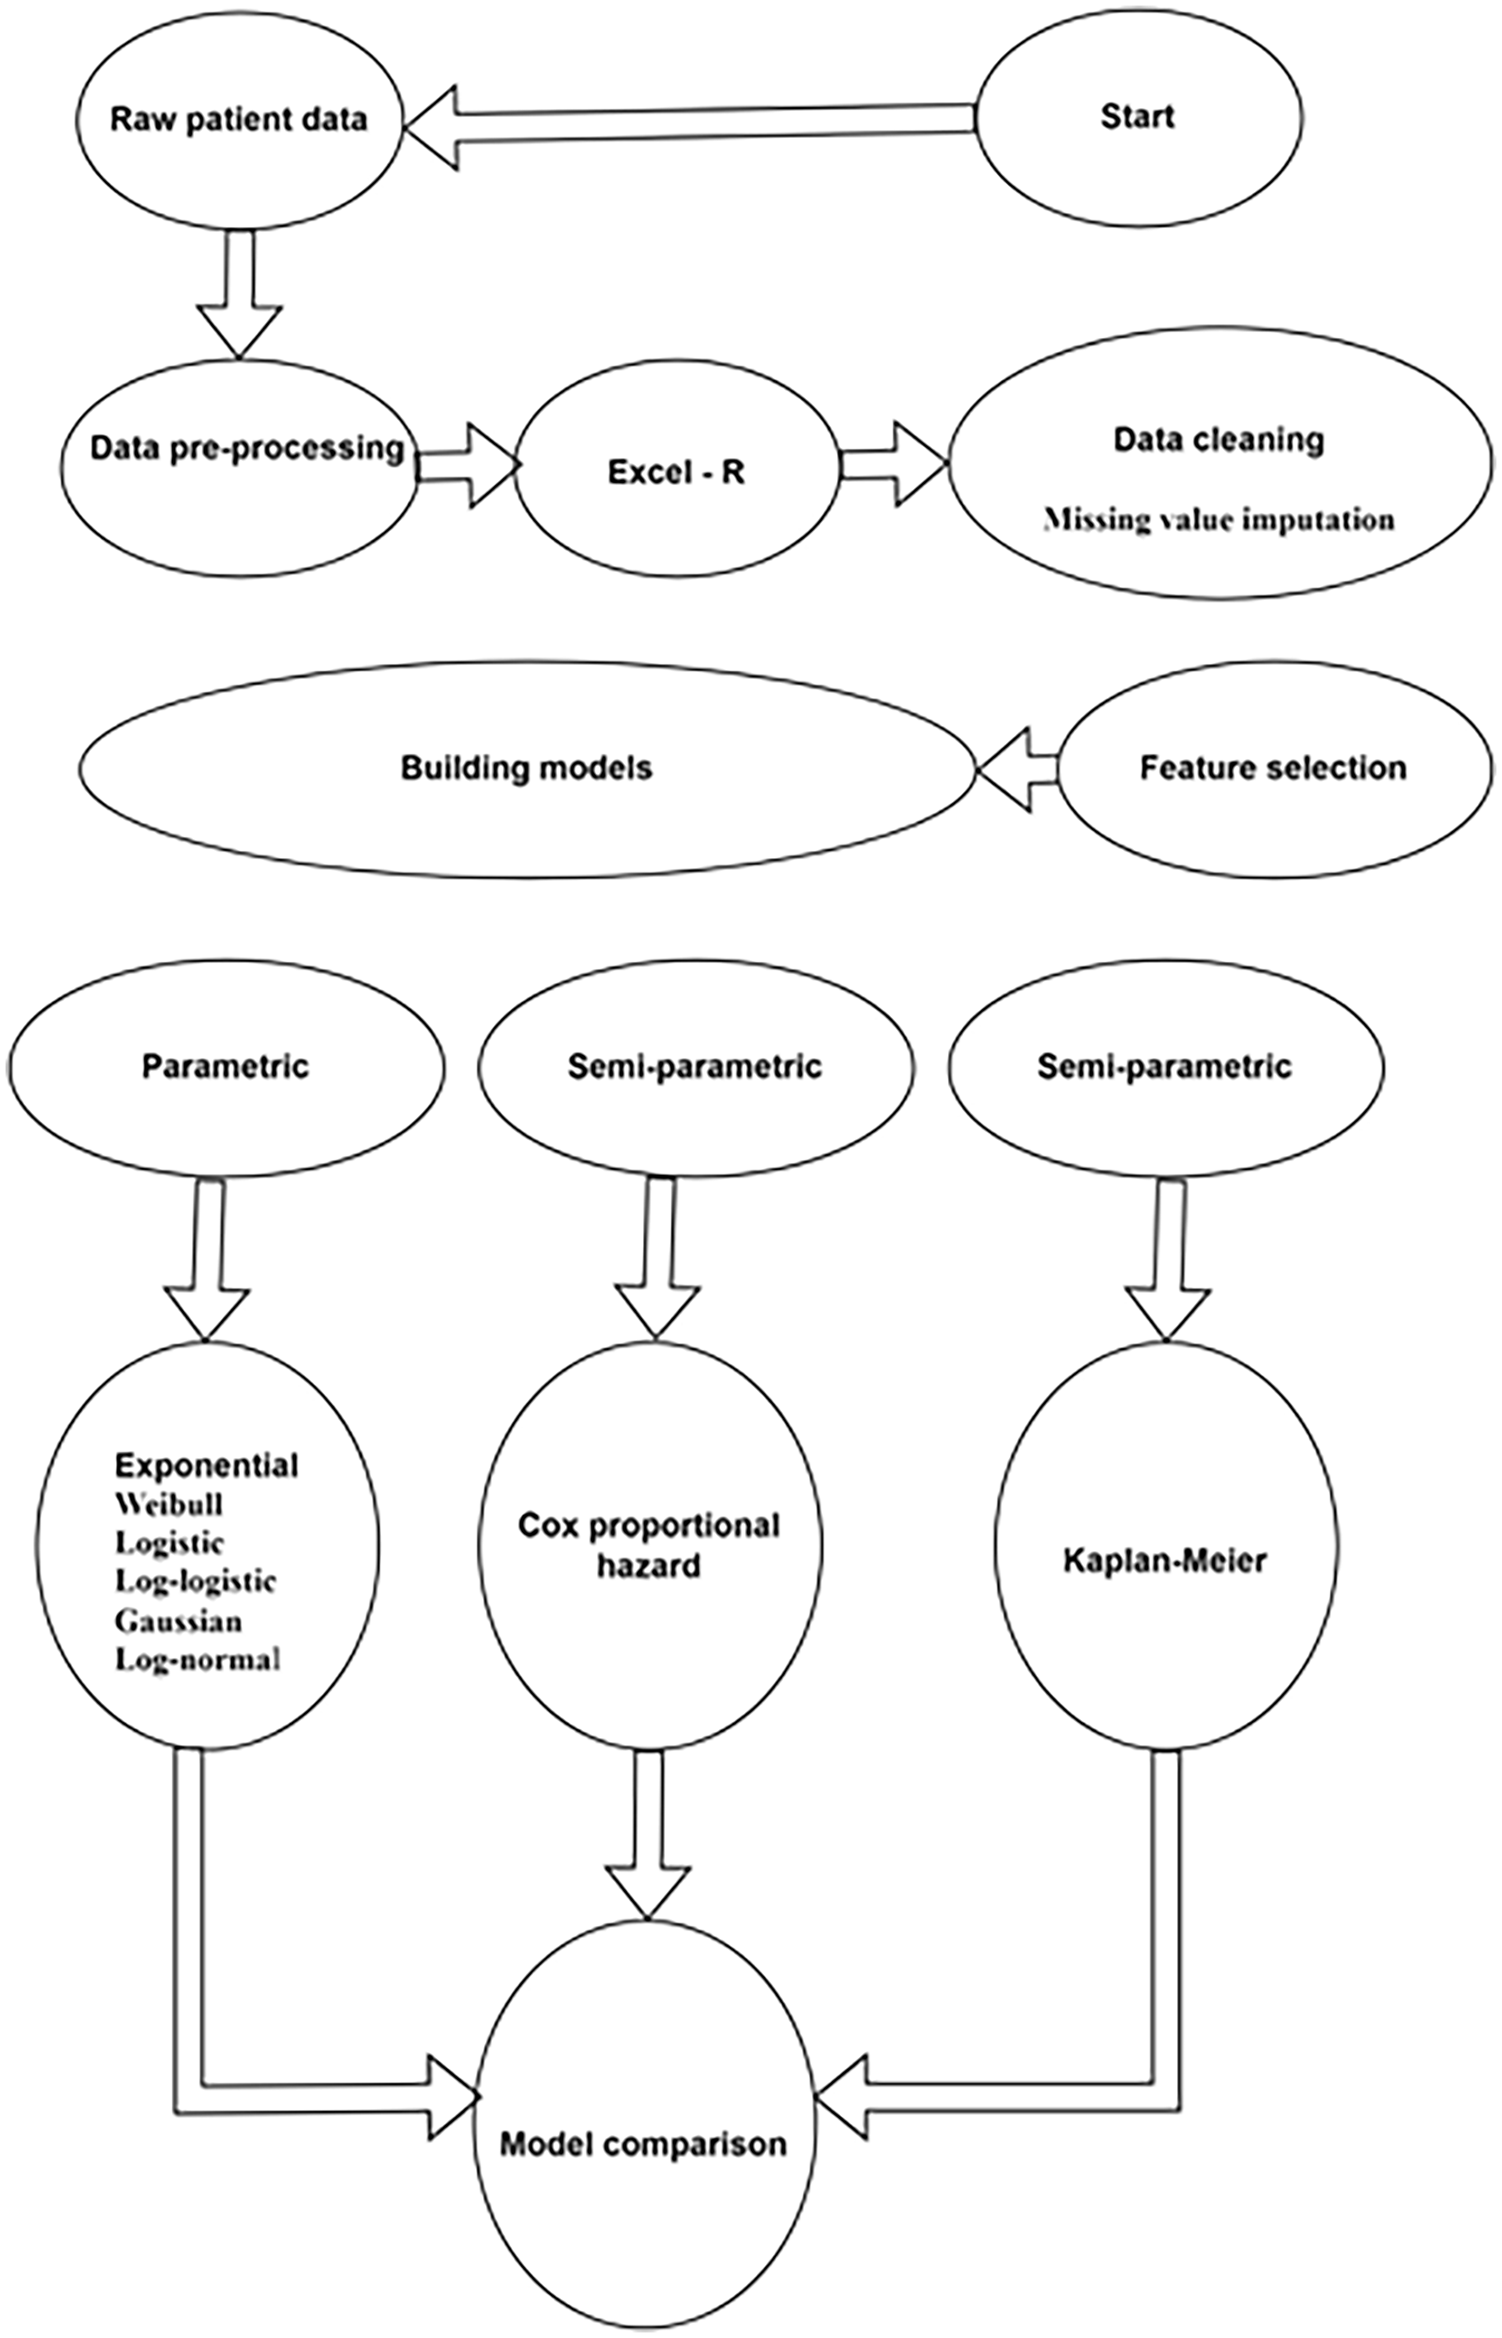
The pipeline used in the study.
The log rank test was used to determine whether there is difference between survival curves. In survival analysis, researchers frequently apply the log-rank test as a statistical hypothesis to compare the survival distributions of multiple groups. This non-parametric test avoids making assumptions about underlying distribution patterns for survival times. It works by assessing observed and expected events (i.e. manifestation of recurrence) in each group, then determining a Chi-squared distributed test statistic. The “event” was considered as the manifestation of recurrence. The unit of survival time was considered as “month.” Its computation and interpretation are simple, allowing it to be applied on both censored and uncensored data. Moreover, the log-rank test proves robustness against deviations from the proportional hazard’s assumption—an essential element of any survival analysis methodology. The log-rank test has a rival test called the Wilcoxon test, also known as the Breslow test. 31 The Wilcoxon test is another non-parametric test that is used to compare the survival distributions of two or more groups. It is based on the difference between the observed and expected number of events in each group, and it ranks the survival times of all the subjects in the study. 32 The Wilcoxon test is less commonly used than the log-rank test, but it can be more powerful in some situations, especially when the proportional hazards assumption is violated. However, the Wilcoxon test is more complex to calculate and interpret than the log-rank test.
Results
After sifting through 2246 cases, only 171 were deemed suitable for analyses based on the required criteria. Prior to modeling, preprocessing was carried out on the data since they were raw and cannot be used. The interval between the time of surgery and recurrence divided by 30.5 produced the recurrence data. On average, the patients’ age was 56.092 + 12.09 years with a median of 55 years. Nearly one-third (32.85%) of patients were aged below or at 50, while two-thirds (67.14%) were above 50. 4.45% of the patients died due to BC or other reasons, whereas around fifteen out of every two-hundred sample size (7.5%) experienced recurrence. Tumor grade, ki67, HER2, and disease stage were selected by employing stepAIC function (MASS package, Version: 7.3-60) that provided stepwise selection based on AIC for model derivation. The stepAIC is a widely used approach for selecting features. The stepAIC entails adding and/or removing predictive variables from the model until it is no longer possible to reduce AIC. Out of the eight variables mentioned, only age, PR level, tumor grade, and disease stage were identified as the most significant risk factors (Figure 2). Figure 3 presents separate Kaplan-Meier diagrams for each risk factor.

Frequency of risk factors.

(a) The estimation of survival probabilities for all BC patients. (b) Probability of survival of BC patients according to age. (c) Probability of survival of BC patients according to stage. (d) Probability of survival of BC patients according to tumor grade. (e) Probability of survival of BC patients according to progesterone.
Typical survival time refers to the average time patients survive after surgery. In our study, for considered time interval, the median survival time is approximately 53.44 months, with a confidence interval of 51.41 to 55.48 months at the 95% confidence level. This means that half of patients with BC won’t show recurrence for more than 53.44 months, while the other half may show recurrence within this period. Figure 3a displays the Kaplan-Meier plot representing the patients’ survival rate. Initially, the patients exhibited favorable outcomes, which persisted up to duration of 80 months; however, their probability of survival gradually declined over time. Survival rates remained steady for patients over a span of 150 to 200 months, until there was an abrupt drop in 200th month. According to Figure 3b, BC patients over the age of 69 have a greater probability of survival in comparison with those aged between 46 and 69. According to Figure 3c, individuals in subgroup four have invasive cancer and show an unusual decrease in their survival curve with a significant increase in the risk of relapse over time. Additionally, those categorized under subgroups 1 to 3, experience decreasing survival concerning the groups they belong to with the passage of time. According to the data depicted in Figure 3d, individuals with tumor grade 1 experienced longer survival rates compared to the other two subgroups. Their risk of recurrence is also lower than other groups, indicating a specific decrease in this risk over time for tumor grade 1 group. In contrast, BC patients who have been diagnosed with grade 3 tumors exhibit less likelihood to survive when benchmarked against their counterparts from group 1 and 2. It can be eventually inferred that through the passage of time once BC is diagnosed, those labeled under grading type one is more likely to cure without disease recurrence, while patients in category three may experience low survivability and increased chances of disease recurrence. According to Figure 3e, two curves are initially in close proximity and eventually converge. Throughout this research, the survival curve exhibits consistent increase in HR positive groups compared to HR negative, suggesting significantly better survival for the HR positive group. Interestingly, HR positive BC patients exhibit lower chances of recurrence compared to those negative ones. Moreover, PR positive cases demonstrate greater survival when compared to PR negative ones; they also less likely to experience a recurrence as more time passes. Therefore, the statistical analyses of these variables reveal a correlation between survival and BC recurrence throughout the cases.
Based on the log-rank test (available in Supplementary Table S3), it can be seen that the survival rate of BC patients based on age, PR, tumor stage, and tumor grade were statistically significant (p-value < .05). The investigated variables do not support the null hypothesis for the rank logarithm test and it can be concluded as a difference between survival curves.
Based on the results presented in Table 1, it can be concluded that the best fit for both semi-parametric and parametric models is represented by the full model. In specific terms, in parametric modeling this corresponds to a value of 2502.354, whereas in semi-parametric modeling its equivalent amount is 2464.213, indicating an enhanced overall adequacy level with regard to fit quality estimation. Out of all possible alternatives amongst these two categories (parametric and semi-parametric), Cox represents prevailing method and is recommended as the most effective choice based upon existing data analysis evidence from such testing scenarios. Table 2 displays the hazard ratio data, which suggests patients below 46 years of age to have a higher chance of experiencing adverse outcomes compared to those above 68. Furthermore, PR variable reveals a negative beta coefficient and significant association with the risk of recurrence. This implies HR positive individuals to less likely experience relapse as opposed to their HR negative counterparts. Conversely, some variables demonstrate substantial positive correlations signifying their tendency toward increasing recurrence rates in subjects. Lastly, BC patients classified under stage four, pose greater risks of reoccurrence than others at the base level based on our hazard ratio metrics. Table 3 summarizes the use of AIC in parametric and semi-parametric methods. The distribution with the lowest value for AIC is deemed best according to this criterion. As denoted by an asterisk, within both rows and columns, the model with the lowest value for AIC among non-parametric as well as parametric models has been highlighted. Table 3 presents the results of parametric and semi-parametric models. Specifically, it indicates that: Parametric models achieve their best fit when using the logistic distribution for age variable, progesterone receptor, and stage predictors with corresponding values of 2554.805, 2549.049, and 2524.156 respectively; the normal log distribution yields a value of 2548.491 as the optimal fit for tumor degree; semi-parametric modeling shows that stage has its strongest relationship with a value of 2484.388 being achieved for this predictor’s optimal model performance score. The AIC criterion reveals that the logistic distribution stands as the top-performing parametric model for univariate models with a score of 2524.156, while its semi-parametric counterpart secures first place among nonparametric models at 2488.388. Notably, Cox’s semi-parametric model ranks highest in both categories based on subjective assessment alone. To further demonstration of this matter, the analyses of two and three risk factor models are presented in Supplementary Tables 4S and 5S. Based on the data presented in Supplementary Table 4S, it is evident that the logistics distribution within the PR + stage model has performed best out of all parametric models with a dedicated value of 2509.95. Meanwhile, considering AIC and selected models among semi-parametric models, Cox’s apparently stands as the top performer for optimal fitting. Numerous studies have reviewed BC survival analysis literature and found that both parametric and non-parametric models are commonly utilized in this field.26,33 Among these studies, the AIC has often been used to determine the most suitable model. 34 Many of the mentioned analyses were conducted using R environment for computational purposes, which is also consistent with our study approach.
The best fitted model based on AIC criterion.

Its significance is upon the least AIC value (2502.354) in parametric, and least AIC value (2464.213) in semi-parametric models.
Hazard ratio estimated in Cox proportional hazard regression model based on age, PR, tumor grade and tumor stage.

*indicates that the variable was statistically significant (p-value < .05). indicates that the variable was statistically significant (p-value < .001).
Summary of AIC for parametric and semi-parametric methods.

Yellow highlighted indicate the best fit across models.
Bold values indicate the lowest (significant) value.
Discussion
Through analysis of the results of parametric and semi-parametric models in three risk factor models, the logistics distribution within the age + stage + PR model (presented in Supplementary Table 5S) provides a superior fit among all parametric models. Meanwhile, for an overall best fit value of 2465.126, it can be attributed to the Cox semi-parametric model. The AIC standard output for the complete model containing four risk factor models is displayed in Supplementary Table 6S. Based on the values listed in this table, it can be elicited that the semi-parametric model possessing a value of 2464.213 corresponds to Cox as being superior compared to other models. During our literature review, we encountered a problem concerning the limited number of studies with similar specific focus (deciphering risk factors over surgery to recurrence time interval) in our research, which could be considered as a limitation in the current study. Despite comparative analysis being crucial to scientific discourse, there is a deficiency of similar works which presents difficulties in directly relating our discoveries with existing scholarly sources. However, we believe that our study holds significance due to its distinct nature. The shortage of comparable literature underscores the fresh attributes and uncharted terrain within the statistical analysis of BC surgery outcomes in Iranian females implicitly and in the world explicitly. Despite the disparity present in current data, our manuscript renders remarkable conclusions into a distinctive demographic group. Also, this study had some other limitations including sample size, data quality, follow-up and disease duration, family history, confounding variables, and statistical methods. An access to a larger sample size could enhance the generalizability of results to a wider population. Moreover, any inconsistency or error within collected data might affect the accuracy the accuracy of the findings. On the other hands, there might be other factors influencing BC recurrence, which were not considered and included in the current study. Thus, selection of statistical models or assumptions made during our analysis could affect the validity of outcomes.
Taking into account of ethnicity and the increasing mortality rate of BC in Iranians inspired us that it will contribute immensely to this realm.
Based on the log-rank test presented in Supplementary Table S3, four risk factors including age, PR, tumor stage, and tumor grade were found to be statistically significant, among which tumor stage had highest chi-sq (76.8 on 3 degrees of freedom, p ⩽ 5e-09). Based on our models, tumor stage can thus be inferred to be best predictive risk factor amongst other for recurrence after surgery. On the contrary, the age factor exhibited lowest chi-sq (8.6 on 2 degrees of freedom, p ⩽ .01).
Based on the log-rank test (available in Supplementary Table S3), it can be seen that the survival rate of BC patients based on age, PR, tumor stage, and tumor grade were statistically significant (p-value < .05). The investigated variables do not support the null hypothesis for the rank logarithm test and it can be concluded as a difference between survival curves.
Conclusions
The association between BC recurrence and four variables—that is, age, PR status, tumor grade, and tumor stage—was found to be significant in our research. Binary representation of the aforementioned factors resulted in a better fit for normal log distribution or logistic log distribution when compared to the other three variables. When the variables were concurrently and independently modeled, the logistic distribution provided the best fit. Across all models evaluated by means of AIC criterion analysis in our study, Cox proportional hazard regression model consistently demonstrated superior fitting in light of its AIC criterion. Upon analyses, it was revealed that individuals who are under 46 years old face a greater likelihood of the disease reoccurrence. In comparison with older patients with a lifespan expectancy reaching up to 69 years, younger cases have relatively lower survival rates, which demonstrate a correlation between disease recurrence and survival in youngsters. Our findings revealed that ER+ is attributable to reduce the incidence of recurrence; however, no tumor-grade aside from grade three proved statistically relevant. Our findings underscore the importance of further exploration and consideration of the identified risk factors in BC research and treatment strategies.
Supplemental Material
sj-docx-1-cix-10.1177_11769351241297633 – Supplemental material for Unveiling Recurrence Patterns: Analyzing Predictive Risk Factors for Breast Cancer Recurrence after Surgery
Supplemental material, sj-docx-1-cix-10.1177_11769351241297633 for Unveiling Recurrence Patterns: Analyzing Predictive Risk Factors for Breast Cancer Recurrence after Surgery by Monireh Shahmoradi, Ahmad Fazilat, Mostafa Ghaderi-Zefrehei, Arash Ardalan, Ali Bigdeli, Nahid Nafissi, Ebrahim Babaei and Mahsa Rahmani in Cancer Informatics
Footnotes
Acknowledgements
None.
Author contributions statement
Writing an original draft of the manuscript text: Monireh Shahmoradi, Mostafa Ghaderi-Zefrehei, Ahmad Fazilat; Preparation of tables: Arash Ardalan, Nahid Nafisi, Ali Bigdeli, Ebrahim Babaei, and Ahmad Fazilat; Preparation of figure: Monireh Shahmoradi, Ahmad Fazilat; Preparation of supplementary data: Ali Bigdeli, Ahmad Fazilat; Supervision: Mostafa Ghaderi-Zefrehei, Arash Ardalan; Writing review and editing of final text: Mostafa Ghaderi-Zefrehei, Ahmad Fazilat; All authors have read and agreed to the published version of the manuscript.
Funding:
The author(s) received no financial support for the research, authorship, and/or publication of this article.
Declaration Of Conflicting Interests:
The author(s) declared no potential conflicts of interest with respect to the research, authorship, and/or publication of this article.
Ethics approval and consent to participate
All patients provided written informed consent for their participation, and the data collection adhered to the ethical guidelines of Tehran University of Medical Sciences (TUMS) with ethical approval number IR.IUMS.REC.1397.1116.
Availability of data and materials
The data presented in this study are available on request from the corresponding author.
Consent for publication
The written informed consent was collected from all the patients for their participations.
Supplemental material
Supplemental material for this article is available online.
References
Supplementary Material
Please find the following supplemental material available below.
For Open Access articles published under a Creative Commons License, all supplemental material carries the same license as the article it is associated with.
For non-Open Access articles published, all supplemental material carries a non-exclusive license, and permission requests for re-use of supplemental material or any part of supplemental material shall be sent directly to the copyright owner as specified in the copyright notice associated with the article.