
Abstract
An approach towards heterogeneous neuroscience dataset integration is proposed that uses Natural Language Processing (NLP) and a knowledge-based phenotype organizer system (PhenOS) to link ontology-anchored terms to underlying data from each database, and then maps these terms based on a computable model of disease (SNOMED CT®). The approach was implemented using sample datasets from fMRIDC, GEO, The Whole Brain Atlas and Neuronames, and allowed for complex queries such as “List all disorders with a finding site of brain region X, and then find the semantically related references in all participating databases based on the ontological model of the disease or its anatomical and morphological attributes”. Precision of the NLP-derived coding of the unstructured phenotypes in each dataset was 88% (n = 50), and precision of the semantic mapping between these terms across datasets was 98% (n = 100). To our knowledge, this is the first example of the use of both semantic decomposition of disease relationships and hierarchical information found in ontologies to integrate heterogeneous phenotypes across clinical and molecular datasets.
Introduction
Increasingly, there is an understanding that well-managed, comprehensive databases and their interoperability will be necessary for important further advancement in neuroscience.1,2 However, in contrast to the reliance on and advancements of informatics in other biosciences, such as molecular biology and genomics, for which data is primarily text-based, the tremendous complexity of neuroscience data is a major impediment in consistent informatics integration and implementation. 3 There have been many proposed solutions to this problem, most of which rely on the labor-intensive and time-consuming development of compatible metadata models of phenotypes that formally describe entities, attributes and the relationships between them in the underlying data (see http://phenos.bsd.uchicago.edu/public/supplement-1-CI.doc, hereafter referred to as Supplement).
One promising and complementary approach has been to use Ontologies employing Description Logic (DL), such as those that have been introduced into biomedical domains, as a flexible and powerful way to capture and classify biological concepts and potentially be used for making inferences from biological data.4,5 A notable example related to the current approach is Biomediator, a data integration tool which relies on a common data model (source knowledge base) and schema mapping to allow queries across semantically and syntactically heterogeneous data sources (www.biomediator.org). In Biomediator, users modify and extend a customized source knowledge base, or mediated schema, which maps and describes interrelationships between entities of participating databases. 6 Notably, Biomediator was recently adapted to the neuroscience domain in identifying various cortical areas involved in specific language errors. 7 Another example of a mediated schema in neuroscience is BIRNlex, 8 a formally structured ontology covering clinical neuroimaging research designed for the organization and retrieval of distributed multi-scale brain data included in the Biomedical Informatics Research Network (BIRN, www.nbirn.net). 9
A complementary approach capitalizes on the knowledge encapsulated in comprehensive, pre-existing DL Ontologies which are utilized as “pre-made” mediated schema. However, a major challenge to the use of pre-existing DL ontologies in mediating between diverse databases is the differences in concepts and terms used to describe the underlying data in each database. 10 This has been addressed by the development of automated methods for the lexical mapping of terminologies and medical vocabularies onto a major medical DL ontology used to link disparate information systems, typically the Unified Medical Language System (UMLS)11–13 but also SNOMED as was recently done for ontology-based query of tissue microarray data. 14
The current effort differs from previous approaches in that we exploit SNOMED for its hierarchical relationships as a Directed Acyclic Graph (DAG) and model-theoretic semantic decomposition of diseases into their constituents (i.e. diseases are related to anatomies through ‘has finding site’ and to morphologies through ‘associated morphology’) to find relevant relationships across various granularities of biology represented in different databases. Thus, this approach organizes and maps between unstructured datasets more powerfully than would be accomplished by text-mining and mapping of concepts to ontologies alone, offering an advantage in mapping very distinct datasets (i.e. neuroimaging and gene expression microarrays) that may not share many concepts. In effect, the proposed approach is more effectively utilizing the ‘reference model’ of disease (and related anatomies and phenotypes) that is contained in SNOMED, which is particularly suitable due to its depth of biological scale and comprehensiveness in human pathologies in general and particularly in psychiatric disorders.15,16
Altogether, this paper presents a methodology for the integration of unstructured datasets which is ontology-anchored and driven through the model-theoretic semantic organization of diseases and their pathophysiologies. First, we provide structure over unstructured metadata of neuroimaging and gene expression datasets using PhenOS, a knowledge-based phenotype organizer system, 17 which was recently used in assigning phenotypic context to Gene Ontology Annotations. 18 This is followed by a non-trivial and comprehensive semantic model of the pathophysiology of diseases to relate terms of diseases, anatomies and morphologies together. The explicit pathophysiological and anatomical knowledge of diseases was extracted from semantic relationships found in the medical ontology SNOMED. Finally, similar to mediated schema, which extended the semantic data model with a graphical representation where nodes represent relevant entities within the genetics domain and edges represent relationships between these entities,19,20 we present a graphical representation of our semantic model to highlight the various complex and loosely-defined queries that are possible with our system.
Materials and Methods
The current method employed five general steps (further described below): 1) conceptualization of the general query model, that defines the traversable paths such as hierarchical relationships and semantic switches (i.e. a disease term switches to an anatomical term through the relationship ‘has finding site’) that are used in mapping relationships between terms contained in each database 2) mapping of database terms to SNOMED via NLP and coding 3) mapping rules of relatedness (according to the general query model) and 4) query construction and implementation and 5) evaluation. Mapping of database terms to SNOMED was conducted using PhenOS, a knowledge-based phenotype organizer system, 17 which was also used in assigning phenotypic context to Gene Ontology Annotations. 18 The architecture is outlined in Figure 1.

Overall scheme for heterogeneous database integration. Natural Language Processing and Coding (PhenOS) was first used to assign terms (and their corresponding SNOMED codes) to underlying data (Primary data) for each of the participating databases. These were organized into tables (Secondary data) whose fields were then related and mapped using ancestor-descendant and translation tables generated from SNOMED (Data mapping).
Query Model
For simplicity we focused on three main classes within the SNOMED ontology: Anatomy (i.e. cingulate gyrus, hypothalamus), Abnormal Morphology (i.e. neoplasia, inflammation) and Disease (i.e. Alzheimer's, encephalitis), abbreviated by

Model-theoretic query using hierarchical information as well as semantic decomposition of diseases. The SNOMED ontology model extends along two axes (i) the ‘hierarchical-axis (diagonal-axis or y-axis)’ where subsumption-type relationships can be derived between ancestor and descendant concepts in the same semantic type (e.g. astrocytoma of brain is an intracranial glioma), and along (ii) semantic model of diseases that can be decomposed in their attributes (horizontal axis or x-axis) where Diseases (D) are decomposed in Anatomical attributes (A) and Abnormal Morphologies (M). While the SNOMED semantic model of diseases also supports functional and etiological attributes for diseases, only the anatomies and morphologies were used in this proof-of-concept. Participating databases extend down along the ‘vertical-axis’. Each axis can be extended further; extension down the ‘y-axis’ is accomplished as more specific terms are added to SNOMED with upcoming revisions, relatable semantic classes could be added along the ‘x-axis’ (i.e. Disease can also be related to class ‘Organism’ through linkage concept “causative agent”), and more heterogeneous databases can be added along the ‘z-axis’.
The query model is flexible and general enough to allow for many different types of loosely defined queries. In essence, all queries possible within the model are delineated by traversing the edges on the ‘x–y plane’ (hierarchical and disease's attribute plane), and databases to be included are chosen along the ‘z-axis’ (distinct datasets). Up and down arrows connect more broad and more specific concepts within a class through ‘is a’ (or ‘part of’ for anatomy) parent-child relationships. Horizontal arrows represent possible semantic switches and connect the three different classes with each other (D connected to A through ‘has finding site’, D connected to M through ‘has associated morphology’) and these can be traversed in both left and right directions.
Natural Language Processing and Automated Ontology Encoding (PhenOS)
Dataset terms from fMRI Data Center (fMRIDC), The Whole Brain Atlas (BRAIN), Gene Expression Omnibus (GEO) and Neuronames and their underlying accession IDs were obtained and tabularized (see Supplement for URLs and more details). For each of these participating databases a table was created (via PhenOS) which consisted of dataset terms linked to a SNOMED ID code and their accession numbers to underlying data (‘secondary data’ in Fig. 1). PhenOS attempts to find the best SNOMED term that matches each participating dataset term by employing the following 3 steps: 1) Normalize SNOMED CT and dataset terms using the lexical program “Norm” (http://www.nlm.nih.gov/research/umls/online%20learning/LEX_005.htm), which involves stripping possessives, replacing punctuation with spaces, etc. 2) For each SNOMED ID, a table was created that counted the number of (normalized) words used in each definition associated with the ID. An example table for SNOMED ID 115240006 is shown below:

3) For each SNOMED ID, let m = number of words in SNOMED (i.e. for 115240006, m = 3, 1 and 2 for each associated definition). For each participating, normalized dataset term, let n = the number of words in the term. Query the normalized SNOMED database table for the participating dataset terms, and let k = the number of matching words between each SNOMED ID definition and the dataset term. For each SNOMED ID term we compute the score = 2*k/(m + n). If the score = 1 there is an exact match between the participating dataset term and the SNOMED ID, otherwise the SNOMED ID and definition with the largest score mapping is chosen. If multiple choices have equivalent scores, they are all retained.
PhenOS output tables (dataset terms linked to their closest matching SNOMED IDs) were generated for Brain, Neuronames, fMRIDC and GEO, and an example row from fMRIDC and GEO is depicted in Supplementary Table 1. (Note: for ‘Brain’, a database consisting mostly of references to brain diseases and a representative brain image, no accession numbers were included).
Example entries of tables created through PhenOS for two (fMRIDC and GEO) participating databases.

Mapping Rules of Relatedness
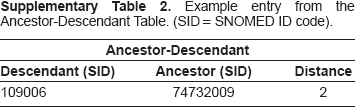
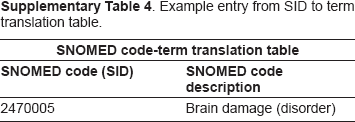
An ancestor-descendant table was generated that included all SNOMED concepts under three nodes: brain tissue structure, diseases of brain and morphologically abnormal structure and the distances between them. A translation table was also generated in which each disease under the node disease of brain was mapped to its Finding Site (Anatomy) and/or Associated Morphology (Morphology). In addition, a mapping of all SNOMED IDs to their descriptions was generated (to be used in carrying out class-based queries). Example entries from the above tables are shown in Supplementary Tables 2–4.
Example entry from the Ancestor-Descendant Table. (SID = SNOMED ID code).
Example entries from a translation table mapping diseases to anatomies or morphologies.

Example entry from SID to term translation table.
Query Implementation
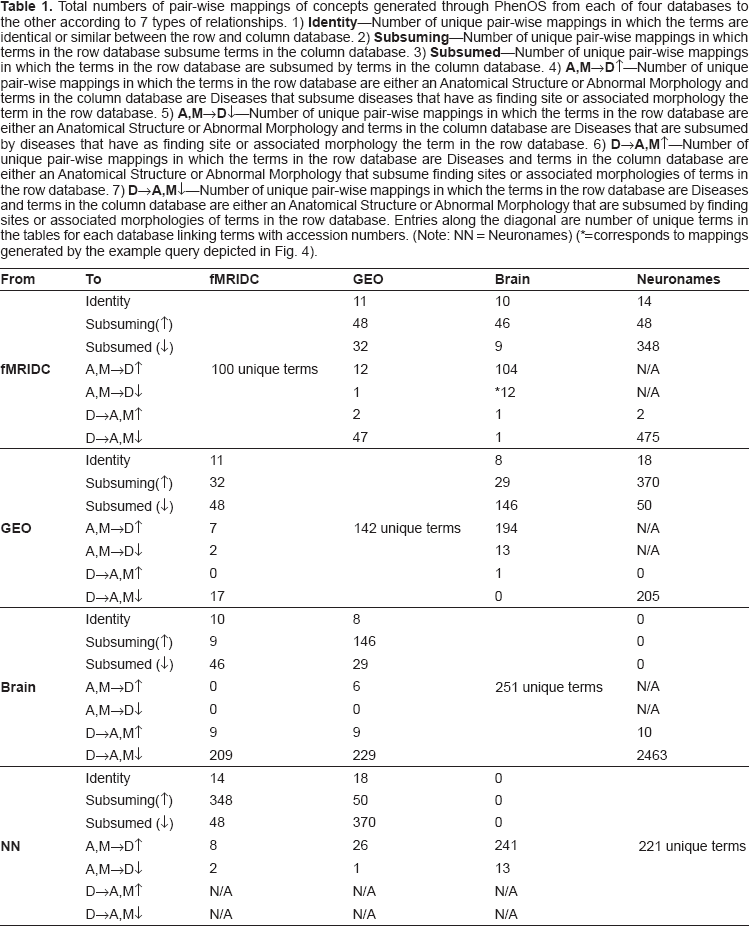
All of the above tables were imported into Microsoft Access 2003 and were used to recreate seven queries, or navigation paths, possible within the framework outlined by the model-theoretic query (Fig. 1). Two general types of queries are described: 1) pair-wise ‘mapping query’, whereby all terms (and accession numbers to underlying data) between two databases that meet the criteria for the specified relationship type are returned and 2) ‘class-based query’ whereby a user can input a term (either an Anatomy, Disease or Morphology concept), specify the relationship (type of mapping) and retrieve terms that fit the specified mapping from one or more selected databases. An example ‘mapping query’ is depicted in Figure 3A, and answers the query ‘Find Anatomy and Abnormal Morphology terms in fMRIDC that are associated with diseases and/or their subtypes that are included in Brain’ (‘fMRIDdc to Brain A,M→D↓’). This was done for each permutation of possible pair-wise mappings between all participating databases, and for seven types of semantic relationships. The numbers of unique pair-wise mappings generated between each database and for seven types of relationships were used to populate Table 1.
Total numbers of pair-wise mappings of concepts generated through PhenOS from each of four databases to the other according to 7 types of relationships. 1)

Schematic of fMRIDC_AMtoD_Brain_subsumed select ‘mapping query’ setup in MS Access 2003
Evaluation
The evaluation was conducted on a set of 100 randomly selected and manually inspected mappings between the datasources, as well as on 50 randomly selected and manually inspected mappings from step 2 of the approach (NLP & Coding). Precision was measured as the number of true mappings divided by the total number sampled, TP/(TP + FP), where TP = true positives, FP = false positives. The criteria for a “true” result was a correct biomedical and semantic relationship according to the structure of the ontology and according to the knowledge of the expert curator. Furthermore, specific anatomical and disease terms from the original databases were correctly encoded in SNOMED if the SNOMED entity was either the same anatomy or disease (within the same semantic type) or an ancestor. For the initial encoding (before relating databases together), coding of a term to a related concept in the wrong semantic type or to an entity that was more specific than the original term were considered erroneous (mismapped). 95% Confidence Intervals (95% CI) of the precision score were also calculated using the normal approximation interval of the binomial distribution: (p ± Zc*√[p(1-p)/n], where p = TP/(TP + FP), Zc = 97.5 percentile of a standard normal distribution, and n = sample size. This formula was used as it is the simplest and most commonly used to approximate confidence intervals for proportions in a statistical population.
Results
5,497 unique pair-wise mappings were generated for seven types of relationships between each of the datasets: 1)
The majority (3,646) of these mappings are accounted for by the
The main point of Table 1 is to show the increase in overlap and relatedness between participating databases as more types of relationships are mapped, however, the major utility of our proposed approach is in ‘class-based queries’. A schematic example of the class-based query “List all diseases with Finding Site ‘temporal lobe’ and then find references to these diseases (identical or subsuming) in all participating databases”, with its navigation path traced over the Model-theoretic query, is shown Figure 4. Figure 5 depicts in more detail the navigation path through SNOMED, used in returning a result for this query. The MS Access query setup for this query is given in Figure 3B with results 3C. In future implementations of the system, class-based queries would be generated for each type of specified relationship on a web interface.

Graphical depiction of the class-based query: “List all diseases with Finding Site ‘temporal lobe’ and then find references to these diseases (identical or subsuming) in all participating databases.” In this example, ‘temporal lobe epilepsy’ is directly referenced in GEO, but must be expanded to subsuming ancestor term ‘epilepsy’ to find the closet match in fMRIDC, and ‘progressive aphasia in Alzheimer's disease’ must be expanded to subsuming ancestor term ‘Alzheimer's disease’ to find matches in both GEO and fMRIDC.

‘Close-up’ depiction of semantic navigation path through the SNOMED ontology for one result in answering the class-based query “List all diseases with Finding Site ‘temporal lobe’ and then find references to these disease (identical or subsuming) in all participating databases.” Solid arrows are query navigation path, and dashed arrows are SNOMED directed relationships (“has finding site” and “is a”). “Temporal lobe epilepsy” is found to be referenced in GEO, whereas only the more general term “epilepsy” was found in fMRIDC.
In a second sample class query the term “mass” was used to retrieve all subsumed terms and underlying accession numbers from the GEO dataset. Using the symbols from above, this query can be written as
Based on 100 randomly selected and manually inspected mappings from Table 1 (25 to each datasource), the precision of the method was 98% ± 2.7%. Based on 50 (12–13 from each datasource) randomly selected and manually inspected mappings from tables generated through NLP and PhenOS, precision for stage 1 of the method was 88% ± 9%. Table 2 depicts the reasons for common errors and examples. Supplementary Table 5 depicts the 150 randomly selected mappings.
100 randomly selected pairwise mappings (25 to each datasouce, top) from Table 6 and 50 randomly selected codings (12–13 for each datasource, bottom) generated through PhenOS and NLP (Stage 1).

Most frequent types of errors in precision are shown along with examples.

Discussion
Whereas the current work is establishing a proof of concept, a further developed implementation of our system would be a web interface whereby users would type a query that is either an anatomical, morphological, or disease concept, specify the type of relationship they want to retrieve (i.e. A -< D↑ = “find all subsuming types of diseases that affect brain region “x”), and specify one or more databases from which to search for and retrieve results that fit the specified relationship. In addition, as participating databases become more populated it may be useful to integrate some mappings generated from the system into the fMRIDC search tool (http://1X50.fmridc.org/dcsearch/). Users would be able to retrieve subsuming and subsumed diseases that affect specific brain regions, as well as accession numbers of fMRIDC datasets that reference those diseases if they exist. Users would also be able to retrieve the closest matching GEO (GSM) gene expression datasets of tissues that subsume or are subsumed by specified brain regions in fMRIDC.
Seamless integration of complex data types (i.e. imaging, microarrays) is the goal of many brain information resources and databases (http://braininfo.rprc.washington.edu).21,22 While there are important efforts to standardize neuroscience data and meta-data models so that heterogeneous data can be joined across many disparate participating databases, 23 the current work represents a complementary approach that bypasses the need for compatible data models and maps metadata between disparate participating databases on a semantic level. Importantly, a novel advantage of the current approach is that it utilizes the comprehensive knowledge already encapsulated in the SNOMED ontology to enable certain loosely-defined queries that heretofore had no method for being answered.
Potential Use-Case Scenarios
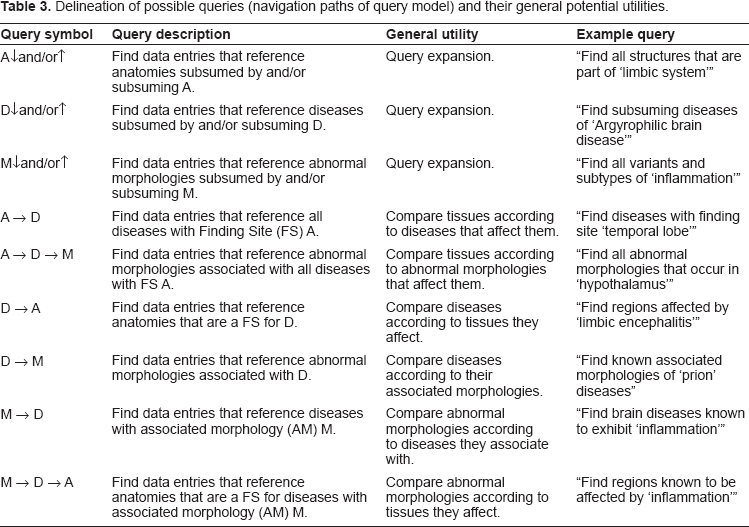
More and more studies are emerging that attempt to find and interpret correlations between biomarkers, imaging, and neuropsychological markers. 24 Ideally, the observed parameters included in a correlation study all come from the same subject. However, except for a few rare instances, this is not possible if we want to include gene expression data as well. This seems most relevant for emerging studies that attempt to correlate the genotypes (polymorphisms) of individuals with various Mendelian heritable cognitive disorders and/or disorders thought to have a strong genetic component with functional neuroimaging data.25–33 Many of these studies could potentially be extended with questions such as: 1) where in the brain are polymorphic alleles normally expressed 2) what other genes are coexpressed with these alleles and where 3) if an abnormal morphology is present, is the allele in question or any coexpressed alleles differentially expressed in tissues undergoing a similar pathological process (i.e. abnormal morphology such as inflammation or neuronal degeneration) and 4) how does functional and/or structural neuroimaging data compare to patients with a different yet related disease/disorder? For the conduction of meta-analyses it would be useful to quickly survey, retrieve and compare relevant data that can be downloaded from online databases. For instance, as high-throughput meta-analysis of microarray data become more feasible, 34 a system such as this could help organize and retrieve data for integrative studies that assess correlations of gene expression profiles and/or functional or structural imaging data of brain regions according to the diseases or abnormal morphologies (pathological processes) that affect them in attempts to gain greater insight into the nature of psychiatric diseases and disorders. Table 3 summarizes the possible query types along the ‘x-y’ of the Query Model and suggests their potential use-case scenarios.
Delineation of possible queries (navigation paths of query model) and their general potential utilities.
A potentially helpful future implementation of this system could include all tissues and diseases, not just those associated with the brain. Many cognitive disorders having a strong genetic component that affect the body at multiple sights, in addition to the brain, and can present with a variety of well studied phenotypes ranging from the cellular to the behavioral. Such a system could then help to integrate, find and retrieve data from disparate databases that all relate to the disease. For example, an ‘upward’ query expansion of “Wilson's disease” reveals multiple parents of the disease that also represent different fields of study: Wilson's disease “is a” 1) disorder presenting primarily with chorea 2) metabolic and genetic disorder affecting the liver 3) digestive system disorder 4) hereditary disorder of the nervous system 5) disorder of copper metabolism 6) degenerative disease of the central nervous system 7) disease of brain and 8) autosomal recessive hereditary disorder. A meta-analysis that includes a re-contextualization and comparison of heterogeneous data and literature on all the diverse aspects of Wilson's diseases could potentially yield new clues and insights at the phenotypic and molecular level.
Due to our system's ability for automatic query expansion, it can also allow for integrative analyses at the ‘systems level’. For example, a researcher interested in comparing the gene expression profile of the limbic system vs. the rest of the brain would enter ‘limbic system’ as a class-based query and choose to return subsumed references from the gene expression database. The system would automatically delineate and decompose the defined components of the limbic system (i.e. amygdala, entorhinal cortex, etc.), find closest matches of these constituents where they exist in the gene expression database, and continue to search for even smaller substructures (i.e. amygdala: basolateral complex, cortico-medial nucleus, etc.) This type of query would become more relevant as microarray technology improves and gene expression databases are populated with profiles from smaller and smaller samples (all the way down to the cellular level).
Limitations
In addition to the inherent limitations of mapping only on the semantic level, the approach is also limited by mismapping due to the inherent risks in NLP and text mining. This is further amplified by potential mismapping of the knowledge source (SNOMED) as we explore many more relationships than usual in a DAG. Additionally, the pathophysiological model is not necessarily useful in each instance of queries. Restricting the pathophysiological model could in theory recapitulate the functionality of previous studies such as those of Biomediator and would require limiting two features of the current approach: (i) “identical semantic type” (thus no associations between morphologies and diseases) and (ii) “identical code” (thus no ancestor-descendant associations). In future studies, we plan to use the BiomedLEE NLP 35 and a more formal schema for representing NLP-derived results 36 that has higher accuracy than text-mining.
Conclusion
The current work presents a novel method for query implementation that first provides structure over unstructured metadata of neuroimaging and gene expression datasets through NLP and coding, and then makes use of the pathophysiological model found in a medical ontology (SNOMED) in order to decompose semantic information and to allow the association of anatomies or morphologies related to disease across datasets. This allows for the integration of heterogeneous data with different biological scales, such as arrays and imaging, because the decomposition of a diagnosis or disease to its cell type, anatomical and/or morphological component allows for the spanning of more biological scales than the diagnosis would do alone. While the relationships between semantic types are explicitly defined in SNOMED, the meta-model of disease pathophysiology and disease anatomies remains implicit. To our knowledge, this is the first comprehensive implementation of the model of SNOMED's diseases that exploit their semantic decomposition in their otherwise implicit sub-phenotypes (histological, anatomical, morphological) that can further be mapped to the histological/morphological/anatomical metadata found in other scales in datasets such as microarrays.
Increased interoperability between very heterogeneous neuroscience databases (such as neuroimaging and gene expression databases) would allow for the beginning of exploration into questions that are beyond the limits of current biological techniques, such as testing whether the functional organization of the brain in normal and/or disease states as assessed through neuroimaging techniques is related to the gene expression profile of the brain in normal and/or disease states. This paper proposed a method that could help integrate and organize data from multiple online databases without the requirement of compatible data schemes between the databases, and that could potentially be a useful step towards this goal.
Disclosure
The authors report no conflicts of interest.
Footnotes
Integration of neuroimaging and Microarray Datasets through Mapping and Model-Theoretic semantic Decomposition of Unstructured phenotypes-Supplementary
Acknowledgments
We thank John D. Van Horn for valuable input and advice. We acknowledge the support of the following grants: the NIH/NLM 1K22LM008308 (Semantic Approaches to Phenotypic Database Analysis), and the NIH/NCI 1U54CA121852-01A1 (National Center for the Multiscale Analysis of Genomic and Cellular Networks (MAGNet).