
Abstract
Cancer is a disease associated with the deregulation of multiple gene networks. Microarray data has permitted researchers to identify gene panel markers for diagnosis or prognosis of cancer but these are not sufficient to make specific mechanistic assertions about phenotype switches. We propose a strategy to identify putative mechanisms of cancer phenotypes by protein-protein interactions (PPI). We first extracted the logic status of a PPI via the relative expression of the corresponding gene pair. The joint association of a gene pair on a cancer phenotype was calculated by entropy minimization and assessed using a support vector machine. A typical predictor is “
The evolution of systems biology out of molecular biology has redefined the concept of a biomarker from a traditional single parametric measure to that of a profile involving multiple genes. 1 This type of approach has identified several gene expression signatures of breast cancer for prognosis prediction,2–6 although these signatures do not yet provide enough understanding of how these genes cooperatively predict the phenotypes. Recently, analysis of pathway-derived signatures achieved better prediction power in an independent cohort. 7 However, this method still lacks the capability to make specific mechanistic assertions about the phenotype discrimination. Thus, resolving pathway signatures into specific genes, or interaction of genes, can provide additional insight regarding the behavior of a system as a whole, and may assist in the identification of potential targets for future drug development..8,9
Here we propose a novel approach to identify synergistic protein-protein interactions associated with a cancer phenotype discrimination. The genome-wide protein interaction data provides unique prior knowledge as a physical basis of cellular signaling pathways. When coupled with gene expression profiling data, it becomes feasible to evaluate the role of protein interactions in a cancer phenotype discrimination. In this pilot study, gene pairs involved in protein-protein interactions were binarized into two states: “high-expression/low-expression” or “on/off “. Thus there are four states (00, 01, 10, 11) for each gene pair and the uncertainty that a given state falls into a certain phenotype can be evaluated by a Shannon entropy calculation. The pairs which have minimum entropy for a given cancer phenotype were selected as the pairs most likely associated with that phenotype. The phenotype prediction performance of two-genes pairs were evaluated by a support vector machine (SVM) classifier. The output of the above analysis pipeline is a set of logic statements on phenotype discrimination in the form of: “
Materials and Methods
Data set
Adjacent normal-tumor matched lung cancer samples were analysed by the Affymetrix GeneChip Human Genome U133 Array Set HG-U133A. A total of 66 samples were used for microarray analysis, including pair-wise samples from 27 patients. 10 The accession number in the Gene Expression Omnibus (GEO) is GSE7670. The protein-protein interaction data was downloaded from the Human Protein Reference Database (HPRD) (09/01/2007 release).
Entropy minimization
The joint association of gene pair expression states with phenotype was evaluated by calculation of the entropy. Here we adapted a simple formulation called Entropy Minimization and Boolean Parsimony (EMBP).
11
Firstly, the logarithmic transformed expression value of each gene was binarized into two states: 1 as “high-expression” and 0 as “low-expression” using the corresponding average value across samples as the threshold. Then there are four possible states for each gene pair (Table 1). For each state (S) we counted the number of times,
Example of entropy calculation from protein-protein interaction data for a gene pair.

N0, number of times that the state S appeared in normal samples. N1, the number of times it appeared in cancerous samples. H, entropy.
The uncertainty of determining whether or not the state is encountered in a cancer phenotype was estimated from the entropy

We then performed a label-randomizing permutation test 10 5 times, to assess whether any selected predictive gene pairs differed significantly from those selected at random. The permutation P value were calculated by comparing the H with the randomly permutated H.
SVM classification
To evaluate the prediction performance of gene pairs as biomarkers, we use a support vector machine (SVM) as a classifier to test the classification power. For each gene pair, we used the expression values of the two genes as the inputs. The kernel was polynomial (degree 1), and the prediction accuracy on leave-one-out cross-validation was evaluated by the GeMS tool with default setting 12 (http://www.gems-system.org/).
Results and Discussion
The gene pairs most strongly associated with the phenotype for human lung cancer are listed in Table 2. Almost all of the 16 gene pairs listed showed a prediction accuracy >90% and all modules had a
Protein interaction modules predicted to be the most discriminating markers of cancer phenotype.

N0, number of times that the state S appeared in normal samples. N1, the number of times it appeared in cancerous samples. H, Calculated Entropy, Prediction Accuracy is calculated applying Leave-one-out cross-validation on SVM classifier (see Materials and Methods for more details).
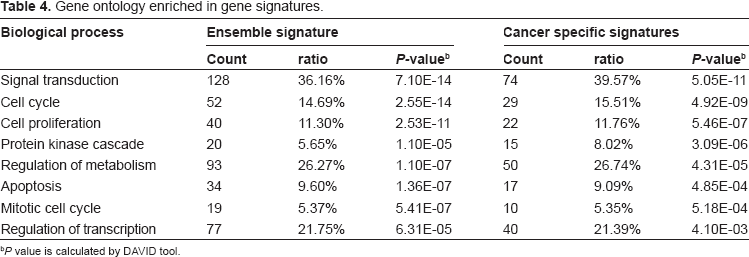
To determine whether these identified gene pairs played a role in the mechanism of tumorigenesis, we further investigated the enriched gene functional categories and pathways, and the genetic association of these informative gene pairs with cancer using the National Cancer Institute (NCI) DAVID tool (http://david.abcc.ncifcrf.gov). A total of 354 genes involved in gene pairs which entropy <0.3 were selected for further analysis. We defined these 354 genes to be the “ensemble signatures”, and the 187 genes that showed a “high-expression” status in cancer samples as the “cancer-specific signatures”.
Of the 354 genes with ensemble signatures, there were 24 (7.1%) that had a genetic association with human cancer, and of the 187 genes with cancer-specific signatures, there were 18 (9.6%) with a similar genetic association (Table 3, gene-disease association is based on The Genetic Association Database, http://geneticassociationdb.nih.gov/). The most enriched gene function according to Gene Ontology function association in all signatures was “signal transduction” (39.6%,
Association of gene signatures with diseases. *

354 genes involved in gene pairs which entropy <0.3 were selected for further analysis using the DAVID tool (http://david.abcc.ncifcrf.gov) which considers the functional assignment of the genes according to the Gene Ontology Index. These genes were defined to be the “ensemble signatures”, and the 187 genes that showed an “high-expression” status in cancer samples were defined as “cancer-specific signatures”.
Enrichment ratio means the percentage of input genes are annotated on given term.
Gene ontology enriched in gene signatures.
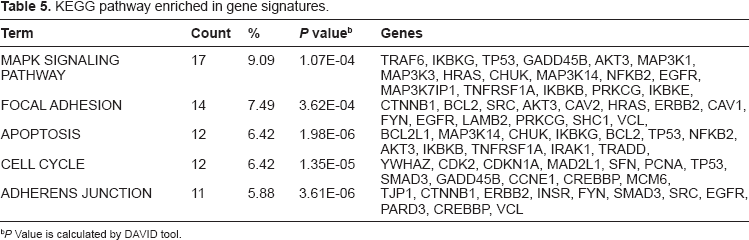
KEGG pathway enriched in gene signatures.
An important advantage of our method is that it might reveal cancer-associated expression pattern of gene pairs involved in particular protein-protein interactions. For example, it is widely accepted that Cav-1 might play an important role in oncogenic transformation and metastasis.
13
Cav-1 normally functions as a tumor suppressor gene candidate and could act as a negative regulator of the Ras-p42/44 MAP kinase cascade..14,15 Here we show that Cav-1 is involved in five gene pairs which is “high-expression” in normal samples (ID = 2, 5, 9, Table 2) and “low-expression” in cancer samples (ID = 15, 16, Table 2). More significantly, the combination of its status with Src or NOS3 (eNOS) could discriminate between cancer and normal phenotypes (Table 6). Src is an oncogene which can down-regulate Cav-1 expression through transcriptional mechanisms..16,17 Our results clearly demonstrated this pattern: “
The status of protein interaction modules lead to cancer phenotype switch.

The idea of extracting synergistic gene pairs for biomarker identification is not new, but our method has several advantages: (1) Interpretability. Compared to methods which search all possible synergistic gene pairs without biological evidence, 18 the cancer signatures identified in the present study are based on protein-protein interactions, which is recognized as the molecular basis of signaling pathways. Furthermore, phenotype discrimination based on protein-protein interactions could contribute to elucidation of the tumorigenesis mechanism. (2) Efficiency. Compared to other global search methods, the use of protein-protein interaction data optimizes exploration of the protein-protein interaction space by focusing on regions which are more likely to yield synergistic gene pairs. (3) Application. Our approach for describing synergistic phenotype discrimination suggests that our method might play a useful role in the identification of combinatory drug targets.
Disclosures
This manuscript has been read and approved by all authors. This paper is unique and is not under consideration by any other publication and has not been published elsewhere. The authors and peer reviewers of this paper report no conflicts of interest. The authors confirm that they have permission to reproduce any copyrighted material.
Footnotes
Acknowledgements
We thank our colleagues for their suggestions on the manuscript. This work was partially supported by the National Natural Science Foundation of China to J.X. (30600759) and the Advanced Space Medico-Engineering Research Project of China to J.X. (01105015, 01104099).