
Abstract
Previous studies reported that the degree of hypoxemia following acute pulmonary thromboembolism (APTE) was highly variable and that its mechanism was mainly due to the creation of many high and low ventilation/perfusion (V/Q) units, as a result of the heterogeneous regional blood flow (Q) caused by embolic obstruction. We studied the effect of changing cardiac output (Qt) on gas exchange after APTE in 5 embolized piglets (23 ± 3 Kg), using Dobutamine intermittently at approximately 20 μg/kg/min for 120 minutes. The distribution of ventilation (V) and perfusion (Q) at various times was mapped using fluorescent microspheres in 941 ± 60 lung regions. After APTE, increase in Qt by Dobutamine improved venous oxygen tension (PvO2) but arterial PaO2 did not change consistently. On the other hand, cluster analysis showed that the V/Q ratio of most lung regions was lowered due to increases in Q at the same time. We concluded that the effect of changing cardiac output on gas exchange following APTE was affected by the simultaneous and varying balance between the changing V/Q mismatch and the concomitantly changing PvO2, which might explain the unpredictability of PaO2 in the clinical setting.
Introduction
Previous clinical studies showed that the degree of hypoxemia following acute pulmonary thromboembolism (APTE) was highly variable (Sasahara et al. 1973) and that it could not be readily predicted by the embolic load alone (Wilson et al. 1971; Jardin et al. 1979). Our recent investigation reported that the worsening of gas exchange after APTE was mainly due to the presence of many high and low ventilation/perfusion (V/Q) units, which were created by the redistribution of regional blood flow, occurring as a result of the vascular obstruction by the thromboemboli (Tsang et al. 2005). Anatomically, blood flow was diverted to the less embolized regions, while in contrary, the regions distal to the heavily embolized regions received less blood flow. Our data were compatible with those from Santolicandro et al. who pioneered in this field using the multiple inert gas elimination technique (MIGET) and showed the importance and varying extent of V/Q mismatch after APTE, at the time of diagnosis among patients and during their subsequent recovery (Santolicandro et al. 1995).
Besides hypoxemia, right heart failure is also a common feature following APTE (McIntyre 1974; Goldhaber 1998). The ensuing shock state is often resuscitated with fluid and inotropic agent such as Dobutamine (Chernow 1988), in order that the cardiac output (Qt) can be restored.
Dobutamine, with its inotropic effect, was used in our current study as a tool to change cardiac output and further test our earlier observations. We set out to study how the changes in pulmonary regional blood flow following Dobutamine infusion might be distributed inside the embolized lung and how such redistribution might affect gas exchange by altering the ventilation to perfusion ratio (V/Q) in different lung regions. Furthermore, there was evidence in the past which suggested that hemody-namic state could affect hypoxemia in other experimental models. Breen et al. reported that increases in cardiac output resulted in worsening venous admixture even in normal lung (Breen et al. 1982), while Tsang et al. observed similar findings in lungs with oleic acid induced pulmonary edema (Tsang et al. 1986). In addition, Jardin et al. proposed that the hemodynamic profile after APTE was an important factor in determining hypoxemia and that a low cardiac output state might result in a misleadingly good arterial oxygenation and vice versa (Jardin et al. 1979).
We hypothesized that the increase in total pulmonary blood flow (or cardiac output) after Dobu-tamine would further lower the V/Q ratio of many areas in the embolized lung due to their higher regional flow (Q), and thus aggravate the overall venous admixture and hypoxemia. Specifically, we sought to examine whether more regional blood flow was diverted to the less embolized regions due to their lower local resistance, thereby further decreasing the V/Q in the already lower V/Q areas. Manier et al. reported that Dobutamine improved oxygen transport but had inconsistent effect on PaO2 (Manier et al. 1992). However, a more detailed explanation of their observation remained to be elucidated.
The recently developed technique using aerosolized and injected fluorescent microspheres (FMS) allowed the simultaneous measurement of regional ventilation and perfusion in the small regions (2 cm3) of the lung (Altemeier et al. 1998 a). The accuracy of this technique was confirmed and well tested over time (Glenny et al. 1993; Robertson et al. 1997). These results were more informative than those from the MIGET studies because of the additional anatomical information on how these V/Q units were related to the site of the emboli. Earlier we have shown that the high V/Q regions were located in the periphery of the lung, where there was reduced flow distal to the thromboemboli, whereas the lower V/Q regions were located in the less embolized areas, due to the higher diverted regional flow (Tsang et al. 2005). In the present study, we used Dobutamine to increase cardiac output in our established porcine model of APTE and used the fluorescent microspheres technique to map out the regional V and regional Q at different times during the experiment. The above methods would allow us to examine directly and simultaneously whether the changes in cardiac output by Dobutamine could adversely affect hypoxemia and observe how ventilation and perfusion were distributed during the treatment.
While our main interest was to investigate the effect of increased cardiac output on gas exchange in APTE, we also recognized the potentially vasodilating properties of Dobutamine (Chernow 1988). The results of our investigation would also allow us to delineate whether vasoconstriction or vasodilatation would also play a role in determining regional blood flow in the lung. Some earlier studies reported that inhaled isoproterenol, another β2 agonist, could aggravate hypoxemia in patients with chronic obstructive lung disease because it attenuated the compensatory mechanism of hypoxic pulmonary vasoconstriction due to its vasoactive effect (Nelson, 1995). On the other hand, Delcroix et al. have shown that hypoxic pulmonary vasoconstriction did not operate to preserve gas exchange after acute pulmonary embolism or at least its role was very limited (Delcroix et al. 1996). A recent study by Pagnamenta et al. reported that Dobutamine at doses up to 10 μg/Kg/min had no flow-independent effect in the pulmonary circulation of the embolized lung (Pagnamenta et al. 2003). Our second goal in this study was to clarify the relative importance of vasoactivity on regional blood flow after APTE.
Methods
Surgical preparations and physiological measurements
The experimental protocol was approved by the University of Washington Animal Care Committee. Five piglets (23 ± 3 Kg) were pre-medicated with ketamine 20 mg/Kg i.m. and xylazine 2 mg/Kg i.m. and a bolus of thiopental sodium (20mg.kg−1) i.v. They were maintained under general anaesthesia for the entire experiment using intravenous pentothal, initially set at 100 mg/hour and the dose was only occasionally titrated afterwards. These animals were ventilated with room air in the supine posture while the tracheostomy and vascular line insertions were completed.
One femoral arterial line and two femoral venous lines were inserted for the purposes of monitoring systemic mean blood pressure (MBP), fluid infusion, and fluorescent micro-spheres (FMS) injection, respectively. A Swan Ganz catheter (Edwards Laboratory, CA) was inserted in the right external jugular vein for the measurement of pulmonary arterial pressure (Ppa), wedge pressure, and cardiac output (Qt) using the thermodilution technique, while a large bore catheter (0.5 cm internal diameter) was inserted in the left external jugular vein for the rapid infusion of pre-formed blood clots (see below). Generally, these animals received normal saline at 100 ml/hr during the experiments. They were kept warm using a warming blanket so that the body temperature was maintained at about 38 °C. No heparin was used.
After the insertion of the femoral arterial line, 80 ml of blood were withdrawn and mixed with 2500 units of Thrombin—JMI at room temperature, so that clots were allowed to form and be fibrinized over the next two hours.
Upon completion of the surgical procedures, the animals were placed in the prone posture and received stacking of at least three consecutive breaths to remove residual atelectasis. Their control ventilatory settings were determined according to the arterial blood gas results, such that arterial carbon dioxide tension (PaCO2) was set at 35 ± 2 Torr, positive end-expiratory pressure was 0 cm of water, tidal volume was 12-15 ml/Kg, respiratory rate was 18 to 20/min and inspired oxygen was at 21% or room air. Once these ventilation parameters were established, there was no further adjustment of these settings for the remaining part of the experiment. At each of the subsequent data collection time points, hemodynamic parameters, such as MBP, Ppa, wedge pressure, heart rate, cardiac output (Qt) were measured, along with hemoglobin, arterial and venous blood gases, Fowler dead space (MacLab at 100 mm/sec), tidal volume, airway pressure and respiratory rate.
The time for the induction of acute pulmonary thromboembolism (APTE) was defined as time = 0 minute and all the events prior to and following that point would be recorded in relation to that time. Two control runs were performed at -30 and -5 minutes prior to APTE in order to establish the animal's physiological condition at base line.
In each experiment, 10 different fluorescent microspheres (FMS) of distinct colors (Molecular Probes, Eugene, OR) were chosen and used in random orders: five for ventilation and five for perfusion. There was only one run of FMS mapping prior to APTE at -30 minutes. Due to the overlapping spectra of different FMS colors (Glenny et al. 1993; Robertson et al. 1997), a maximum of 10 colors was allowed per experiment in order that the most reliable data could be obtained. The details of the FMS aerosolization and injection techniques have been well described (Altemeier et al. 1998 a).
After the control runs were performed and all the physiological measurements were recorded, acute pulmonary thromboembolism (APTE) was induced at time = 0 minute. Approximately 12 to 16 pieces of pre-formed fibrinized clots (roughly 1.5 × 0.5 × 0.5 cm3 per piece) were suspended in normal saline in a large catheter tip syringe and injected into the left external jugular vein over the next 10 to 15 minutes, until Ppa was 2.5 times the baseline value. Upon completion, there were no further injections of clots.
At time = 60 minutes after the induction of APTE, physiological measurements and blood samplings were similarly done as in the control runs, followed by FMS aerosolization and injection using FMS of different colors. This would mark the regional ventilation and perfusion in the early phase following APTE. Gentle stacking of breaths would be routinely done at least 10 minutes prior to data collection at each designated time point to minimize atelectasis.
After obtaining the data at 60 minutes, Dobu-tamine infusion began via a central venous catheter and its dosage was titrated upwards, until the cardiac output was substantially increased to 1.5 to 2.0 times the pre-APTE value at a steady state. Generally, a dose of approximately 15 to 20 μg/Kg/min was sufficient for that purpose. At time = 90 minutes, all the measurements were repeated according to the protocol. Afterwards, Dobutamine was discontinued so that the cardiac output would return to its previous level. Having collected the data at time = 120 minutes, Dobutamine was started a second time and the measurements again done at 150 minutes.
Post mortem lung preparations
At the end of the experiment, the animals were deeply anaesthetized with intravenous pentothal, heparinized with 5000 U and exsanguinated. The lungs were extracted after gentle saline flush, suspended vertically, and inflated to no more than 25 cm of water. The lobes were kept in their resting anatomical position by a small amount of cyanoacrylate glue and blown dry with warm air through the lungs for 72 hours. Small puncture holes were made to allow good airflow through the lungs during the drying process. The injected thromboemboli were not macerated and were readily seen in the major pulmonary arteries.
After the thorough drying of the harvested lungs, they were sectioned into 2 cm3 sized cubes, with each sample carefully assigned a 3 dimensional (3-D) coordinate according to a pre-established grid pattern. Approximately 1000 pieces were analysed per animal (see RESULTS). For each lung sample, its spatial location, weight, amount of airway tissue and the presence or absence of blood clots in arteries >1 mm were recorded.
The fluorescent intensities of all 10 fluorescent microspheres embedded in each sample, which marked the regional V and Q at 5 different time points (i.e. time = -30, 60, 90, 120 and 150 minutes), were measured as previously described (Altemeier et al. 1998 a; Schimmel et al. 2001). Briefly, the florescent signal, which reflected the number of a given microsphere trapped in a lung piece, was determined by measuring its intensity in a spectrofluorimeter (Perkin-Elmer LS-50B), following four days of soaking in 2 ml of organic solvent (Cellosolve, Sigma-Aldrich, MO). Overlaps from adjacent colors were then corrected using a matrix inversion method (Schimmel et al. 2001).
Data Analysis
Physiological data
PaO2 was chosen as the primary variable, since it was the key factor in our hypothesis. Other cardiovascular parameters were considered as secondary variables.
Comparisons among experimental conditions
The difference in each physiological parameter between the pre-APTE state and the mean of the two measurements without Dobutamine in the post embolized state (+60 and +120 minutes) was compared to zero using the one sample t-test. For parameters based on microsphere (FMS) measurements, such as the ventilation/perfusion ratio, the pre-embolized state was represented by the single pre-APTE microsphere administration at -30 minutes. For other physiological parameters, which had measurements at both -30 and -5 minutes, the pre-embolized state was represented by the mean of these two measurements.
For various parameters, the two runs without Dobutamine (Y60 and Y120) were compared to the two runs with Dobutamine (Y90 and Y150). The null hypothesis was that there was no effect of the Dobutamine. The difference between the “Dobutamine” and “no Dobutamine” states was adjusted for a possible linear time trend over the course of the experiment. The adjustment would potentially be needed because each of the measurements with Dobutamine was taken after a measurement without Dobutamine, so that a time trend might induce a spurious Dobutamine effect. We adjusted for a potential time trend by assuming either a linear or a zero change over time. The adjusted difference (Dobutamine minus “no Dobutmaine”) was calculated as {[Y90,D - (Y60 + Y120)/2)] + [Y90,D + Y150,D)/2 - Y120)]}/2. The subscript “D” has been added in the equation to clearly indicate the measurement times under the influence of Dobutamine. The quantity in the equation could be considered as a difference of means, adjusted for a potential time trend. This quantity was compared to zero using a single-sample t-test.
Results were expressed as mean ± standard error (SE) unless indicated otherwise. P < 0.05 was used to designate statistical significance.
Microsphere data
Weight-normalized relative ventilation (WNRV) and perfusion (WNRQ) were calculated for each lung piece in order to permit comparison of relative ventilation and flow distribution among different animals and in different experimental states respectively, i.e. when the total minute ventilation or cardiac output became somewhat different. The steps were presented in our previous paper (Tsang et al. 2005) and briefly summarized in the following. After obtaining the regional V and Q of each lung sample from the FMS data for a given animal and at a given time, the V and Q values were first adjusted by the weight of the sample by dividing V or Q for each piece by the weight of the piece. The weight-adjusted values were then normalized by dividing all of the weight-adjusted values by the grand mean of all weight-adjusted values, separately for V and Q. The lung samples could then be expressed as WNRV and WNRQ, relative to a grand mean of 1.0. Since large airway and blood vessels added substantially to the weight and potential inaccuracy, pieces designated as containing more than 20% large airways/vessels, which, on the average, accounted for less than 10% of the original total number of lung pieces, were omitted from the dataset prior to normalizations and subsequent analyses. In addition to weight-normalized relative ventilation (WNRV) and perfusion (WNRQ), we also used the raw microsphere data to plot the histogram of V/Q distribution at different times during the experiment and calculate the mean V/Q, SD Log V/Q, (which was an estimate of V/Q heterogeneity; see below), and percentages of total flow to different regions.
A value of 50 was assigned to V/Q for lung pieces with V/Q > 50 (usually due to very low flow) in order to include them in our V/Q analysis. By solving the mass balance equation using the obtained regional V/Q and the simultaneous PVO2, the corresponding regional oxygen tension (PRO2) of each lung sample could also be estimated (Altemeier 1998b).
Clustering of lung samples
We allocated the lung samples to three clusters according to the change in WNRQ from time = -30 minutes (prior to APTE) to the first measurement after APTE (at time = 60 minutes). Namely, the three clusters represented were: (a) Cluster 1, which included lung pieces that had an absolute decrease of 0.5 or more in WNRQ from time = -30 minutes to 60 minutes after APTE; Cluster 3, which included lung pieces that had an absolute increase of 0.5 or more in WNRQ from time = -30 minutes to 60 minutes after APTE; and Cluster 2 which included lung pieces in which WNRQ was relatively unchanged and included all the remaining samples. It is important to note that the criteria for these three groups were created a priori. The absolute increase or decrease of 0.5 in WNRQ was chosen because this value would clearly differentiate the three cluster patterns: decreasing, increasing and relatively constant WNRQ.
Since Cluster 3 represented lung regions with higher post-APTE blood flow and presumably lower V/Q, it had potentially the most impact on global hypoxemia after APTE, whereas the contrary was true in Cluster 1. Thus, Cluster 3 warranted more focused attention in our analysis.
Comparisons among experimental conditions
For each of the three clusters, testing of differences in various parameters between experimental conditions was also carried out separately, using statistical procedures indicated above.
Results
Physiological data
Table 1 showed the hemodynamic and blood gas changes during all phases of the experiments. The data showed that, after APTE, there was a significant increase in Ppa (as one would expect from the protocol), while MBP remained comparable afterwards. Dobutamine significantly increased Qt at 90 and 150 minutes due to its inotropic effect, but it did not change Ppa significantly during its infusion, possibly due to additional recruitment of the pulmonary vasculature. After APTE, arterial PaO2 dropped significantly from about 106 Torr to 69 Torr but Dobutamine had no consistent effect on it afterwards. On the other hand, venous oxygen tension (PvO2) increased significantly when Qt was increased, as one would expect in steady state from the Fick's equation.
Hemodynamic and blood gas data.

Values are mean ± S.E. Ppa, pulmonary arterial pressure in mmHg; MBP, mean blood pressure in mmHg, Qt, cardiac output in litres/min; PaO2 arterial oxygen tension in Torr; PaCO2, arterial carbon dioxide tension in Torr; PvO2, venous oxygen tension in Torr. APTE at zero minutes.
P ≤ 0.05 for Dobutamine vs. no Dobutamine, adjusted for potential time trend (see Method).
P ≤ 0.05 for comparisons between pre- APTE and the mean of the post APTE states at 60 and 120 minutes with no Dobutamine infusion.
V/Q distribution
Figure 1 showed the V/Q distributions from the FMS data at different times during one of the experiments. Our results consistently showed that regional V and Q were closely matched prior to APTE, when the vast majority of regions had V/Q ratio near 1. V/Q heterogeneity, estimated as the standard deviation of the main peak, was represented by SD log V/Q. Both mean V/Q and SD log V/Q increased after APTE. Table 2 showed these two parameters, i.e. mean V/Q and SD log V/Q respectively, over the entire course of all the experiments. Mean V/Q remained high after APTE, but it was significantly lower during Dobutamine infusion when the total pulmonary blood flow or Qt was substantially increased. However, V/Q heterogeneity, or SD log V/Q, was relatively unaffected by Dobutamine. It should be noted that while many high and low V/Q units were created after acute embolic injury, physiological shunt, defined as V/Q < 0.01, remained at 0% for all animals. In order to resolve the different implications of the reduced mean V/Q data after Dobutamine (Table 2) and the seemingly unaffected arterial blood gas data (Table 1), we proceeded to examine how V and Q were distributed regionally within the embolized lung.

Frequency polygons of ventilation or blood flow vs. V/Q for one experiment. APTE, acute pulmonary thromboembolism. V weighted indicated the amount of regional ventilation represented by the number of regions. Similarly, Q weighted for the corresponding regional flow.
Mean V/Q and SD log V/Q over time.

P < 0.05 for Dobutamine vs. no Dobutamine, adjusted for potential time trend (see Method).
P < 0.05 for comparisons between pre-APTE (at - 30 minutes) and post APTE states at 60 and 120 minutes.
Cluster analyses
Using cluster analyses as described in the Method section, three subpopulations of lung regions were identified according to three patterns of WNRQ at 60 minutes after APTE, determined a priori. Cluster 1 represented regions in which there was an absolute decrease of 0.5 or more in WNRQ; Cluster 2 represented regions in which WNRQ remained relatively unchanged and Cluster 3 represented regions in which there was an absolute increase of 0.5 or more in WNRQ. After the clusters were selected from the data at 60 minutes, their corresponding WNRQ, WNRV, V/Q and the estimated regional oxygen tension (PRO2) in each of these cluster were calculated for 60, 90, 120 and 150 minutes.
Table 3 showed the number of pieces in each cluster as well as its percentage. Note that in Figure 2, prior to APTE all three clusters received about 30 to 40% of total blood flow, in approximate proportion to the size of that cluster. However, after APTE, Cluster 1 which represented about 34% of all regions in the embolized lung received less than 10% of the blood flow, due to the embolic obstruction in the pulmonary vasculature.
Sample distribution among the three clusters (as number of lung pieces per cluster and in bracket as% of total lung pieces per animal).


Values in means ± SE. The percentage of total blood flow (or cardiac output) in each cluster was plotted over time. The data obtained during Dobutamine infusion was marked within the grey zone. For each cluster there were no statistically significant differences for comparison at times with vs. without Dobutamine after APTE.
On the other hand, Cluster 3, which represented about 28% of the lung regions, received well over 50% of the cardiac output after APTE. Cluster 2 represented about 38% of lung regions and it received consistently about 35% of blood flow throughout. In terms of the percentage of blood flow, Dobutamine did not have any significant altering effect on blood flow patterns in the three clusters after 60 minutes, even when Qt was significantly increased.
Figure 3 showed how WNRQ from these three clusters changed over time. In all three clusters, there was a small time effect as they trended towards the pre-embolized state. However, Dobu-tamine did not have any notable effect on the weight normalized regional flow (WNRQ) of all three clusters.
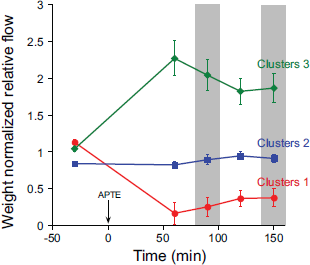
Values in means ± SE. WNRQ, weight normalized regional blood flow. The data obtained during Dobutamine infusion was marked within the grey zone. For each cluster there were no statistically significant differences for comparison at times with vs. without Dobutamine after APTE..
After examining the regional flow pattern after APTE, we were interested to see how the regional ventilation would match in these same clusters. The corresponding WNRV were then calculated and presented in Fig. 4. Cluster 1 that received the least blood flow also had the least regional ventilation and vice versa for Cluster 3. However, Dobutamine also had minimal effect on WNRV in all three clusters once their pattern was established soon after APTE.

Values in means ± SE. WNRV, weight normalized regional ventilation. The data obtained during Dobutamine infusion was marked within the grey zone. For each cluster there were no statistically significant differences for comparison at times with vs. without Dobutamine after APTE.
In order to ascertain how the changes in cardiac output by Dobutamine might affect gas exchange, we calculated the V/Q ratios for all the lung regions at all the time points. Figure 5 showed that Cluster 3 had the lowest V/Q (<1), due to their relatively high WNRQ. It also represented the cluster that had the most impact on arterial oxygenation according to the O2-CO2 diagram, where small decreases in V/Q below 1 could decrease oxygen tension dramatically (West, 1985), while regions with higher V/Q, i.e. Clusters 1 and 2, contributed little to venous admixture but had more impact on regional carbon dioxide tension. Indeed Cluster 1 with the highest V/Q behaved physiologically like dead space. There was considerable scatter of V/Q in Cluster 1 due to the inclusion of some very high V/Q units as they received almost no flow. Dobutamine significantly decreased the V/Q ratio of Cluster 1 at 90 and 150 minutes but these changes had little impact on gas exchange. More importantly, it also significantly decreased the V/Q ratio of Cluster 3. However, the magnitude of this decrease in V/Q ratio (due to higher flow) in Cluster 3 was somewhat mitigated by the concomitant parallel increases in WNRV.

Values in means ± SE. V/Q, ventilation perfusion ratio. The data obtained during Dobutamine infusion was marked within the grey zone. There were significant decreases in V/Q in Clusters 1 and 3 during Dobutamine infusion. *represented P < 0.05 for comparison at times with vs. without Dobutamine after APTE.
When the regional V/Q was known, the corresponding oxygen tension (PRO2) of each region was estimated using the mass equation involving regional V/Q and PVO2 (Alemeier et al. 1998 b). Afterwards, the composite PRO 2 of the three clusters was calculated and plotted over time (Fig. 6). The PRO2 of Cluster 3 was the lowest (as was its V/Q), while the PRO2 of Cluster 1 was the highest. Note that the lower PRO2 of Cluster 3 had the most important physiological impact on gas exchange, not only because of its location in the far left of the O2-CO2 diagram but it also had close to 50% of blood flow. However, the significant reduction of V/Q (Fig. 5) after Dobutamine treatment in Cluster 3 did not result in the significant lowering of PRO2 in that cluster (Fig. 6) and only a trend was observed (P > 0.05). The decrease in the mean V/Q seen in Table 1 was accounted for mostly by the changes in Cluster 1, which had the least impact on gas exchange because of their very high V/Q.

Values in means ± SE. PRO2, estimated regional oxygen tension of each cluster. The data obtained during Dobutamine infusion was marked within the grey zone. For each cluster there were no statistically significant differences for comparison at times with vs. without Dobutamine after APTE.
Finally, in order to estimate for the effect of changing PVO2 as a confounding variable in the estimation of PRO2 while Qt was changed, we calculated two sets of PFMSO2 from the FMS data, which were the estimated composite PO2 in the blood exiting the lung, after taking into account all the PRO2 calculated by the FMS data. One set was labelled as PRAWO2 and one set as PADJO2, in which the former was calculated using the raw real time simultaneous data of PVO2 when Qt was increased by Dobutamine at 90 and 150 minutes, while the latter was calculated using the adjusted data of PVO2 prior to the use of Dobutamine. Both of these parameters were plotted over time and shown in Figure 7. The paired t-test was used to compare PRAWO2 vs PADJO2 at 90 minutes and also at 150 minutes with a Bonferroni correction to reflect the two comparisons being made. PADJO2 was significantly lower than PRAWO2 at both time points.
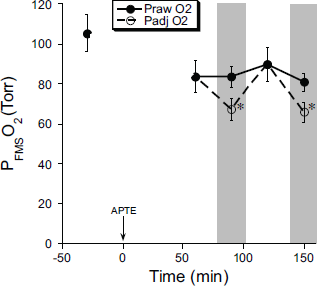
Values in means ± SE. PFMSO2, estimated arterial oxygen tension from the fluorescent microsphere (FMS) data; PRAWO2, estimated regional oxygen tension using FMS data and real time PVO2; PADJO2, estimated regional oxygen tension at 90 and 150 minutes, using FMS data and PVO2 prior to Dobutamine infusion. The data obtained during Dobutamine infusion was marked within the grey zone. *represented P < 0.05 for paired comparison of PRAWO2 and PADJO2, separately at 90 and 150 minutes.
Discussion
The purpose of our study was to investigate how changing hemodynamics might affect hypoxemia following acute pulmonary thromboembolism (APTE), which was also found to be highly variable in the clinical setting (Sasahara et al. 1973; Jardin et al. 1979). Several previous investigators, who pioneered in this area using the MIGET method, found inconsistent relationship between arterial oxygenation and cardiac output but did not have a more detailed explanation (Manier et al. 1992). In the present study, we specifically studied the mechanisms on how regional pulmonary blood flow was distributed inside the embolized lung when the cardiac output was intermittently altered, in an attempt to elucidate the underlying patho-physiology. Our data showed that even though the overall V/Q of the embolized lung was reduced when cardiac output was increased, PaO2 indeed varied and was inconsistently affected. With the fluorescent microsphere data, we endeavoured to offer some insights.
Upon further analyses of our results, we proposed that there were four factors that could resolve the apparent contradiction between the lowering of V/Q on the one hand, and the lack of consistent change in PaO2 on the other, when cardiac output was fluctuating after APTE.
Firstly, in spite of the increased total pulmonary blood flow during the Dobutamine, there was no increase in the heterogeneity of regional blood flow in the embolized lung (Table 2), i.e. SD log V/Q did not change significantly. Without the increased scattering of regional blood flow, V/Q mismatch would be less likely to be aggravated. The data also confirmed that the reproducible pattern of blood flow after APTE was mainly due to the mechanical obstruction by the thromboemboli, which determined essentially all the local vascular resistance. Comparatively speaking, the β2 agonistic effect of Dobutamine on gas exchange was small, because no further increase in the heterogeneity of blood flow was observed, namely there was no disproportionate diversion of regional blood flow to the already lower V/Q regions due to vasodilatation. Our results were compatible with those by Delcroix et al., who reported that vasodilators had minimal effect on oxygenation after APTE (Delcroix et al. 1990). Later, they also demonstrated that hypoxic pulmonary vasoconstriction played a minimal role in the preservation of gas exchange after APTE (Delcroix et al. 1996). Furthermore, Pagnamenta et al. found that Dobutamine had no flow-independent effect on the pulmonary circulation of the embolized lung (Pagnamenta et al. 2003). Finally, we recently reported that Tezosentan, a non-specific endothelin antagonist, did not affect V/Q distribution following APTE (Tsang et al. 2007).
Secondly, the corresponding WNRV changed in the same direction as WNRQ in all three clusters (Figs. 3 and 4). In Cluster 3, where WNRQ was higher in the less embolized part of the lung, its WNRV was also found to be higher. Consequently, the decrease in V/Q in this cluster due to higher flow (Q) was mitigated by the concomitant increase in regional ventilation (V). The mild shifts in regional ventilation (WNRV) between the three clusters in relation to their regional blood flow (WNRQ) could be explained by the mechanism of hypocapneic bronchoconstriction, proposed earlier by Levy et al. (Levy et al. 1974). These small shifts in ventilation in the high V/Q regions could attenuate significantly the V/Q heterogeneity due to the low denominator in Q. SD Log V/Q increased immediately after APTE but did not disperse further after Dobutamine to reach statistical significance, once its pattern was established before 60 minutes.
Thirdly, most of the reduction of mean V/Q (Table 2) was accounted for by the decrease in V/Q in Cluster 1, in which the V/Q immediately after APTE was the highest. Its change to about half of its value after Dobutamine treatment did not result in significant changes in the corresponding PRO2 because of these higher V/Q values. Even when reduced in halves, these high V/Q values would not lead to much lowering of PRO2 according to their V/Q positions in the far right of the O2-CO2 diagram (West, 1985), where carbon dioxide tension were more prone to change than oxygen tension. Furthermore, at these higher levels of oxygen tension, oxygen content will not increase much more due to the characteristics of the oxygen-hemoglobin dissociation curve. Cluster 1 behaved like dead space which had little impact on oxygenation. It also received the smallest share of pulmonary blood flow.
On the other hand, in terms of its influence on the overall mean V/Q (Table 2), any change of V/Q in Cluster 3 in absolute term would be quite modest because of their lower values. Consequently, its effect on the mean V/Q of the entire lung was understandably small. Furthermore, its decrease of V/Q due to higher flow after Dobutamine treatment, though significant (Fig. 5), was attenuated by the concomitant increase in WNRV mentioned above (Fig. 4). However, statistical significant difference in PRO2 from Cluster 3 was not achieved when the cardiac output was increased (Fig. 6). We thought that the reason laid in the confounding factor of PvO2.
As one would expect from the Fick equation, we observed that PvO2 concomitantly increased with increased cardiac output (Table 1). Given the same V/Q distribution in an injured lung, a higher PvO2 could significantly improve PaO2. Our calculation of PRO2 involved an equation in which PvO2 was a parameter (Altemeir et al. 1998 b). In order to test the importance of PvO2 in determining PaO2 we first estimated the overall arterial oxygen tension from the FMS data, using the raw simultaneous data of PvO2 obtained in real time (PRAWO2 in Fig. 7). Then we estimated another theoretical arterial oxygen tension from the FMS data, using instead an adjusted lower PvO2 value measured prior to the use of Dobutamine (PADJO2 in Fig. 7). Statistical analysis revealed that there was a significant difference between them, when PvO2 was artificially kept constant. Thus, taking into account of the confounding effect of increased PvO2 during Dobutamine infusion, along with the attenuated decrease in V/Q in Cluster 3 (due to the simultaneous increase in WNRV), PRO2 within this important cluster was not consistently affected when the hemodynamics was changed.
From these data, we speculated on the reasons that explained the high degree of variability of arterial oxygen tension (PaO2) in the clinical setting of APTE (Sasahara et al. 1973; Jardin et al. 1979). It appeared that the different patterns of hemodynamic changes after APTE among patients, which could range from obstructive shock to hyperdynamic response due to increases in sympathetic tone, might affect their PvO2 very differently. Thus, the interactions of so many independent and sometimes conflicting variables, such as the different cardiovascular response or PvO2, the varying locations or the sizes of the emboli, which could divert flows in erratic ways, could render the subsequent PaO2 almost impossible to predict. These factors might therefore explain the relatively poor correlation between the PaO2 and the embolic load among many patients with APTE (Wilson et al. 1971). In this latter clinical study, cardiac index among patients was found to vary greatly.
In our opinion, mechanical diversion of blood flow from the clots in the pulmonary vasculature is the main determinant of V/Q distribution in the embolized lung. Hopefully this paper illustrates some of the relevant pulmonary and cardiovascular mechanisms that may explain the high variability of PaO2 after APTE, which has puzzled clinicians for many years. We conclude that the unpredictable effect of changing cardiac output on gas exchange following APTE is due to the simultaneous and varying balance between the subsequent changing V/Q mismatch and the concomitantly changing PvO2 Direct evidence on vasoactive factors determinining gas exchange following APTE remains scarce. Finally, the existence of any intrapulmonary shunt may potentially be a factor (Lovering et al. 2007) but its importance has yet to be fully established in the embolized lung.
Footnotes
Acknowledgement
The authors thank the funding support from the British Columbia Lung Association and National Heart, Lung, and Blood Institute Grant HL-69868. Furthermore, they express their sincere appreciation for the technical assistance from Sucheol Gil.