
Abstract
Background
Alzheimer's disease (AD) is the most common cause of dementia with no curative therapy currently available. Establishment of sensitive and non-invasive biomarkers that promote an early diagnosis of AD is crucial for the effective administration of disease-modifying drugs. MicroRNAs (miRNAs) mediate posttranscriptional repression of numerous target genes. Aberrant regulation of miRNA expression is implicated in AD pathogenesis, and circulating miRNAs serve as potential biomarkers for AD. However, data analysis of numerous AD-specific miRNAs derived from small RNA-sequencing (RNA-Seq) is most often laborious.
Methods
To identify circulating miRNA biomarkers for AD, we reanalyzed a publicly available small RNA-Seq dataset, composed of blood samples derived from 48 AD patients and 22 normal control (NC) subjects, by a simple web-based miRNA data analysis pipeline that combines omiRas and DIANA miRPath.
Results
By using omiRas, we identified 27 miRNAs expressed differentially between both groups, including upregulation in AD of miR-26b-3p, miR-28–3p, miR-30c-5p, miR-30d-5p, miR-148b-5p, miR-151a-3p, miR-186–5p, miR-425–5p, miR-550a-5p, miR-1468, miR-4781–3p, miR-5001–3p, and miR-6513–3p and downregulation in AD of let-7a-5p, let-7e-5p, let-7f-5p, let-7g-5p, miR-15a-5p, miR-17–3p, miR-29b-3p, miR-98–5p, miR-144–5p, miR-148a-3p, miR-502–3p, miR-660–5p, miR-1294, and miR-3200–3p. DIANA miRPath indicated that miRNA-regulated pathways potentially down– regulated in AD are linked with neuronal synaptic functions, while those upregulated in AD are implicated in cell survival and cellular communication.
Conclusions
The simple web-based miRNA data analysis pipeline helps us to effortlessly identify candidates for miRNA biomarkers and pathways of AD from the complex small RNA–Seq data.
Introduction
Alzheimer's disease (AD) is the most common cause of dementia affecting 36 million people worldwide, showing the hallmark pathology of amyloid-β (Aβ) deposition, neurofibrillary tangle (NFT) formation, extensive synaptic loss, and neurodegeneration in the brain. 1 The complex interaction between multiple genetic and environmental factors affecting various molecular pathways plays a key role in AD, although the precise molecular mechanism remains largely unknown. 2 Currently, only four drugs with limited efficacies are available for the treatment of AD, including donepezil, rivastigmine, galantamine, and memantine. Development of disease-modifying drugs for AD, mainly targeting Aβ, has been unsuccessful, suggesting that both early diagnosis and early treatment are highly important to achieve maximal response to disease-modifying treatments. 3 However, an accurate diagnosis of AD is often difficult, solely based on neuropsychological examinations, because the possibility of numerous dementing diseases, such as frontotemporal dementia (FTD), dementia with Lewy bodies (DLB), vascular dementia, HIV-associated dementia (HAD), and prion diseases, should be carefully excluded. 4 Although decreased Aβ42 and increased pTau levels in the cerebrospinal fluid (CSF) serve as a biomarker for the diagnosis of AD, the collection of CSF is too invasive to apply to routine clinical works. 5 Therefore, establishment of most reliable, non-invasive, ultrasensitive, high-throughput, and inexpensive biomarkers that promote the early diagnosis of AD would meet a growing demand from the public. 6
MicroRNAs (miRNAs), a class of endogenous small non-coding RNAs (ncRNAs), mediate posttranscriptional regulation of protein-coding genes by binding to the 3
Increasing evidence indicated that various miRNAs, released extracellularly to biological fluids, serve as novel biomarkers for diagnosis and prediction of prognosis of AD, Parkinson's disease (PD), and cancers.10,14,15 They circulate in the serum, plasma, urine and the CSF in a free form binding to RNA-binding proteins or in an encapsulated form within exosomes protected from endogenous RNase activity. Approximately 70% of presently identified miRNAs are expressed in the brain in a spatially and temporally controlled manner. 16 Certain brain-enriched miRNAs are transported through the blood-brain barrier (BBB) into the circulatory system via unknown mechanisms. 14
The recent breakthrough in deep sequencing technology has made a great impact on the field of genome research. Whole RNA-sequencing (RNA-Seq) represents an innovative tool for the genome-wide transcriptome profiling in a high-throughput and quantitative manner with excellent reproducibility. 17 It identifies the unbiased expression of the complex transcriptome, composed of both mRNAs and ncRNAs, even in a single cell at a single base resolution. Small RNA-Seq, one of RNA-Seq applications, analyzes the differential expression of all kinds of small ncRNAs, without prior assumptions inevitable in quantitative PCR (qPCR) assays. Furthermore, this technology overcomes several drawbacks intrinsic to the microarray-based approach, such as the difficulty in detection of novel miRNAs and high backgrounds because of cross hybridization. Actually, it provides a powerful approach to the comprehensive profiling of miRNAs circulating in biological fluids of AD. 14 However, at present, it is most often laborious to clarify biological implications from billions of sequencing read data.
To identify circulating miRNA biomarkers for AD, we studied a publicly available small RNA-Seq dataset, composed of blood miRNA profiles derived from AD patients and normal control (NC) subjects. 18 For this purpose, we established a simple web-based miRNA data analysis pipeline that combines omiRas 19 and DIANA miRPath. 20 We found that this pipeline helps us to effortlessly identify candidates for miRNA biomarkers and pathways of AD from the complex small RNA-Seq data.
Methods
miRNA-Seq dataset of blood samples of AD patients and NCs
First, we retrieved FASTQ-formatted files of a small RNA-Seq dataset from the DDBJ Sequence Read Archive (DRA) (trace.ddbj.nig.ac.jp/DRASearch) under the accession number of SRP022043. The researchers in Saarland University, Homburg, Germany carried out a study of original experiments. 18 It included 48 samples of AD patients, composed of 23 males and 25 females with average age 70.3 ± 7.9 years and Mini-Mental State Examination (MMSE) score 18.7 ± 3.5, along with 22 samples of NC subjects, composed of 11 males and 11 females with average age 67.1 ± 7.5 years and MMSE score 29.3 ± 1.2. They obtained the samples mostly from the Biorepository and Tissue Bank PrecisionMed (www.precisionmed.com). Total RNA including miRNA was isolated from the blood by the PAXgene Blood miRNA Kit (Qiagen, Valencia, CA, USA). A total of 200 ng of RNA was processed to generate multiplexed sequencing libraries by using the TruSeq Small RNA Sample Kit (Illumina, San Diego, CA, USA). Then, DNA library products with the size of ~50 bp were processed for single-end sequencing on HiSeq 2000 (Illumina).
miRNA-Seq data analysis by omiRas
After removing adapters, poly-A tails, and low-quality reads from the original sequencing data with cutadapt (code.google.com/p/cutadapt) and Qcleaner (Amelieff, Tokyo, Japan), we imported GZIP-compressed FASTQ files of cleaned data into the analysis tool named omiRas (tools.genxpro.net/omiras), a free web server established for differential expression analysis of miRNA-Seq data between two groups. 19 On omiRas, bowtie processed mapping of short reads of each library, which are summarized to tags in a quantified FASTA format, on the human genome reference sequence hg19, allowing at most two mismatches. Mapping locus annotations were given for each tag, based on information derived from miRbase v19 (www.mirbase.org), snoRNABase (www-snorna.biotoul.fr), Repbase (www.gir-inst.org/repbase), Genomic tRNA database (gtrnadb.ucsc.edu), and Rfam (www.sanger.ac.uk/resources/databases/rfam.html). Following normalization of the number of reads for each tag with the number of mapping loci, differential expression analysis was carried out between two groups for each miRNA according to the DESeq algorithm (bioconductor.org/packages/release/bioc/html/DESeq.html) in the setting of false discovery rate (FDR)-corrected P-value <0.05. 21 We excluded tRNAs, rRNAs, scRNAs, snoRNAs, and precursor miRNAs because of lack of the precise annotation of their targets. We also removed mature miRNAs showing normalized counts less than 10 in both groups because of their lower expression levels.
Receiver operating characteristic (ROC) analysis was performed by using SPSS Version 19 (IBM Japan). We imported normalized counts of individual miRNAs in the setting of the group discrimination number 1 for AD and 0 for NC. For ROC analysis of the entire panel of 27 miRNAs, comprising a mixture of upregulated and downregulated classes, we converted normalized counts into applicable values as follows: for miRNAs upregulated in AD, the summation of individual counts for each miRNA was adjusted to 1. For miRNAs downregulated in AD, the summation of individual counts subtracted from total counts was adjusted to 1. Finally, all adjusted values for each miRNA in individual samples were integrated for ROC analysis.
Pathway analysis of miRNA targets by DIANA miRPath
We utilized DIANA miRPath v2.0 (diana.imis.athena-innovation.gr/DianaTools/index.php?r=mirpath/index), a web server established for identification of Kyoto Encyclopedia of Genes and Genomes (KEGG) pathways corresponding to the networks of miRNA targets by superimposing numerous miRNA-target relationships on the merging and meta-analysis algorithm. 20 This program predicts miRNA targets with high accuracy based on the DIANA-microT-CDS algorithm that considers the evolutional conservation of miRNA-binding sites. KEGG (www.genome.jp/kegg/kegg_ja.html) is a publicly accessible knowledgebase, composed of manually curated 364,925 pathways that cover a wide range of metabolic, genetic, environmental, and cellular processes and human diseases. 22
We also utilized the interaction network tool of omiRas for identification of miRNA targets. It extracted overlapping targets for miRNAs predicted by five distinct algorithms, such as miRanda (www.microrna.org/microrna/home.do), TargetScan (www.targetscan.org), PicTar (pictar.mdc-berlin.de), miRDB (mirdb.org/miRDB), and PITA (genie.weizmann.ac.il/pubs/mir07/mir07_prediction.html). We imported them into the functional annotation tool of Database for Annotation, Visualization and Integrated Discovery (DAVID) v6.7 (david.abcc.ncifcrf.gov). 23 DAVID identified gene ontology (GO) terms enriched in the set of imported genes and extracted relevant pathways constructed by KEGG, followed by statistical evaluation with the modified Fisher's exact test and the correction by multiple comparison tests. We considered P-value <0.05 after Bonferroni correction as significant.
We also imported the set of miRNA targets into the core analysis tool of ingenuity pathway analysis (IPA) (Ingenuity Systems) (www.ingenuity.com). IPA is a commercial knowledgebase, comprising approximately 3,000,000 biological and chemical interactions with definite scientific evidence. By uploading the list of Gene IDs, the network-generation algorithm identified focused genes integrated in global molecular pathways and networks. IPA calculated the score P-value that reflects the statistical significance of association between the genes and the pathways and networks by Fisher's exact test. We considered P-value <0.05 as significant. The present study complied with the principles of the Declaration of Helsinki.
Results
miRNA-Seq data analysis by omiRas identified miRNAs differentially expressed between AD and NC
By analyzing miRNA–Seq dataset of blood samples derived from 48 AD patients and 22 NC subjects with omiRas, we identified totally 27 differentially expressed mature miRNAs that satisfied FDR–corrected P–value <0.05 (Table 1). The omiRas quality control (QC) tool validated the acceptable quality of length and mapping of sequencing reads, presenting with a discernible correlation in the miRNA expression levels between both groups (Supplementary Fig. 1). Te set of 27 miRNAs included 13 miRNAs upregulated in AD, such as miR-26b–3p, miR-28–3p, miR-30c–5p, miR-30d–5p, miR-148b–5p, miR-151a–3p, miR-186–5p, miR-425–5p, miR-550a–5p, miR-1468, miR-4781–3p, miR-5001–3p, and miR-6513–3p, and 14 miRNAs downregulated in AD, such as let–7a–5p, let–7e–5p, let-7f-5p, let-7g-5p, miR-15a-5p, miR-17–3p, miR-29b-3p, miR-98–5p, miR-144–5p, miR-148a-3p, miR-502–3p, miR-660–5p, miR-1294, and miR-3200–3p (Table 1).

HCA of 27 miRNAs differentially expressed in blood of AD and NC. miRNA-Seq dataset of blood samples derived from 48 AD patients and 22 NC subjects was analyzed on omiRas. It identified 27 differentially expressed mature miRNAs between two groups. They separated several AD subgroups (red) from NC clusters (blue), where the largest AD cluster included 23 patients (47.9%).
The set of 27 differentially expressed microRNAs in blood samples of AD patients and NC subjects.
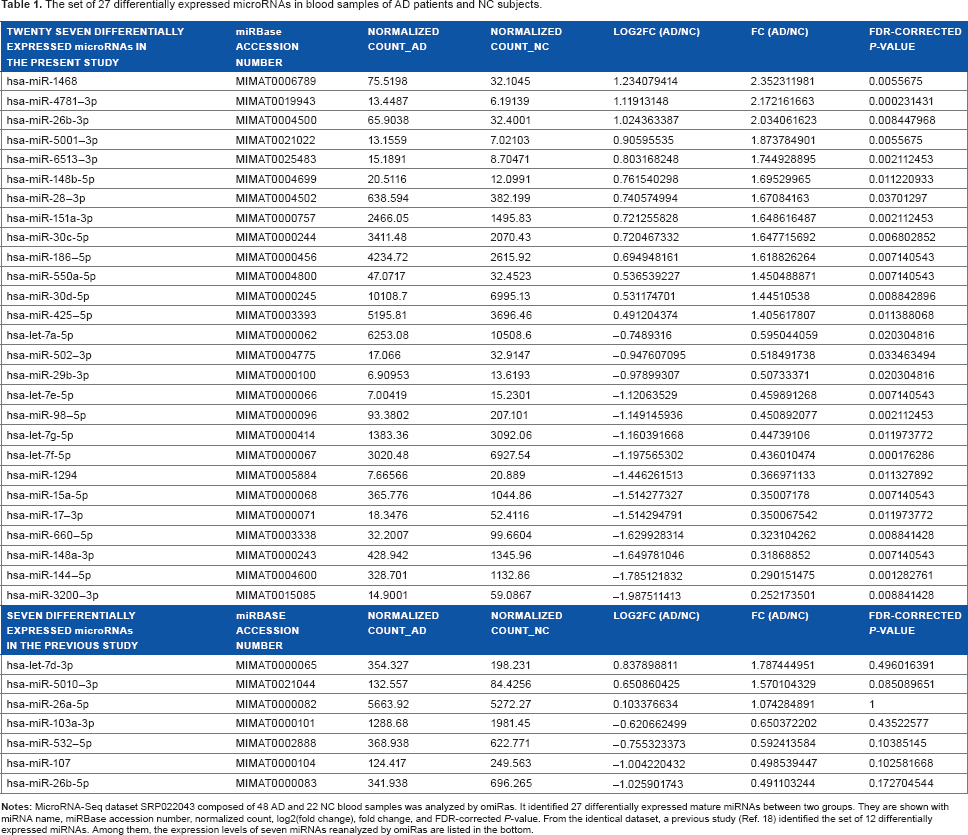
From the identical dataset, a previous study of original experiments identified the set of 12 miRNAs differentially expressed between AD and NC groups. 18 The panel included seven miRNAs upregulated in AD, such as let–7d–3p, miR-26a–5p, brain-miR–112, miR-151a–3p, brain-miR–161, miR-1285–5p, and miR-5010–3p, and five miRNAs downregulated in AD, such as let-7f-5p, miR-26b-5p, miR-103a-3p, miR-107, and miR-532–5p. Unexpectedly, only upregulation of miR-151a-3p and downregulation of let-7f-5p in AD were shared between the present and previous observations. Therefore, we reevaluated by omiRas the expression levels of previously reported seven miRNAs, such as let-7d-3p, miR-26a-5p, miR-26b–5p, miR-103a–3p, miR-107, miR-532–5p, and miR-5010–3p. Surprisingly, we found that the differential expression of none of them reached the levels of statistical significance (Table 1).
By hierarchical clustering analysis (HCA) with omiRas, the set of 27 miRNAs separated several AD subgroups from NC clusters, where the largest AD cluster contained 23 patients (47.9%) (Fig. 1). Thus, the 27 miRNA panel did not perfectly discriminate AD from NC on HCA. The expression profiles of individual 27 miRNAs were different between both groups, although the expression levels were highly variable among each sample (Fig. 2A–F and Supplementary Figs. 2 and 3).

The expression profile of miRNAs differentially expressed in blood of AD and NC. By omiRas, we identified the set of 27 miRNAs differentially expressed in blood samples of AD (blue) and NC (red). The representative profiles of (

ROC analysis of miRNAs differentially expressed in blood of AD and NC. By omiRas, we identified the set of 27 miRNAs differentially expressed between AD and NC blood samples. ROC analysis was performed by importing normalized counts of individual miRNAs into SPSS in the setting of the group discrimination number 1 for AD and 0 for NC, where 1 is defined as a state variable for miRNAs upregulated in AD. The representative profiles of (
By ROC analysis, the set of differentially expressed miRNAs, except for let-7e-5p and miR-29b-3p, showed statistically significant levels of the sensitivity and the specificity for discrimination between AD and NC (Fig. 3A–C and Supplementary Figs. 4 and 5). ROC analysis of the entire 27 miRNA panel revealed the area under the curve (AUC) = 0.801 (P = 0.00006) with the sensitivity = 70.8% and the specificity = 81.8% for discrimination of both groups (Fig. 3D).

DIANA miRPath analysis of target genes for miRNAs upregulated in AD blood. The set of 13 miRNAs upregulated in AD, except for hsa–miR– 6513–3p whose information is absent in DIANA–microT, was imported into DIANA miRPath. It identified the second–rank significant KEGG pathway potentially downregulated in AD, termed long-term potentiation (hsa04720), relevant to target gene network for imported miRNAs. The genes targeted by more than one miRNA are colored by orange, while the genes targeted by a single miRNA are colored by yellow.
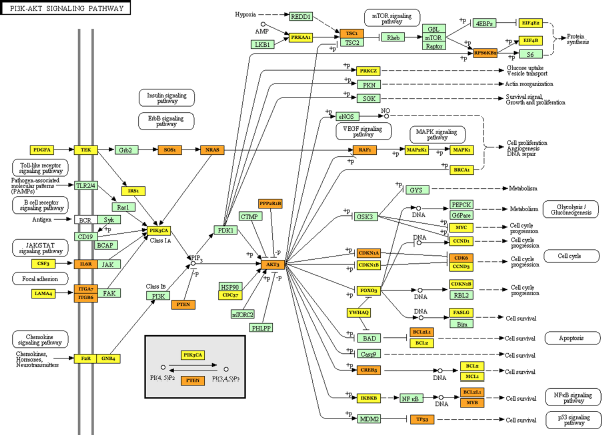
DIANA miRPath analysis of target genes for miRNAs downregulated in AD blood. The set of 14 miRNAs downregulated in AD was imported into DIANA miRPath. It identified the most significant KEGG pathway potentially upregulated in AD, termed PI3K–Akt signaling pathway (hsa04151), relevant to target gene network for imported miRNAs. The genes targeted by more than one miRNA are colored by orange, while the genes targeted by a single miRNA are colored by yellow.
Pathway analysis by DIANA miRPath characterized biological pathways of miRNA targets differentially expressed between AD and NC
By DIANA miRPath, we identified KEGG biological pathways constructed by predicted targets for differentially expressed miRNAs based on the DIANA-microT-CDS algorithm. For the set of 13 miRNAs upregulated in AD, without the inclusion of miR-6513–3p whose information is absent in DIANA-microT, it identified top three most significant pathways potentially downregulated in AD, such as dopaminergic synapse (hsa04728) (P = 2.100E
Top 10 KEGG pathways of target genes for microRNAs differentially expressed in blood samples of AD patients and NC subjects.

To verify these results, we studied miRNA targets overlapping in the prediction by miRanda, TargetScan, Pic– Tar, miRDB, and PITA on the interaction network tool of omiRas. We identified the set of 749 target genes for miRNAs upregulated in AD, including those for miR-30c-5p, miR-30d-5p, miR-186–5p, and miR-425–5p, and the set of 829 target genes for miRNAs downregulated in AD, including those for let-7a-5p, let-7g-5p, let-7e-5p, let-7f-5p, miR-15a-5p, miR-29b-3p, miR-98a-5p, and miR-148a-3p (Supplementary Table 1). Overlaps were not found for other miRNAs by the prediction on five distinct algorithms described above.
For the set of 749 targets potentially downregulated in AD, DAVID indicated their relevance to the KEGG pathway termed long–term potentiation (hsa042720) (P= 0.00774 corrected by Bonferroni), while IPA showed the most significant relationship with the canonical pathways defined as axonal guidance signaling (P = 6.37E – 06) and synaptic long-term potentiation (P = 4.53E – 05). Thus, they are well consistent with the pathway-finding results of DIANA miRPath. For the set of 829 targets potentially upregulated in AD, DAVID revealed their relevance to the KEGG pathways termed focal adhesion (hsa04510) (P = 7.793E – 06 corrected by Bonferroni) and ECM–receptor interaction (hsa04512) (P = 9.082E
Discussion
Utility of the miRNA-Seq data analysis pipeline for identification of AD blood biomarkers
Increasing evidence indicates that miRNAs circulating in biological fluids serve as non-invasive biomarkers for diagnosis of AD. 14 Recently, small RNA-Seq has been utilized as a powerful approach to the comprehensive profiling of disease-relevant circulating miRNAs. However, it is most often laborious to clarify biological implications from billions of sequencing read data. Here, we established a simple web-based miRNA data analysis pipeline by combining omiRas and DIANA miRPath that effortlessly identifies candidates for miRNA biomarkers and pathways of AD from the complex small RNA-Seq data. We applied this pipeline to a publicly available small RNA-Seq dataset, comprising blood samples derived from 48 AD patients and 22 NC subjects.
First, we identified 27 differentially expressed miRNAs between both groups. They included upregulation in AD of miR26b-3p, miR-28–3p, miR-30c-5p, miR-30d-5p, miR-148b-5p, miR-151a-3p, miR-186–5p, miR-425–5p, miR-550a-5p, miR-1468, miR-4781–3p, miR-5001–3p, and miR-6513–3p and downregulation in AD of let-7a-5p, let-7e-5p, let-7f-5p, let– 7g-5p, miR-15a-5p, miR-17–3p, miR-29b-3p, miR-98–5p, miR-144–5p, miR-148a-3p, miR-502–3p, miR-660–5p, miR-1294, and miR-3200–3p. Among them, previous studies reported downregulation of miR-29b targeting BACE1 in the anterior temporal cortex and the serum of AD,24,25 downregulation of miR-148a-3p in the parietal lobe of AD, 26 and upregulation of miR-186–5p in the prefrontal cortex of AD. 27 ROC analysis indicated that discrimination between AD and NC on the entire 27 miRNA panel satisfies the accuracy over 80%.
Next, we characterized miRNA-regulated pathways deregulated in AD blood. We found that the pathways potentially downregulated in AD are linked with neuronal synaptic functions, such as dopaminergic synapse and long-term potentiation, while those upregulated in AD are implicated in cell survival and cellular communication, such as PI3K–Akt signaling pathway, ECM–receptor interaction, and focal adhesion. Notably, it takes only a couple of days to accomplish all analyses online on a PC with standard specifications, suggesting that the pipeline process seems less time consuming. Even though the gold standard for small RNA-Seq data analysis has not been presently established, our pipeline potentially applicable to large–scale deep sequencing data, including those of familial AD patients, would serve as a general standard for AD biomarker mining.
Possible explanations for the discrepancy between the present and previous studies
The previous study of original small RNA–Seq experiments identified the set of 12 miRNAs, containing two unannotated ones, differentially expressed between AD and NC blood samples. 18 They also verified the results by qPCR on a larger cohort composed of 202 samples, containing those derived from 94 AD patients, 21 NC subjects, and 87 patients with other neuropsychiatric diseases. They found that the discrimination of AD from other neuropsychiatric diseases is possible with 74–78% accuracy.
However, only 2 of the 12 miRNAs, such as upregula– tion of miR-151a-3p and downregulation of let-7f-5p in AD, were reproduced between the present and previous observations, regardless of the identical dataset employed. Importantly, omiRas indicated that differential expression of let–7d-3p, miR-26a–5p, miR-26b–5p, miR-103a–3p, miR-107, miR-532–5p, and miR-5010–3p reported previously does not reach the levels of statistical significance (Table 1, the bottom). Since the corresponding qPCR dataset is publicly unavailable, we could not currently clarify the precise reason for the inconsistency between both by reanalyzing qPCR data.
We suggested the possibility that these discrepancies are attributable to differences in data processing, including the methods of cleaning raw data of Illumina short reads, ie, cut– adapt and Qcleaner in the present study versus fastx clipper in the previous study and mapping loci annotations based on miRbase v19 in the present study versus miRbase v18 in the previous study or the methods of statistical analysis utilized to identify differentially expressed miRNAs, such as DESeq in the present study versus the Wilcoxon-Mann–Whitney test with Benjamini–Hochberg adjustment in the previous study.
The study that includes independent cohorts of large numbers of AD patients and controls is required for validation of the 27 blood miRNA signatures in AD we identified. It is worthy of note that omiRas successfully identified previously overlooked 19 miRNAs differentially expressed in the prefrontal cortex between Huntington's disease (HD) patients and controls. 28
Previous studies identified variable profiles of circulating miRNAs in AD
Accumulating studies indicated that expression profiles of circulating miRNAs are highly variable among the patients with AD, patients with mild cognitive impairment (MCI), and NC subjects.29–33 The lack of reproducibility is mostly attributable to great variations in samples, ie, the plasma, serum, whole blood, and exosomes, affected by sampling time and confounding factors such as smoking and medications; study populations, ie, the stage of diseases, age, sex, ethnicity, the selection of adequate controls, and the size of study population to obtain sufficient statistical power; and analytical methods, ie, qPCR, microarray, and the most advanced technology of deep sequencing. Our observations suggested that data processing pipelines contribute to one of major factors greatly affecting the results.
A recent study by qPCR of the plasma miRNAs isolated from 50 AD and 50 NC subjects showed that both the miR-132 family composed of miR-128, miR-132, and miR-874 and the miR-134 family composed of miR-134, miR-323–3p, and miR-382, all of which are upregulated in MCI, differentiate MCI from NC with 87–96% accuracy. 29 In contrast, another study by qPCR of the plasma miRNAs derived from 110 AD patients and 123 NC subjects indicated that the levels of miR-34c, which represses the genes involved in cell survival and anti-oxidative defense, are upregulated in AD. 30 A previous study was performed by microarray analysis of miRNAs isolated from the commercially available plasma derived from 11 AD patients and 20 NC subjects on nCounter containing features of approximately 700 human and human–associated viral miRNAs. 31 It showed that the 7-miRNA signature, composed of let-7d-5p, let-7g-5p, miR-15b-5p, miR-142-3p, miR-191-5p, miR-301a-3p, and miR-545-3p, all of which are downregulated in AD, discriminates AD from NC with greater than 95% accuracy, where the miRNA targets are involved in lipid metabolism. However, among them, we only verified downregulation of let-7g-5p in the miRNA-Seq dataset of AD blood.
A recent small RNA–Seq study performed on an Ion Personal Genome Machine using exosomal miRNAs isolated from 23 AD patients and 23 NC subjects showed that miR-15a-5p, miR-18b-5p, miR-20a-5p, miR-30e-5p, miR-93–5p, miR-101–3p, miR-106a-5p, miR-106b-5p, miR-143–3p, miR-335–5p, miR-361–5p, miR-424–5p, miR-582–5p, and miR-3065–5p are upregulated, while miR-15b-3p, miR-342–3p, and miR-1306–5p are downregulated in AD. 32 Surprisingly, these observations partially contradicted our results that miR– 15a–5p is downregulated in AD blood, suggesting that the source of miRNAs, either purified exosomes or unfractionated whole blood, serves as a critical factor responsible for differences in miRNA expression profiles. A different small RNA-Seq study performed on HiSeq 2000 using the serum miRNAs derived from 50 AD patients and 50 NC subjects revealed that the expression levels of let-7d-5p, miR-98–5p, miR-191–5p, miR-342–3p, miR-483–3p, and miR-885–5p are reduced in AD. 33 They also found a trend for upregulation of miR-26b-3p and downregulation of let-7g-5p in AD. Among them, we verified upregulation of miR-26b-3p and downregulation of miR-98–5p and let-7g-5p in AD blood. Importantly, the expression levels of miR–26b–5p, the opposite strand of miR-26b-3p elevated in postmortem brains at the early stage of AD, represses retinoblastoma protein Rb1, resulting in acceleration of tau phosphorylation by activating Cdk5. 34
Biological pathways regulated by circulating miRNAs aberrantly regulated in AD blood
By pathway analysis of target genes for differentially expressed miRNAs with DIANA miRPath, we found that biological pathways potentially downregulated in AD are related to neuronal synaptic functions. These findings might reflect profound disturbances of synapse integrity in AD brains. In contrast, the pathways potentially upregulated in AD exhibited a significant relationship with biological pathways of cell survival and cellular communication functions. These pathways are likely to be induced and activated by compensatory responses to extensive neurodegeneration in AD brains. Importantly, the pathway-finding results obtained by DIANA miRPath are well consistent with those from the prediction of overlapping targets by five distinct algorithms, followed by pathway analysis with DAVID and IPA. Importantly, various brain-enriched miRNAs are transported through BBB into the circulatory system. 14 Therefore, our observations suggested that real-time profiles of AD blood miRNAs might reflect a disruption of the miRNA–mRNA interaction network in AD brains affected by ongoing neurodegeneration.
Conclusions
We reanalyzed a publicly available small RNA-Seq dataset, composed of blood samples derived from 48 AD patients and 22 NC subjects, by a newly established, simple web-based miRNA data analysis pipeline that combines omiRas and DIANA miRPath. We identified 27 differentially expressed miRNAs, including 13 upregulated miRNAs and 14 downregulated miRNAs in AD. The miRNA-regulated pathways potentially downregulated in AD were linked with neuronal synaptic functions, while those upregulated in AD were related to cell survival and cellular communication. This pipeline helps us to effortlessly identify candidates for miRNA biomarkers and pathways of AD from the complex small RNA-Seq data.
Author Contributions
Designed the methods, analyzed the data, and drafted the manuscript: JS. Helped with the data analysis: YK, SN. All authors have read and approved the final manuscript.