
Abstract
Around 80% of acute myeloid leukemia (AML) patients achieve a complete remission, however many will relapse and ultimately die of their disease. The association between karyotype and prognosis has been studied extensively and identified patient cohorts as having favourable [e.g. t(8; 21), inv (16)/t(16; 16), t(15; 17)], intermediate [e.g. cytogenetically normal (NK-AML)] or adverse risk [e.g. complex karyotypes]. Previous studies have shown that gene expression profiling signatures can classify the sub-types of AML, although few reports have shown a similar feature by using methylation markers. The global methylation patterns in 19 diagnostic AML samples were investigated using the Methylated CpG Island Amplification Microarray (MCAM) method and CpG island microarrays containing 12,000 CpG sites. The first analysis, comparing favourable and intermediate cytogenetic risk groups, revealed significantly differentially methylated CpG sites (594 CpG islands) between the two subgroups. Mutations in the NPM1 gene occur at a high frequency (40%) within the NK-AML subgroup and are associated with a more favourable prognosis in these patients. A second analysis comparing the NPM1 mutant and wild-type research study subjects again identified distinct methylation profiles between these two subgroups. Network and pathway analysis revealed possible molecular mechanisms associated with the different risk and/or mutation sub-groups. This may result in a better classification of the risk groups, improved monitoring targets, or the identification of novel molecular therapies.
Keywords
Introduction
Acute myeloid leukemia (AML) is a hematopoietic stem cell disorder, characterized by a block in differentiation leading to an uncontrolled expansion of a clonal population of blast cells. This results in a loss of normal hematopoietic function. AML has a prevalence of 3.8 cases per 100 000 in the USA, 1 with a higher prevalence of 10 cases per 100 000 in the U.K. 2 AML is mainly a disease of the elderly, with the median age of a patient with AML being 67 years and the prevalence increases to 17.9 cases per 100 000 in adults aged 65 years and older. 1 So although AML is currently relatively rare, it is believed the incidence will rise as the population ages.
There are two main classification systems in AML. The French-American-British (FAB) classification was developed in the 1970s and classifies AML principally on morphology and cytochemistry. The World Health Organization (WHO) system of classification stratifies AML on the basis of clinical, morphologic, immunophenotypic and genetic features (revised in 2008). AML can be subdivided into favourable, intermediate and adverse risk groups based on these features. The favourable risk group is associated with the t(8; 21), t(15; 17) and inv(16) chromosomal translocations. Normal Karyotype (NK) or complex cytogenetics is associated with an intermediate and adverse outcome respectively. Approximately 40%–50% of patients with AML have a NK and represent the largest subset of AML. However, not all patients in this subset have the same response to therapy. This is likely as a result of the large variability in gene mutations and gene expression in this population.
Specific gene mutations in NK-AML have been shown to act as prognostic modifiers. For example, about one third of AML patients have an internal tandem duplication in the FMS-like tyrosine kinase 3 (FLT3) gene. This group of patients tends to have a poorer outcome. In contrast, mutations in the Nucleophosmin 1 (NPM1) gene, observed in ≍50% of NK patients have a better prognosis than those with a wild type NPM1 gene. In 2005 Falini and colleagues published a report demonstrating the presence of a mutation in the NPM1 gene at a high frequency (40%) in NK-AML. 3 The frame shift mutation in the NPM1 gene results in the mis-localization of NPM1 to the cytoplasm. The study also found that patients with a NPM1 mutation were more likely to be responsive to induction chemotherapy and stay in remission, therefore the NPM1 mutation was associated with a more favourable outcome. NPM1 is a ubiquitously expressed phosphoprotein that shuttles between the nucleus and the cytoplasm. It has many and diverse functions including the promotion of ribosome biogenesis, control of centrosomal duplication, modulation of tumor suppressor transcription factors and in the function and stability of many nuclear proteins. Previously, the genomic changes associated with the development of cancer have been focused on amplifications, translocations, deletions and point mutations leading to the identification of oncogenes and tumor suppressor genes. However, in recent years, due to the genetic heterogeneity of AML, gene expression profiling (GEP) has come to the forefront as a means of disease classification, prognosis and prediction of responses. Microarray technology has also aided in the identification of new subclasses of AML which are both biologically and prognostically relevant. 4
Epigenetic alterations are now understood to have a role in carcinogenesis. Epigenetics is defined as heritable changes in gene expression that are not due to any alteration in the DNA sequence. 5 Re-modeling of chromatin can occur by two main mechanisms. The first is post-translational modifications of histones. These modifications include acetylation, methylation, ubiquitylation, phosphorylation and sumoylation, with acetylation being the most actively studied histone modification. 6 The second mechanism is the addition of methyl groups to the position 5 carbon of the cytosine pyrimidine ring when it is followed by a guanine in the DNA sequence (CpG site), known as DNA methylation. In a normal cell, the CpG sites scattered throughout the genome are heavily methylated and the dense regions of CpG sites (CpG islands) located in approximately 50% of all human genes are unmethylated if the gene is expressed. In cancer cells this situation is reversed, with the scattered CpG sites becoming hypomethylated and the promoter CpG islands of genes such as tumor suppressors becoming hypermethylated, leading to genomic instability and decreased expression of these genes. 7
Genome-wide studies looking at DNA methylation patterns are now also being engaged to characterize leukemia genomes, with the goal of improved diagnostic accuracy (classification) and ultimately the discovery of novel therapeutic strategies. In this study, the methylation profiles of the subgroups of AML associated with a more favourable outcome were investigated and associated with their respective gene expression profiles. This was done in two stages, initially the profiles of samples which had favourable cytogenetics (t(15; 17) and t(8; 21)) versus samples with NK-AML were analyzed. Then to assist with further stratifying the NK-AML, the methylation profiles of samples with a NPM1 mutation versus wild type NPM1 samples were analyzed. Distinct methylation profiles associated with prognostic groups were identified and this may aid in the classification of AML, particularly in the NK-AML subclass and also in the identification of therapeutic targets.
Materials and Methods
Research study subject samples
Bone marrow aspirate samples from 19 acute myeloid leukemia research study subjects (subjects) were obtained at diagnosis and before treatment. The study design was approved and ethical approval obtained before starting. Informed consent was given by all subjects. Mononuclear cells were isolated using Ficoll-Paque Plus (GE Healthcare, Uppsala, Sweden). For DNA isolation aliquots of cells from each subject were pelleted, DNA extracted as described below, and the DNA stored at -80 °C until used. For RNA isolation, aliquots of cells from each subject were lysed in buffer RLT +1% β-mercaptoethanol, RNA extracted as described below and stored at –80 °C until used.
DNA isolation
Genomic DNA from subject samples was isolated using DNeasy blood and tissue kit. DNA was eluted in AE buffer (Qiagen, Crawley, UK).
Human genomic DNA (Novagen, Merck Chemicals Ltd., Nottingham, UK) was used as control DNA for subject sample comparison within the methylation analysis.
RNA isolation
RNA was extracted from subject samples using Ampi-Lute total RNA purification kit (Qiagen). RNA was eluted in RNase-free water.
Quality control
All subject samples were processed and extracted in the same way to prevent variability between samples due to processing. For both MCAM and Genechip® expression microarray methods the respective DNA and RNA were required to be of high quality and yield. These were assessed by the Agilent 2100 Bioanalyzer (RNA R.I.N. > 8) and Nanodrop® spectrophotometer ND-1000. Only subject samples with sufficient quality and yield for both RNA and DNA were used in this study (total: 19 subject samples).
MCAM
Methylated CpG Island Amplification and Micro-array is a two-color array technique that quantifies methylation by hybridizing equimolar amounts of subject vs. control DNA to an array. The University Health Network human 12K CpG microarray (UHN, Toronto, Canada) contains 12,192 CpG island clones, each of which relates to up to three genes.
The protocol was followed as described previously 8 with the following modifications:
DNA was purified after double digestion, methylated CpG amplification (MCA) reaction and labeling was performed using the QIAquick PCR purification kit (Qiagen) without indicator in buffer PB. RMCA primers (Eurogentec, Southampton, UK) were used at both ligation and MCA reaction stages. The MCA reaction was performed using 5 U HotStarTaq+ (Qiagen) and samples were aliquoted without primers before being heated to 82 °C. The primers were held at 95 °C for 1 min before adding 4 μL to each tube. The cycling conditions were: 95 °C 10 mins prior to 30 cycles of 95 °C 1 min, 65 °C 90 sec, 72 °C 2 mins ending with 72 °C 10 mins, 4 °C hold. Samples were hybridized to UHN HCGI12K CpG microarrays. After hybridization, microarrays were washed as follows: 3×15 min at 55°C with wash 1 in rotating oven, then on gyrating platform 2 × 3 mins at R.T. 1X SSC, 2 × 3 mins at R.T. Wash 2, 2 × 3 mins at R.T. 0.1 × SSC, 2 × 3 mins at R.T. H2O. Slides were finally rinsed with H2O and centrifuged for 7 mins at 370 g to dry. Slides were scanned with an Axon GenePix 4400A scanner (MDS Analytical Technologies, Molecular Devices, Sunnyvale, CA, USA) using Genepix Pro 7 software (MDS Analytical Technologies).
GeneChip® expression microarray
GeneChip Human Genome U133 plus 2.0 arrays (Affymetrix, High Wycombe, UK) are expression arrays containing 54,613 probesets corresponding to ≈38,500 genes and gene sequences.
Double-stranded cDNA was synthesised and purified from 2 μg total RNA (extracted as above) according to the Affymetrix GeneChip protocol. cDNA was converted to biotin-labeled cRNA by an in vitro transcription reaction, which was then purified. Eleven micrograms of cRNA was then fragmented and added to a hybridization mix containing controls for griding. Samples were hybridized to the Human Genome U133 plus 2.0 arrays at 45 °C for 16 hours. Following hybridization, the GeneChips were washed and stained in an Affymetrix GeneChip fluidics station 450 before scanning in an Affymetrix GeneChip Scanner 3000. Reagents and GeneChips were kindly gifted by Roche Molecular Systems (Pleasanton, USA).
Bioinformatic analysis
For methylation arrays, the output GPR files from Gene Pix Pro 7.15 were imported into Partek Genomics Suite software (PGS). In PGS, probes that have been flagged by Gene Pix Pro 7.15 as bad, absent or not found were removed. Dye bias between the red and green channels is typical, so LOWESS normalization was used prior to calculation of ratios. The log ratio of median red (Cy5 labeled subject sample) over the median green (Cy3 labeled universal control) processed (dye normalized) signal intensities were computed in PGS for downstream analysis. In order to determine enrichment, the PGS ANOVA tool was used and the fold change using the geometric mean (for log-transformed data) was calculated. Probesets that differed significantly (p < 0.05) across AML subtypes were selected for further analysis.
For expression arrays, Affymetrix CEL files were imported and normalized in PGS using the RMA algorithm. The PGS ANOVA tool was used to identify probesets that differed significantly (p < 0.05) across AML subtypes.
Metacore Analytical Suite (Genego Inc., St. Joseph, MI, USA) was used for the network analysis of differentially methylated/expressed genes. Metacore's shortest path algorithm was applied to build a network from selected genes. Biological processes enriched in differentially methylated/expressed gene lists were identified and p-values determined using Metacore's enrichment analysis workflow.
Results
DNA methylation profiles can distinguish favourable risk subjects from intermediate normal karyotypes
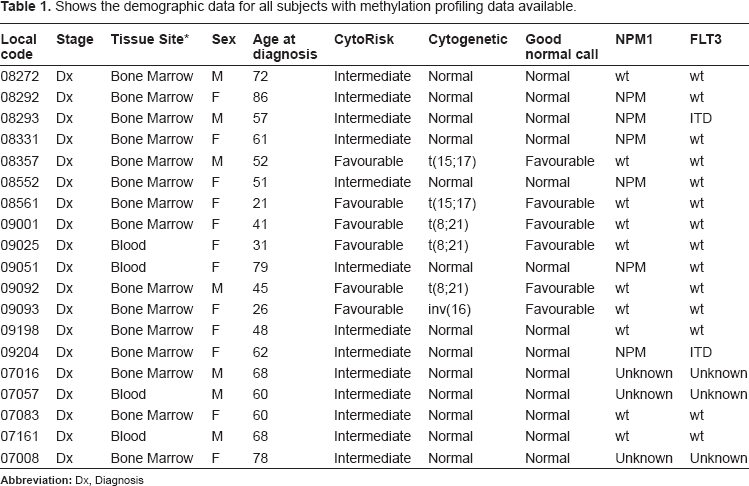
An interactive comparative approach involving methylation and gene expression profiling was used to characterize genomic changes between AML prognostic groups. Methylation arrays were performed on 19 subjects including 6 that had cytogenetics associated with a favourable outcome (t(15:17) = 3 subjects, t(8:21) = 2 subjects and inv(16) = 1 subject) and 13 subjects with NK-AML from the intermediate risk group. Table 1 shows the demographic data for each subject. The methylation profiles of subjects in the favourable risk group were compared to those of NK-AML and specific changes in CpG island methylation were identified. Using the PGS ANOVA tool, 594 CpG loci were identified that differed significantly between the two groups, of which a greater number of CpG islands were hypomethylated in the favourable risk group compared to NK-AML (358 loci hypomethylated vs. 236 loci hypermethylated).
Shows the demographic data for all subjects with methylation profiling data available.
Hierarchical clustering using euclidean distance to calculate pairwise distances results in subjects that have similar methylation status being grouped together. Hierarchical clustering, selecting for methylation status of the 594 loci, resulted in separation of the two prognostic risk groups with the exception of one subject (Fig. 1A). This subject had a t(8; 21) translocation and no apparent quality, clinical or molecular reason for the differential methylation pattern could be determined. Principle component analysis (PCA) also showed a separation of prognostic groups. The outlier sample identified in Figure 1A clustered with the favourable risk subjects in the PCA analysis however this subject sits at the edge of the ellipsoid near to the NK-AML subjects (Fig. 1B). Of the 594 CpG loci that significantly differed between the two prognostic subsets, 461 had associated gene annotation. The construction process of the UHN 12K CpG array means that an individual CpG island could lie within, upstream or downstream of a gene. Therefore, up to three genes can be associated with each CpG island and the 461 differentially methylated CpG loci were associated with 1104 annotated gene symbols. Next, the expression profiles of a large cohort of AML profiles were examined. This cohort was collected as part of the Microarray Innovations in LEukemia (MILE) study and consisted of 74 favourable risk subjects and 168 NK-AML subjects. 9 , 10 The demographic data for each of these subjects in the MILE Study has previously been published. 9 Using the PGS-ANOVA tool, 7112 probesets were identified that differed significantly in mRNA levels between favourable and NK-AML risk groups. Of these 7112 probesets, 4176 were increased and 2936 probesets were decreased in favourable subjects compared to NK-AML. To characterize how the changes in CpG methylation correlate to gene-specific expression changes, a comparative analysis using the PGS-Venn tool was performed. This two-way analysis revealed gene-specific over-lap with 261 common gene symbols between the methylation and expression data sets. After removal of duplicate gene symbols due to more than one probe set associated with each gene on the expression array, A list of 198 genes was generated that represented the genes that showed significant changes in both methylation and expression between the favourable and NK-AML groups (Fig. 1C). Of this list of 195 genes, 1 gene had 3 associated CpG islands, 16 genes had 2 associated CpG islands and 181 genes had 1 associated CpG island that were differentially methylated. However, as CpG islands can regulate the expression of up to 3 genes, this equated to a total of 176 CpG islands associating with the 195 genes. Two CpG islands had 3 associated genes showing a difference in expression, 33 CpG islands had 2 associated genes and 140 had 1 associated gene that showed a differential expression between favourable risk subjects and NK-AMLs. Correlations between gene-specific changes were characterized and genes were plotted based on their methylation and expression profile. The highest association observed was between hypomethylation and over-expression (Fig. 1D).
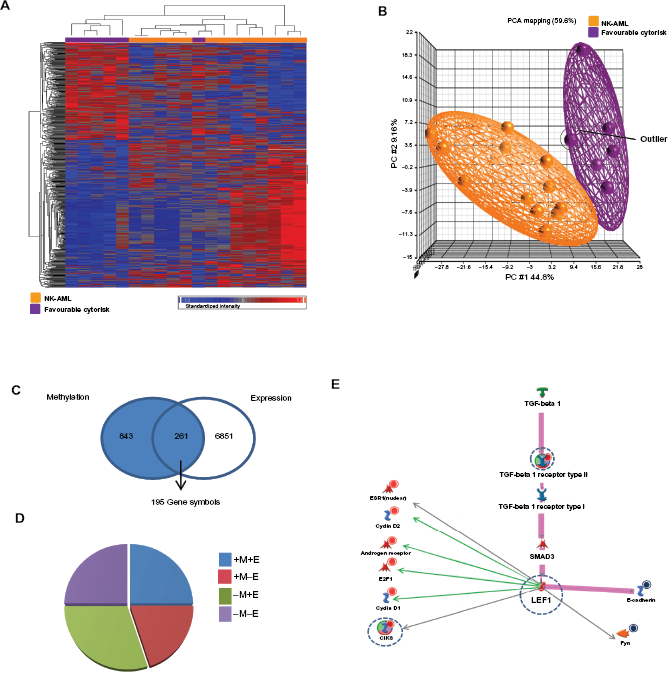
Comparative epi/genomic analysis of two prognostic sub-groups of AML those placed in the favourable risk group and those in the intermediate risk group (NK-AML). A) Heatmaps showing hierarchical clustering of the most significantly altered probe sets of the CpG island methylation data. Columns represent subject samples and rows represent genes. Relative DNA methylation levels are shown in red (high) and blue (low). B) Principle component analysis (PCA) separating favourable risk subjects (purple) from NK-AML subjects (orange). The outlier subject from Figure 1A is highlighted. C) Integration of DNA methylation and expression data. Genes that demonstrate significant changes in DNA methylation and gene expression were analyzed using PGS-Venn tool. D) Relative quantification of genes identified in a two-way analysis. M, methylation; E, expression; (–) loss of; (+) gain of. For example, 30% of genes identified with significant changes in both DNA methylation and gene expression between the two prognostic AML groups demonstrate decreased methylation and increased expression (-M+E). E) Metacore generated visualization of TGF-β I receptor type II/LEF1 network reconstructed from the methylation/expression (-M+E) profile. Red circles denote gain in expression, blue circles denotes loss of expression in the favourable risk group compared to NK-AML subjects taken from the MILE study. The blue dotted line denotes a decrease in methylation in the favourable risk group compared to NK-AML subjects. The transcription factor LEF1 was identified as a divergence hub. A number of LEF1 target genes were demonstrated to have differential expression in favourable compared to NK-AML subjects. Green arrows represent target genes known to be activated by LEF1, grey arrows denote genes with a putative LEF1 binding site within their promoters. A functional TGF-beta 1 activated pathway known to activate LEF1 has been highlighted in pink.
Demethylating agents are being used more frequently in clinical practice. For this reason, genes that had lower levels of methylation and increased levels of expression in the favourable risk group compared to those in the intermediate risk group (NK-AML) were examined (61 genes). These genes may be potentially affected by a de-methylating agent resulting in increased expression and improved prognosis. Functional analysis of this list of selected genes was performed using Metacore's shortest path algorithm to build a network that featured 50 of the 61 genes. This network centers on the transcription factor lymphoid enhancer binding factor 1 (LEF1) and consisted of a significant number of biomarkers associated with neoplasms. LEF1 is a nuclear protein expressed in pre-B and T-cells and plays a key role in development.11,12 This transcription factor is activated through Transforming growth-factor Beta (TGF-β) 1 binding to TGF-beta 1 receptor type II, with the latter also showing decreased methylation and increased expression in the favourable risk group compared to normal karyotypes. 13 In order to investigate if an increase in LEF1 expression had functional impact, the expression levels of a number of LEF1 target genes were examined and a significant difference in expression of these target genes in the favourable risk group compared to NK-AML was observed (Fig. 1E). These data suggest that distinct differences in methylation profiles exist between two subgroups of AML and hence methylation profiling maybe of prognostic value. These data also suggest that LEF1 may be a potential therapeutic target in subgroups of AML.
Mutations in the NPM1 gene result in a distinct methylation pattern in normal karyotypes
While identification of epigenetic and expression alterations associated with the overall normal karyotype is of benefit, this group of AML patients is highly heterogeneous and outcome varies greatly. Therefore, identification of novel prognostic markers that can further sub-divide this large group of patients is highly desirable. One means by which this can be achieved is by examination of the mutation status of a subjects’ DNA. The NPM1 gene is mutated in approximately 40% of all NK-AML patients. Interestingly, patients harboring a mutation in this gene, in the absence of other mutations, have improved prognosis compared to those with wild-type NPM1. 2 We hypothesized that identifying epigenetic changes associated with the NPM1 mutation may identify additional prognostic markers that would allow us to segregate AML subjects further. Methylation profiles of 6 subjects harboring an NPM1 mutation and 4 NPM1 wild-type subjects were examined. Subjects with an NPM1 mutation displayed different patterns in promoter CpG island methylation to NPM1 wild-type subjects. These data suggest that mutations in the NPM1 gene may impact on epigenetic changes in AML. Using the PGS-ANOVA tool, 769 CpG islands that significantly differed between NPM1 mutated and NPM1 wild-type subjects were observed, of which 616 CpG islands had annotation. These 616 CpG islands had 1490 associated gene symbols. Euclidean clustering and PCA analysis demonstrated distinct separation of the two groups of subjects depending on the NPM1 mutational status (Figs. 2A and B). The heatmap used to depict the Euclidean clustering showed that one subject with a NPM1 mutation did not cluster with the other NPM1 mutated subjects (referred to as subject X). Interestingly, in the PCA analysis, with the exception of the outlier subject (subject X), tight clustering in all subjects with an NPM1 mutation was observed. This suggests that an NPM1 mutation may have a strong impact on a patient's methylation profile and the NPM1 gene may play a role in DNA methylation. A decrease in methylation status of the CpG island associated with LEF1 was verging on significance (p = 0.06) in subjects with a NPM1 mutation compared to NPM1 wild-type subjects in this smaller population study.
Methylation profiles were then compared with expression data from NK-AML subjects with known NPM1 mutational status from the MILE study. PGS-ANOVA analysis identified 1715 probesets that differed in expression between NPM1 mutated and NPM wild-type NK subjects. The PGS-Venn tool identified 90 gene symbols that differ significantly in both methylation and expression status between NPM1 mutated and NPM1 wild-type subjects. Gene symbols that appeared multiple times were removed, resulting in 71 unique genes that showed changes in methylation and a corresponding change in expression (Fig. 2C). When the percentage of genes changed were plotted against methylation and expression trends, the highest correlation was seen for increased methylation and decreased expression (Fig. 2D). However, as NPM1 mutations are associated with improved outcome and we are interested in identifying potential targets for demethylation that would result in improved prognosis, a list of 17 genes (23.9% of genes indentified in the integrative analysis) that demonstrated decreased methylation and increased expression in subjects harboring an NPM1 mutation was examined. Metacore enrichment analysis showed that 4 of the top 10 enriched processes in this gene list were associated with DNA assembly and stability (Fig. 2E). NPM1 plays a role in genetic stability by controlling DNA repair and centrosome duplication and NPM mutations have a significant association with a normal karyotype. 3 These data also suggest that NPM1 may also maintain genetic stability by modulating chromatin assembly and this process may be regulated at the level of methylation.
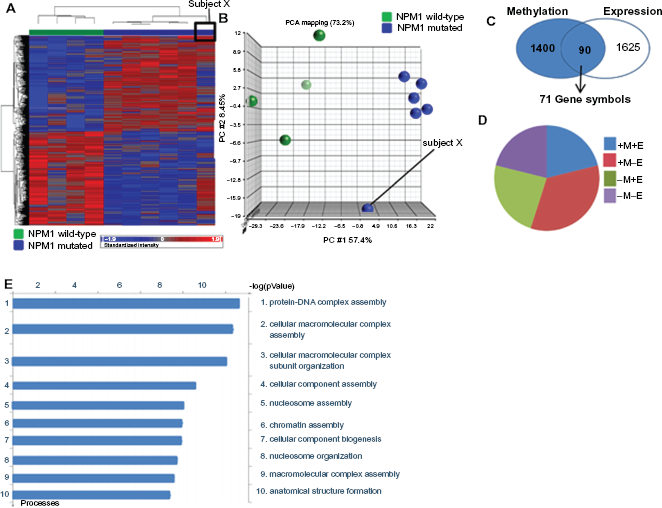
Integrative epi/genomic analysis of NK-AML subjects harboring an NPM1 mutation compared to NPM1 wild-type subjects. A) Heatmaps showing methylation levels in NPM1 mutated and NPM wild-type subjects. The outlier sample, subject × (NK-AML harboring a NPM1 mutation) is highlighted. B) Principle component analysis separating NPM1 mutated and NPM1 wild-type subjects. Subject × is highlighted. C) Integration of DNA methylation and expression analysis comparing NPM1 mutated and NPM1 wild-type subjects using PGS-Venn tool. D) Identification of DNA methylation and gene expression trends in the two-way analysis. The columns represent the percentage of genes in the two-way intersect. E) Metacore identification of processes significantly enriched in the –M+E profile (decrease in methylation, increase in expression) of AML subjects with an NPM1 mutation compared to NPM1 wild-type subjects.
A differential methylation pattern of SCL6A6 exists across prognostic subtypes of AML
The NPM1 status of all subjects was mapped onto the methylation profiles that separate subjects with favourable cytogenetics from NK-AML subjects. Clustering of subjects with an NPM1 mutation was observed (Fig. 3A) with the exception of one subject identified as subject X. This indicates that the methylation profile that separates the favourable risk subjects from NK-AML is also able to distinguish between NPM1 mutated and NPM1 wild-type subjects.
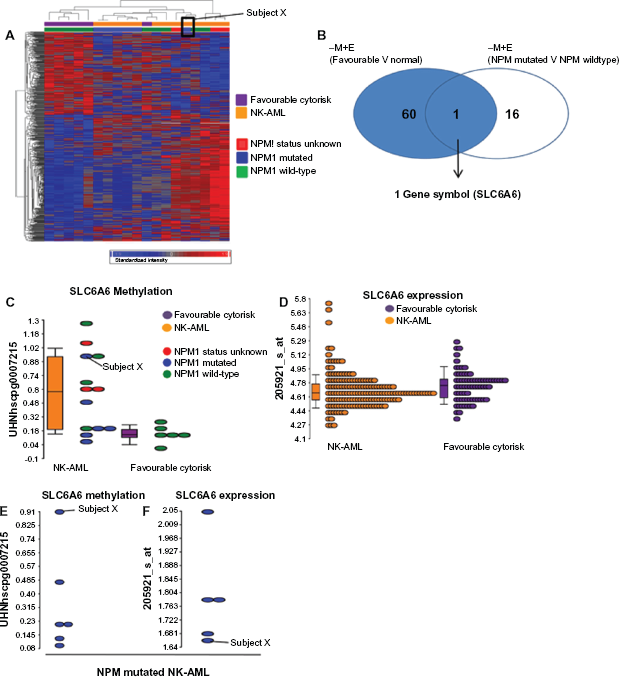
Integration of epi/genomic profiles from two prognostic subgroups of AML. A) Heatmap showing hierarchical clustering of AML subjects from the favourable risk and NK-AML intermediate risk group. Subjects’ NPM1 status is also labeled. B) Identification of over-lapping genes between the 2 epi/genomic profiles that separates i) favourable from normal karyotype risk subjects and ii) NPM1 mutated from NPM1 wild-type subjects. C) Dotplot showing methylation levels of SLC6á6 between the favourable (purple) and NK-AML (orange) subjects. Individual subjects are colored depending on NPM1 mutational status (green = wild-type NPM1; blue = mutated NPM1 and red = NPM status unknown). D) Dot plot showing SLC6A6 expression levels between favourable and NK-AML subjects. E) Dotplot showing degree of methylation of SLC6A6 in normal karyotype NPM1 mutated subjects. The highest degree of methylation was observed in subject X. F) Dotplot showing SLC6A6 expression levels in NK-AML NPM1 mutated subjects. The lowest level of expression is observed in subject X.
We hypothesized that genes common to the two profiles associated with an improved prognosis (i.e. favourable risk and NK-AML with a NPM1 mutation) may identify potential therapeutic targets. To detect overlapping genes between the two prognostic methylation signatures, the PGS-Venn tool was used to identify genes that demonstrated decreased methylation and increased expression associated with both (a) the favourable risk subjects compared to NK-AMLs and (b) NK-AML subjects with an NPM1 mutation compared to NK-AML subjects without an NPM1 mutation. Only one gene, SLC6A6, was shown to have decreased methylation and increased expression when comparing favourable to all NK-AML subjects and NK-AML subjects with an NPM1 mutation to NK-AML NPM1 wild-type subjects.
The SLC6A6 methylation status of individual subjects was examined. When all NK-AMLs were compared to favourable risk subjects, three distinct groups of NK-AML subjects were observed: those with high levels of SLC6A6 CpG island methylation, those with medium and those with low levels. The group of low methylation subjects had methylation levels of SLC6A6 comparable to those in the favourable risk group (Fig. 3C). Next, the NPM1 status of individual subjects was mapped to the SLC6A6 methylation levels and 4 of the 5 NK-AML subjects with the lowest degree of methylation levels of SCL6A6 also harbored an NPM1 mutation. One subject with an NPM1 mutation had distinctly higher levels of methylation of SLC6A6 than all other subjects with NPM1 mutations. This subject was again identified as subject X, the previously identified outlier sample (Fig. 3C). The methylation and expression profiles of only the NPM1 subject samples for which we possessed methylation and corresponding expression data were examined. It was observed that subject X, who has the highest level of methylation also has the lowest degree of expression of SLC6A6 (Figs. 3E and F). Taken together, these data suggest that aberrant methylation of SLC6A6 may occur within subgroups of AML and quantification of promoter methylation may be of prognostic value.
Discussion
The classification of AML is challenging, particularly in NK-AML patients and no consensus exists to predict prognosis or optimum treatment in this group of patients. We have shown that distinct methylation profiles are associated with clinically relevant molecular markers of AML. Firstly, it was demonstrated that subjects with cytogenetic aberrations associated with a favourable prognosis differed in methylation status to NK-AML subjects who are associated with an intermediate outcome. Next, it was shown that differences exist in methylation patterns between subjects with NK-AML harboring an NPM1 mutation (a prognostic marker associated with improved outcome) and those without an NPM1 mutation. Interestingly, when the NPM1 status of all subjects were mapped onto the methylation profiles that separates favourable risk subjects from NK-AML subjects, clustering of subjects with an NPM1 mutation was observed.
Several tumour suppressor genes demonstrate an increase in methylation and a corresponding decrease in expression in tumor tissues. 14 In humans, this methylation involves the activity of a group of enzymes referred to as DNA methyltransferases (DNMTs), which catalyse the transfer of a methyl group to a cystine base in newly synthesized DNA. Several DMNTs are over-expressed in tumour tissues and DNMT inhibitors have activity in the treatment of myeloid malignancies.15,16 Interestingly, we observed a decrease in expression of DNMT3B in subjects with favourable prognosis compared to NK-AML subjects. A decrease in expression of DNMT3A and DMNT1 in NK-AML subjects harbouring an NPM mutation compared to those without an NPM mutation is also observed (data not shown). This suggests DNMT activity may be decreased in the two AML cohorts associated with improved prognosis (favourable cytogenetics and NK-AML with a NPM mutation). Despite DNMT inhibitors showing potential for the treatment of AML, the use of these treatments is limited by their lack of specificity and cytotoxic effects. Therefore, the identification of downstream genes whose reactivation may improve prognosis is desirable and is the focus of this study.
Subjects in the favourable risk group were first compared to NK-AML subjects and 594 CpG islands were significantly different between the two groups. Whilst the methylation status was similar across all subjects in the favourable risk group, the NK-AML subjects displayed marked diversity in methylation status. This is reflective of the diverse molecular abnormalities observed across NK-AML patients and corresponds to heterogeneity in gene expression seen in this subgroup of patients. 20
Gene ontology analysis of the gene list that displayed decreased methylation and increased expression in the favourable risk group compared to NK-AML subects revealed that six of the top ten processes enriched in the list were involved in developmental processes (data not shown), a process that is disrupted in AML. Key signaling pathways involved in hematopoietic development include the Wnt and the TGF-β pathways.21,22 A major component of the canonical Wnt pathway is the transcription factor LEF1. LEF1 binds to and activates β-cadherin, a protein that is stabilized upon Wnt ligand binding. LEF1 and β-cadherin then go on to induce transcription of a number of target genes involved in developmental processes 21 The TGF-β pathway has been identified as an alternative pathway that can also signal through the LEF1 transcription factor. TGF-B1 induces epithelial-mesenchymal transition (EMT), a program that is essential for a number of developmental processes in a β-cadherin/LEF1 dependant manner. 13 A key characteristic of EMT is the repression of E-cadherin expression, resulting in increased cell motility. 23 Both the TGF-B1 receptor and LEF1 were shown to be differentially methylated with a corresponding change in expression between the favourable and NK-AML cohorts. Expression of E-cadherin is also reduced in the favourable risk group. This suggests that EMT via the TGF-β1 signaling pathway is disrupted in AML and this signaling pathway may be in part regulated at the level of methylation.
TGF-β also inhibits G1 arrest via the up-regulation of cyclin D1 in a β-cadherin dependent manner. 24 LEF1 target genes cyclin D1 and cyclin D2 are up-regulated in the favourable risk subjects. Up-regulation of these genes by activation of the TGF-β1/LEF1 pathway could in theory drive the hematopoietic stem cells out of the quiescent self-renewing state allowing for development of mature differentiated blood cells. Patients associated with favourable cytogenetics, show an improved response to induction chemotherapy and this may be due to an increase in differentiation. 25 Activation of differentiation networks in bone marrow cells of AML patients with favourable cytogenetics may explain their improved prognosis.
NK-AML subjects with or without an NPM1 mutation also show distinct methylation patterns and hierarchical clustering resulted in separation of the two prognostic groups. PCA analysis revealed that NPM1 wild-type subjects are widely dispersed, suggesting heterogeneity in methylation profiles within this group. Subjects with an NPM1 mutation cluster tightly together. This suggests that mutations in the NPM1 gene results in a distinct methylation profile. Gene ontology analysis revealed that subjects with an NPM1 mutation have decreased methylation and increased expression in genes involved in nucleo-some and chromatin assembly. This is interesting as the NPM1 mutation is significantly associated with a NK-AML and the majority of subjects with a NPM1 mutation lack recurrent cytogenetic abnormalities. 3 It is unclear why mutations in the NPM1 gene result in improved prognosis, however, mutated NPM1 has been implicated in the maintenance of DNA stability through the regulation of centrosome number. 3 An increase in expression of genes involved in DNA packaging may also stabilize DNA and prevent karyotype alterations.
SLC6A6 was identified as the only gene associated with decreased methylation and increased expression in both of the improved prognostic groups (favourable risk group and NK-AML subjects harboring an NPM1 mutation). It is tempting to speculate that a decrease in methylation of SLC6A6 at diagnosis may indicate an improved prognosis. Indeed, the methylation status of the estrogen receptor and p15INK4B can predict relapse risk in AML patients in clinical remission. 26 Futher studies will be required to explore the correlation between SLC6A6 methylation status at diagnosis and prognosis.
SLC6A6 is a membrane bound sodium and chloride dependent taurine transporter that has been implicated in retinal and kidney development.27,28 This gene is abundant in proliferating lymphocytes and is a downstream target of p53 and WT1 (Wilms tumor suppressor gene).28,29 Interestingly, an estrogen receptor binding site has been identified in the promoter of the SCL6A6 gene and it has been suggested that taurine uptake is regulated by estrogen via SLC6A6. 30 The estrogen receptor is a LEF1 target gene that we showed to be up-regulated in the favourable risk group (Fig. 1E) suggesting that SLC6A6 may function downstream of LEF1. 31
Of the genes shown to have significant CpG island methylation, only a small proportion demonstrated a corresponding change in expression levels indicating that additional factors control gene expression levels. While the highest correlation between methylation and expression observed was between decreased methylation and increased expression, a significant proportion of genes were observed to show either increased methylation and increased expression or decreased expression and decreased methylation. This questions the dogma that increased promoter methylation results in gene suppression. A number of studies have recently emerged challenging this dogma suggesting that the mechanisms by which methylation impacts on gene expression have still to be completely characterized.32–34 The current studies using integration of global methylation and expression analysis will further increase our understanding of epigenetic regulation of gene expression.
In conclusion, we have identified distinct methylation profiles associated with prognostic groups and hierarchical clustering can successfully separate subjects into the prognostic cohorts. Methylation profiling may therefore aid survival prediction and responses to the therapies. 4 The methylation status of genes at diagnosis, for example SLC6A6, may also be of prognostic value. Methylation profiling may also lead to improved specificity of demethylation agents in the treatment of AML. Patients with increased methylation may show an improved response to treatments with these agents than those without allowing for targeted demethylation treatment. Finally, methylation profiling may result in the identification of novel therapeutic targets, for example LEF1, whose expression is disrupted by abbreverant methylation. Increasing LEF1 activity, via activation of the TGF-β or Wnt pathways, may drive differentiation of the clonal population blast cells observed in AML and help restore hematopoietic function.
Disclosures
This manuscript has been read and approved by all authors. This paper is unique and is not under consideration by any other publication and has not been published elsewhere. The authors report no conflicts of interest.
Footnotes
Acknowledgement
This project is supported by the Northern Ireland Department for Employment and Learning through its “Strengthening the all-Island Research Base” initiative.