
Abstract
Altered claudin expression has been described in colon, prostatic, ovarian, and breast carcinoma. However, the role of epigenetic modifications in these genes and their role in colorectal cancer is unknown. We aimed our study to investigate whether claudin protein expression and methylation of CLDN can influence the tumorigenesis of colorectal cancer. A total of 31 patients diagnosed with colorectal carcinoma was used in this study. Immunohistochemical staining was used to study protein expression in both tumor and the adjacent nonneoplastic mucosa of claudin 1, 4, and 7. To detect the DNA methylation pattern of CLDN1, 4, and 7, genomic DNA was extracted from both the tumor and the adjacent nonneoplastic mucosa. Methylation analysis was carried out using bisulfite pyrosequencing. Cell membrane staining intensity of all claudins was found significantly lower in colorectal cancer tissues when compared to paired normal mucosa (p ≤ 0.001). For claudin 4, the percentage of cells staining positively was also significantly reduced (p = 0.04). In normal mucosa, cytoplasm showed no staining for claudins in any patient, whereas in paired colorectal cancer tissues, significant cytoplasmic staining appeared both for claudin 1 (p = 0.04) and claudin 4 (p = 0.01). Tumor samples were significantly hypomethylated in CLDN1 (p < 0.05). In conclusion, our results show that CLDN1 is significantly hypomethylated in tumor samples and that the membrane staining intensity for claudin 1, 4, and 7 is significantly lower in colorectal cancer tissues than in adjacent nonneoplastic tissue. Colorectal cancer cells showed dystopic cytoplasmic location of claudins.
Introduction
Targeting tumor suppressor genes by epigenetic silencing especially in the promotor region is one of the probable mechanisms of carcinogenesis. 1 However, differential methylation may also occur outside of the promoter region and previous studies have shown that gene expression and tissue differentiation are powerfully affected by such methylation sites.1,2 So far, there are limited data available on claudin (CLDN), epigenetics, and the relation to claudin protein expression as well as its role in the development of colorectal carcinoma (CRC). While DNA methylation of claudin 6 has been shown to be involved in the invasion of breast cancer cells 3 and hypermethylation of claudin 11 in malignant melanoma of the skin, 4 there is no information of claudin methylation and CRC. There are, however, several studies on gene and protein expression of claudins in CRC; several of the studies promoting different claudins as tumor markers bring up- or downregulated and/or having an abnormal protein expression pattern compared to the adjacent nonneoplastic mucosa (ANNM).5–7
Recently, we investigated the CLDN gene for polymorphisms and expression analysis that were associated with an increasing risk of CRC development, 8 making it interesting to study the DNA methylation pattern in CLDN1, 4, and 7 in CRC and find out whether there is any relation with claudin expression levels and/or other clinical parameters. Since this group of genes has been implicated in tight junctions (TJs) disruption in several cancer forms, we hypothesized that CLDN1, 4, and 7 could be epigenetically changed in CRC. In this study, we investigated the claudin protein expression in colon carcinoma patients and related this to CLDN gene DNA methylation patterns in CRC tissue samples as well as matched samples of ANNM from CRC patients. For this purpose, we developed sequence-specific, quantitative pyrosequencing methods for analyzing DNA methylation both in CpG islands and in shores of the CLDN1, CLDN4, and CLDN7 genes.
Materials and methods
In this study, 31 randomly selected formalin-fixed, paraffin-embedded (FFPE) tissue samples from CRC patients diagnosed between 2001 and 2008 from both men and women were used along with paired ANNM samples (margin to the tumor at least 5 mm) from the same patient as controls. All cases were anonymized and given consecutive numbers along with the year of diagnosis. Clinicopathological parameters such as age, tumor location, tumor stage, and tumor grade lymph node metastatis were extracted, as shown in Table 1. The Regional Ethics Review Board, Uppsala, Sweden, approved the study on condition that the samples were de-identified.
Clinicopathological parameters.

X: no metastasis.
DNA extraction and bisulfite treatment
DNA was manually extracted from FFPE tissue samples of CRC patients and ANNM according to the manufacturers’ protocol using Viogen Blood and tissue genomic DNA extraction Miniprep Kit (Viogen, Gentaur, Kampenhout, Belgium). From the extracted DNA, 500 ng was used for the bisulfite treatment performed with EZ DNA Methylation Gold kit according to the manufacturer’s instruction and eluted in 20 µL elution buffer (Zymo Research, Orion Diagnostica, Sweden).
Polymerase chain reaction amplification and primer design
The genomic sequences of all CLDN genes were obtained from (National Center for Biotechnology Information (NCBI). CpG island searcher (http://cpgislands.usc.edu/) was used to identify CpG sites. Polymerase chain reaction (PCR) primers were designed for CLDN1, CLDN4, and CLDN7 by using Primer3 (http://bioinfo.ut.ee/primer3/). PCR primers, sequencing primers, and annealing temperatures are summarized in Table 2.
PCR primer sequences, annealing temperatures, amplicon sizes, and sequencing primer sequences for CLDN methylation analysis by pyrosequencing.

PCR: polymerase chain reaction; Tm: melting temperature; bp: base pair.
PCR was performed using HotStarTaq plus DNA polymerase kit (QIAGEN AB, Sollentuna, Sweden), containing 0.15 µmol/L of each primer, 0.25 U of Taq polymerase, 2.5 mM MgCl2, and 0.1 mM each of deoxyguanosine triphosphate (dGTP), deoxyadenosine triphosphate (dATP), deoxythymidine triphosphate (dTTP), and deoxycytidine triphosphate (dCTP). A total of 20 ng of bisulfate-treated DNA was added to PCR reaction as template. PCR reaction was conducted as follows: starting at 94°C for 10 min, followed by 49 cycles (45 s at 94°C, 30 s at the annealing temperature, and 30 s at 72°C), and a final 7-min hold at 72°C.
Pyrosequencing assays
Pyrosequencing was used to analyze the methylation fractions of the CpG sites. Methylation analysis was carried out using PyroMark Q96 ID (Qiagen.Biotage AB, Uppsala, Sweden) according to the manufacturer’s protocol. Pyro Q-CpG software (Biotage, Uppsala, Sweden) was used to analyze the methylation status. The nucleotide addition order was optimized by the Pyro Q-CpG software version 1.0.9 (Qiagen). Briefly, 25 µL of the PCR product master mix was added to 3-µL streptavidin sepharose solution (Amersham Biosciences, Uppsala, Sweden) along with 12 µL of MilliQ H2O and 40 µL binding buffer (10 mmol/L Tris–HCL, 2 mol/L NaCl, 1 mmol/L ethylenediaminetetraacetic acid (EDTA), 1.0%Tween20, Milli-Q water pH 7.6). At vacuum prep workstation, the amplicons were placed onto the streptavidin sepharose beads and then passed through one denaturation step and two washing steps (70% ethanol, denaturation using 0.2 mol/L NaOH, and washing with 10 mmol/L Tris–acetate and Milli-Q water).
The products were then transferred to a plate containing sequencing primer (0.4 µmol/L) in 40 µL annealing buffer (20 mmol/L Tris–acetate, 2 mmol/L magnesium acetate, pH 7.6).
The amplicons and sequencing primers were incubated at 80°C for 2 min, cooled down to room temperature to permit annealing of the sequencing primer before putting the plate into PyroMark Q96 ID. The substrate mixture, deoxynucleotide triphosphates (dNTPs), and enzymes were added to the cartridge according to the manufacturer’s protocol (PyroMark Q96 ID system; QIAGEN AB).
Immunohistochemical analysis
Slides preparation and staining
For immunohistochemical analysis, 4-µm sections were made from FFPE blocks containing material from colorectal cancer patients by using Leica microtome (Buffalo Grove, IL, USA). The sections were placed on super-frost slides and incubated for 60 min at 62°C. The slides were then pretreated for 1 h and 20 min with EDTA buffer saline solution with pH 9.3 at 97°C.
Primary antibodies for anti–claudin 1 and anti–claudin 7 were purchased from Invitrogen (Carlsbad, CA, USA) and anti–claudin 4 from Abcam (Cambridge, UK). All antibodies were polyclonal rabbit antibodies and were designed specifically for FFPE tissue staining. Staining was performed according to the manufacturer’s protocol (DAKO-Cytomation, Denmark) with incubation of the primary antibodies for 30 min at working dilutions of 1:200, 1:300, and 1:1000 for anti–claudin 1, 4, and 7, respectively.
Scoring of slides
Slides were scored on the scales of intensity and ratio for membrane and cytoplasm staining, with intensity scores of 0, 1, 2, and 3 where 0 = no staining, 1 = weak, 2 = moderate, and 3 = strong staining, whereas the percentage of the cellular population staining positively was scored with grade 0 representing <10% stained cells; grade 1, 10%−50% stained cells; grade 2, 50%–80% stained cells; and grade 3, >80% stained cells.
Statistics
Statistical analysis was performed using SPSS version 15.0 software (SPSS, Inc, Chicago, IL, USA). Quantitative parameters were analyzed by mean and standard deviation, while qualitative parameters with percentage and frequencies. Chi-square test and Spearman correlations were applied between the grouped variables. All p values were calculated using analysis of variance (ANOVA), post hoc, and t-test. Two-tailed p values of 0.05 or fewer were regarded as statistically significant.
Results
In this study, a total number of 62 FFPE samples were used from 31 patients diagnosed with colorectal cancer. Half of the samples were from paired ANNM and the other half from the tumor. The male/female sex ratio was 20:11. A total of 18 tumors (58.1%) were located in the proximal colon, 9 (29%) in the distal colon, and 4 (12.9%) in rectum. According to the World Health Organization’s (WHO) classification, out of 31 CRC samples, 13 (41.9%) were high-grade and 18 (58.1%) were low-grade carcinomas.
Membrane staining
Claudin 1 staining intensity was moderate in 10 CRC tumor tissue samples and strong in 21 CRC tissue samples. Conversely, all the 31 matched ANNM samples showed strong claudin 1 staining intensity (p = 0.001). Claudin 4 intensity was moderate in 15 CRC samples and strong in 16 CRC samples, whereas intensity was strong in all 31 matched ANNM samples (p < 0.001). Claudin 7 intensity was moderate in 9 CRC samples and strong in 22 CRC samples. All the 31 matched ANNM samples showed strong intensity (p = 0.001) (Figures 1 and 2).

Immunohistochemical staining for CLDN 1 in colorectal tissues: (a) Claudin 1 membrane staining—1: ANNM tissue; 2: low-grade tumor tissue; and 3 high-grade tumor tissue. No cytoplasmic staining found. (b) Claudin 1 membrane and cytoplasmic staining—1: low staining in tumor tissue and 2: moderate staining in tumor tissue.

Immunohistochemical staining for CLDN 4 in colorectal tissues: (a) Claudin 4 membrane staining—1: ANNM tissue; 2 low-grade tumor tissue; and 3: high-grade tumor tissue. No cytoplasmic staining found. (b) Claudin 4 membrane and cytoplasmic staining—1: low staining in tumor tissue and 2: moderate staining in tumor tissue.
The ratios of positive staining for claudin 1, 4, and 7 showed that for claudin 1 there was no significant difference between CRC tissue and ANNM tissue (p = 0.4). Similar results were observed for claudin 7 as well (p = 1.0). However, the ratio of cell staining for claudin 4 was significantly lower in CRC tissue than in ANNM (p = 0.04).
Cytoplasmic staining
Claudin 1 staining intensity in the cytoplasm was graded moderate in five and strong in one CRC samples. All 31 matched ANNM samples showed no staining (p = 0.04). The ratio of cells staining positively in the cytoplasm was generally significantly higher in CRC tissue than in ANNM tissue (p = 0.01). Claudin 4 intensity was moderate in six and weak in two CRC samples, whereas staining was negative in all 31 matched ANNM samples (p < 0.01). The ratio of cells staining positively in the cytoplasm was significantly higher in CRC tissue than in ANNM tissue (p = 0.001). Claudin 7 was weakly expressed just in one CRC sample, and the 31 matched ANNM samples all showed no cytoplasmic staining (p = 0.31). The ratio of cells staining positively was not statistically significantly different between CRC tissue and ANNM tissue (p = 0.31) (Figures 1 and 2).
DNA methylation in colorectal cancer tissue
Three methylation assays were designed for CLDN1, four for CLDN4, and five for CLDN7 covering a total number of 12, 18, and 21 CpG sites, respectively. The methods were designed to cover methylation status of the genes in both CpG islands and shores of all three genes. The selected locations are shown in Supplemental Figures 1–3.
In CLDN1, there was a significant hypomethylation upstream of the CpG island (CpG sites 23–26) between tumors and ANNM (p < 0.01), but no statistically significant difference was observed between high- and low-grade tumors (see Figure 3 and Table 3).

DNA methylation profile of the CLDN1 gene. Upper: Normal mucosa versus colorectal cancer tissue, CpG sites 23–25 were significantly different (p < 0.001). Lower: High-grade versus low-grade colorectal cancer tissue. The differences are not statistically significant. Lines show mean values.
DNA methylated fraction of the CpG sites in the CLDN1 gene in normal tissues and high- or low-grade CRC.

CRC: colorectal carcinoma; SD: standard deviation; ANOVA: analysis of variance.
p1: ANOVA between all three groups.
p2: Normal mucosa versus high-grade tumor tissue.
p3: Normal mucosa versus low-grade tumor tissue.
p4: High-grade versus low-grade tumor tissue.
In CLDN4, there was a significant hypomethylation in CRC tissue as compared to paired ANNM for one CpG site (no. 24), while other CpG sites were non-significantly hypomethylated in CRC both upstream of the CpG island and in the CpG island itself (Figure 4, Table 4). There was frequent assay failure of the long amplicons (≈250 base pair (bp)) covering CpG sites 83–104, consuming up all available DNA from ANNM tissues, and thus we lack those data for these sites.

DNA methylation profile of the CLDN4 gene. Upper: Normal mucosa versus colorectal cancer tissue. CpG site 24 is statistically significantly different. Lower: High-grade versus low-grade colorectal cancer tissue. The differences are not statistically significant. Lines show mean values.
DNA methylated fraction of the CpG sites in the CLDN4 gene in normal tissues and high- or low-grade CRC.
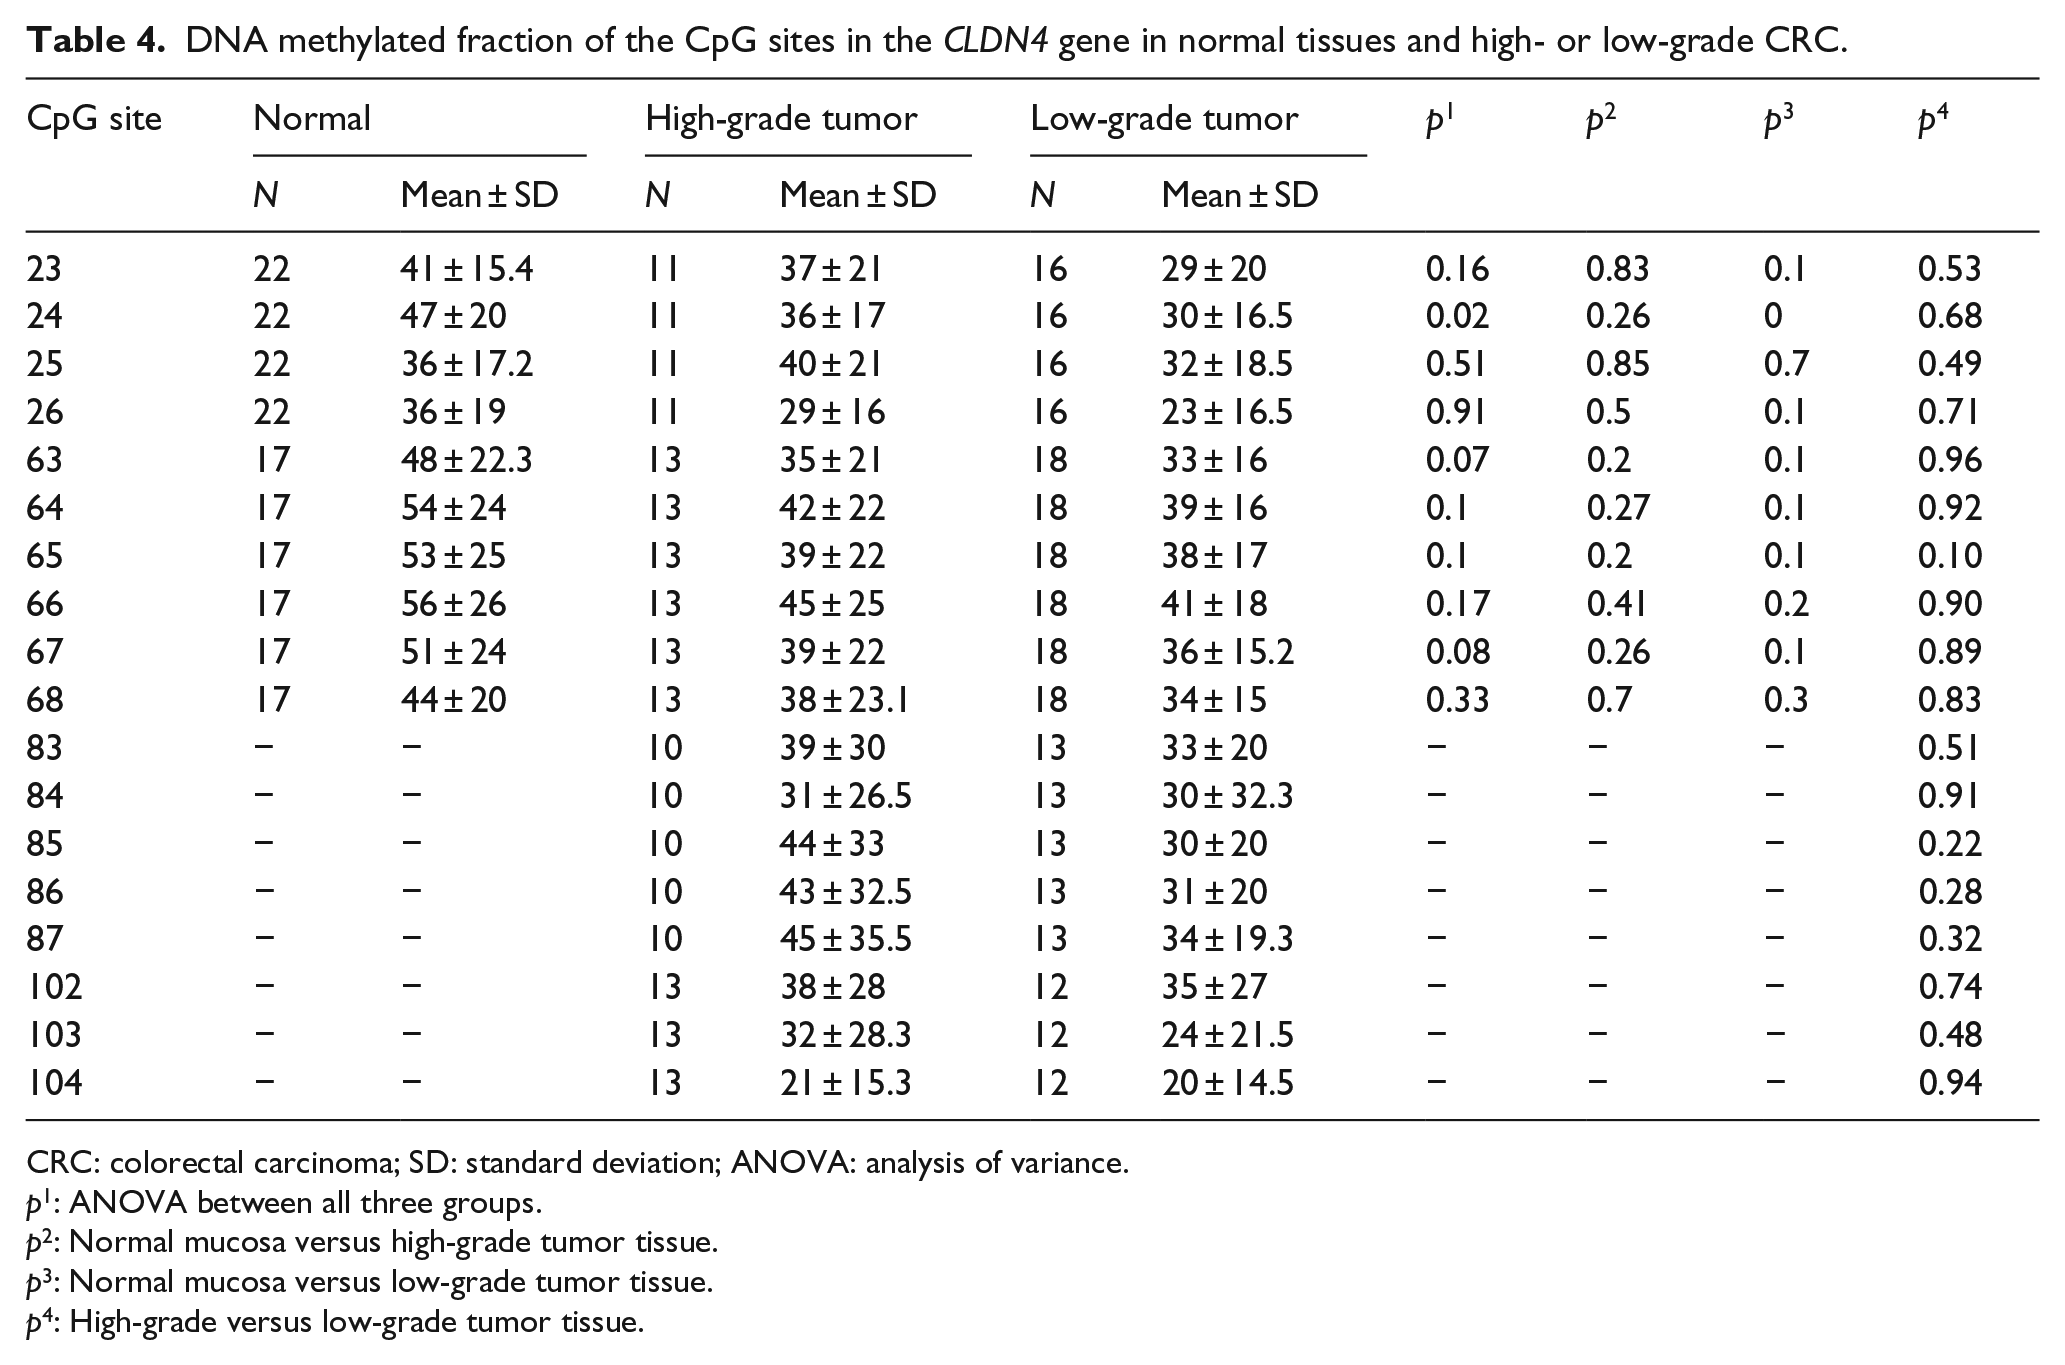
CRC: colorectal carcinoma; SD: standard deviation; ANOVA: analysis of variance.
p1: ANOVA between all three groups.
p2: Normal mucosa versus high-grade tumor tissue.
p3: Normal mucosa versus low-grade tumor tissue.
p4: High-grade versus low-grade tumor tissue.
In CLDN7, a single CpG site (no. 42) showed significant hypomethylation in CRC tissue (p < 0.001) (Figure 5, Table 5).

DNA methylation profile of the CLDN7 gene. Upper: Normal mucosa versus colorectal cancer tissue. Lower: High- grade versus low-grade colorectal cancer tissue. Lines show mean values.
DNA methylated fraction of the CpG sites in the CLDN7 gene in normal tissues and high- or low-grade CRC.
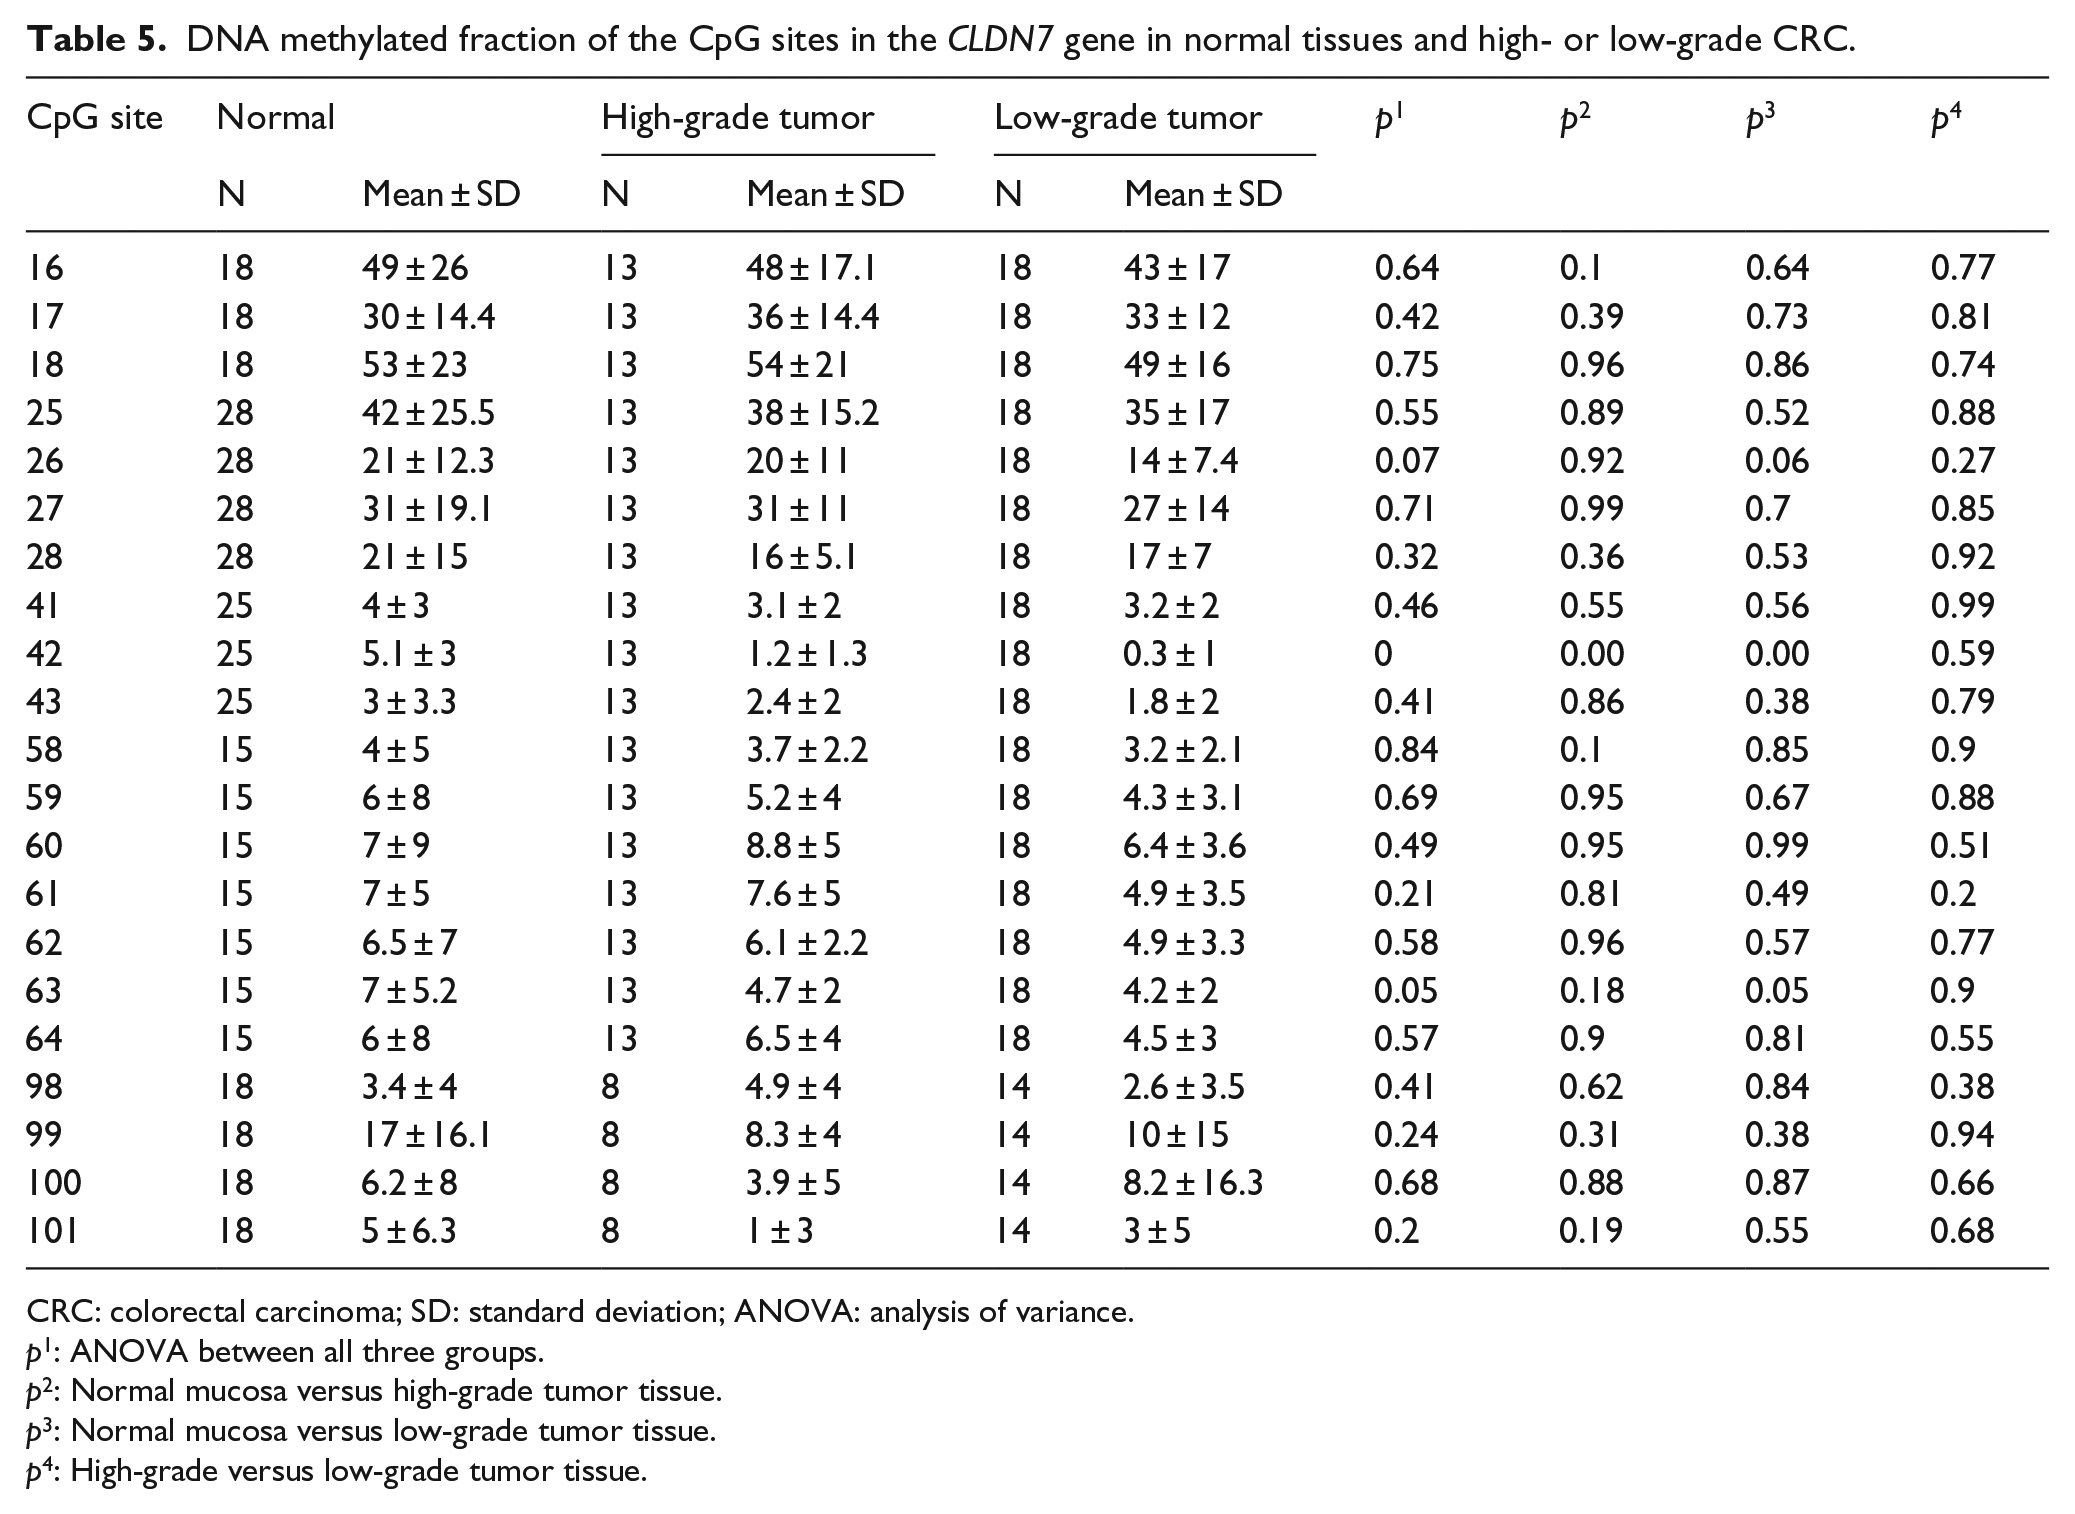
CRC: colorectal carcinoma; SD: standard deviation; ANOVA: analysis of variance.
p1: ANOVA between all three groups.
p2: Normal mucosa versus high-grade tumor tissue.
p3: Normal mucosa versus low-grade tumor tissue.
p4: High-grade versus low-grade tumor tissue.
Discussion
TJs have recently been targets of many studies regarding their role in the development of cancer.8–12 We show here that cell membrane staining for claudin 1, 4, and 7 is stronger in normal mucosa than in CRC samples. In contrast, cytoplasmic staining appeared higher for claudin 1 and 4 in several CRC cases, whereas ANNM cytoplasm showed no staining for claudins in any patient. Tumor tissues were significantly hypomethylated as compared to normal mucosa in CLDN1. In CLDN4 and 7, a single CpG site for each was significantly hypomethylated as compared to ANNM.
Current reports indicate that CLDN gene expression is regularly changed in several cancer forms, being up- or downregulated according to the tissue affected by cancer.13,14 A previous study showed that high CLDN1 expression in CRC is associated with better prognosis. 15 Similar results were reported by other researchers as well in different types of cancers,9,16,17 while other studies claim that upregulated CLDN1 is associated with higher risk of CRC and hepatic metastasis.18,19
Our results show that not only claudin 1 but also claudin 4 and 7 expression is significantly lower in tumor samples than in ANNM samples. Similar findings were reported by previous studies showing that claudin 4 and 7 are important for maintaining TJs in normal tissues.8,19,20 However, opposite results for claudin 4 and 7 have been reported by other studies in different types of cancers,21,22 suggesting that the roles of the various claudins may be cancer and tissue specific.
We also found that claudin 1, 4, and 7 were frequently expressed in cytoplasm of CRC samples but there was no cytoplasmic expression of claudins in ANNM samples which is in accordance with previous studies showing cytoplasmic expression of claudins in different types of cancers.20,23,24 CLDN genes encode proteins that contains four transmembrane domains with their N- and C-terminal ends located in the cytoplasm, one possible explanation for these results could be the presence of mutations rendering claudins more sensitive to being cleaved off from cell membranes. Another possibility could be aberrant activation of multiple signaling pathways in colorectal cancer, causing the observed claudin mislocalization.
We found that CLDN1, 4, and 7 genes are hypomethylated in CRC samples as compared to normal mucosa tissues. Among them, CLDN1 was significantly hypomethylated in CRC samples (p < 0.05), whereas in CLDN4, only CpG site, that is, 24 was significantly hypomethylated in CRC samples while a trend was observed between other CpG sites. Moreover, in CRC samples, CLDN1 and CLDN4 showed lower membranous expression as compared to normal mucosa samples. Methylation status of CLDN1 and 4 has not been studied previously in CRC patients. However, there are studies on the methylation of CLDN4 in bladder and ovarian carcinoma, reporting that hypermethylation of CLDN4 is associated with lower expression of protein and vice versa.25,26 Similar results were reported on CLDN1 in breast cancer. 27 Our results challenge the previous findings about CLDN1 and CLDN4 methylation and association with claudin expression. Methylation of CLDN7 was not significantly different among CRC and ANNM samples in our study except for one CpG site, that is, 42 that was hypomethylated in CRC compared to ANNM. Nakayama et al. 28 reported that hypermethylation can lead to lower expression of CLDN 7 in CRC and is associated with progression of tumors. Similarly, downregulation of CLDN7 was reported in a breast cancer study showing that hypermethylation of promoter sequences for this gene leads to inactivation of the CLDN7 gene. 29
However, these reports do not consider the aberrant compartmentalization of claudin proteins that we describe here, and they did not use pyrosequencing to assess DNA methylation, which is now the gold standard method. Such methodological differences may explain the discrepancies between different studies on this topic. At any rate, in our hands, CLDN gene hypomethylation seems to be linked to changes in compartmentalization of the claudin proteins rather than simple up- or downregulation. Such changes could be linked to differences in biological properties of the tumors such as invasiveness, metastasis, and perhaps even prognosis. Detailed IHC studies of claudin expression patterns at the invasive front of CRC tumors will be the next step to further explore this possibility.
To our knowledge, this is the first study in which expression of claudin 1, 4, and 7 along with their methylation status is analyzed in paired CRC and ANNM samples. Our results indicate that membranous expression of claudin 1, 4, and 7 is decreased in CRC samples, whereas expression in the cytoplasmic compartment is absent in ANNM but a frequent finding in CRC tissues. In addition, we found CLDN1 to be significantly hypomethylated in tumor as compared to ANNM tissues. Methylation of the CLDN1 gene may thus be an important factor in the tumorigenesis of colorectal carcinoma and claudin 1, 4, and 7 may be suited as IHC markers for CRC. Future studies along these lines will resolve the potential clinical utility of these findings.
Footnotes
Acknowledgements
We thank Sanja A. Farkas for advice on the design of pyrosequencing methods.
Declaration of conflicting interests
The author(s) declared no potential conflicts of interest with respect to the research, authorship, and/or publication of this article.
Funding
This work was financially supported by Örebro Läns Landstings Forskningskommitté, Lions cancerfond, Uppsala-Örebro, and Nyckelfonden, Örebro.
References
Supplementary Material
Please find the following supplemental material available below.
For Open Access articles published under a Creative Commons License, all supplemental material carries the same license as the article it is associated with.
For non-Open Access articles published, all supplemental material carries a non-exclusive license, and permission requests for re-use of supplemental material or any part of supplemental material shall be sent directly to the copyright owner as specified in the copyright notice associated with the article.