
Abstract
Uncovering interactions between genes, gene networks, is important to increase our understanding of intrinsic cellular processes and responses to external stimuli such as drugs. Gene networks can be computationally inferred from repeated measurements of gene expression, using algorithms, which assume that each gene is controlled by only a small number of other proteins. Here, by extending the transcription network with cofactors (defined from protein-protein binding data) as active regulators, we identified the effective gene network, providing evidence of in-hubs in the gene regulatory networks of yeast. Then, using the notion that in-hub genes will be differentially expressed over several experimental conditions, we designed an algorithm, the HubDetector, enabling identification of in-hubs directly from gene expression data. Applying the HubDetector to 488 genome-wide expression profiles from two independent datasets, we identified putative in-hubs overlapping significantly with in-hubs in the effective gene network.
Introduction
In recent years, several shared features of biological networks, such as metabolic, protein-protein, and genetic networks, have been discovered (Barabási and Oltvai, 2004). Although most nodes (metabolites, proteins or genes) in these networks have few connections, some—referred to as “hubs”—have large numbers of connections. The discovery of hubs has led to superior immunization strategies (Pastor-Satorras and Vespignani, 2002) and improved efficiency in identifying protein interaction networks (Lappe and Holm, 2004). In addition the biological importance of protein hubs have been demonstrated by Jeong et al. (Jeong et al. 2001), where a correlation between high connectivity and lethality in yeast was found. Moreover, analysis of gene expression data and TF-DNA binding data has revealed that some TFs serve as out-hubs, thus regulating several other genes (Lee et al. 2002; Luscombe et al. 2004; Bergmann et al. 2004).
In contrast, the existence of in-hubs, genes having several incoming regulatory connections, has not yet been determined because of possible structural constraints limiting the number of TF binding sites in gene promoter regions. Analysis of TF-DNA binding data has shown a narrow in-degree distribution in the transcription regulation network (Lee et al. 2002).
Another limitation which also motivates our analysis is that since our current knowledge as represented by these data sources, is most likely incomplete, it would therefore be advantageous to find novel in-hubs directly from gene expression data. However, it has not yet been possible to identify in-hubs directly from gene expression data by using network reconstruction algorithms because these algorithms suffer from a complexity problem (Gardner and Faith, 2005; Tegnér et al. 2003; Tegnér and Björkegren, 2007; Bansal et al. 2007; Han et al. 2004). As an illustration, consider the problem of identifying all incoming connections 3 to a given gene. This corresponds to choosing k predictive genes out of
The paper is organized as follows. In the first part of we assess the existence of in-hubs in the yeast network by integrating transcription and protein–protein binding data into what we refer to as the effective gene network. Then, in the second part we develop an algorithm—the HubDetector— which can identify in-hubs as defined by the effective gene network directly from gene expression data. The HubDetector is evaluated
Results
Identification of an Effective Gene to Gene Network by Data Integration
In a gene network the genes are nodes and directed edges represent regulatory interactions between regulators and a target genes. This is in contrast to edges in the transcription factor network since the edges in a gene regulatory network often involve multiple complex interactions involving indirect pathways of protein and metabolites (Brazhnik et al. 2002; Blais and Dynlacht, 2005). One example of protein-protein interactions mediating signals from a regulator via a TF to a target gene is found in the galactose utilization pathway, in which the TF Gal4p is modulated by Gal3p and Gal80p (Blais and Dynlacht, 2005; Ideker et al. 2001). This principle is illustrated by analysis of the MET3 network (Fig. 1a). When only the strict TF network was considered, no gene had more than 16 incoming edges (Fig. 1b). However, when proteins binding to a TF were considered as active cofactors some genes had 40 or more incoming edges. Importantly, most genes had few edges regardless of whether the strict TF network or protein-TF interactions were considered. To further justify that it makes biological sense to include proteins binding to TFs we assessed the fraction of genes annotated to the gene ontology category “transcription regulation activity”. Table 1 shows cofactor proteins are known to be involved in transcription regulation in 26.7% of the cases. This is less than the well characterized set of TFs (68.7%) but significantly higher than for all genes (7.1%;
Hub-genes in the effective regulatory network.


Proteins that bind to TFs influence gene expression. (
To calculate the number of incoming edges to a given gene in the yeast network, we collapsed the protein–protein and transcription networks into what we refer to as the effective gene network (Fig. 2 and Methods). By defining the effective gene network in yeast from these data sources, we could calculate the average number of connections between all yeast verified ORFs (Cherry et al. 1998), the 300 most-regulated genes (in-hubs), and 237 most regulating genes (out-hubs) (Table 1). In-hubs had an average of 24.4 incoming edges, whereas out-hubs had only slightly more incoming edges than the average for all genes (6.0 versus 4.2). Moreover, 46.4% of the out-hubs, but only 12.6% of the in-hubs, were involved in transcription regulation. Thus, by integrating currently available data of TF and protein binding, we find evidence for the existence of in-hubs in the regulatory network of yeast. Moreover, out-hubs (many of which are TFs) appeared to be mostly distinct from in-hubs.

Collapsing protein–protein and TF–DNA networks into an effective gene network. When the network of interactions between eight hypothetical genes and their respective protein neighbors (left) is collapsed into an effective gene network (right), each protein interaction with a TF constitutes a regulatory edge to the TF targets. For example, in the gene–protein network, protein d interacts with TF g, which in turn regulates the expression of gene E. In the effective gene network, gene D is therefore a regulator of the expression of gene E. The number of regulating connections (in-degrees), is shown in parenthesis within the gene symbols in the effective gene network.
Design and evaluation of the HubDetector algorithm in silico
In-hubs have been difficult to detect directly from gene expression data. There are several explanations for this. Current approaches for identifying networks from gene expression datasets cannot detect in-hubs, since the combinatorial complexity is too great when there are several in-coming edges (Gardner and Faith, 2005; Tegnér et al. 2003; Tegnér and Björkegren, 2007; Bansal et al. 2007; Han et al. 2004). Moreover, our current knowledge of the yeast network is based on available experimental datasets and is therefore incomplete. Moreover, different cellular conditions activate different subsets of in-hubs, leaving some inactive and undetectable (Luscombe et al. 2004). To identify active in-hubs under different cellular conditions directly from gene expression data, without prior knowledge of the architecture of the gene network, we designed an algorithm referred to as HubDetector. The HubDetector algorithm is based on the idea that perturbations, (genetic or changes to the cellular environment) more often affect the transcription of in-hubs than other genes in the network, due to the larger number of incoming edges (Fig. 3).

Design of the HubDetector algorithm. HubDetector is based on the rather simple idea that genes that are differentially expressed often in different internal/external conditions are more likely to be in-hubs. The rationale for this hypothesis is illustrated with a simple network (
Using random
HubDetector performance on gene expression profiles generated from linear network models with 4000 nodes.
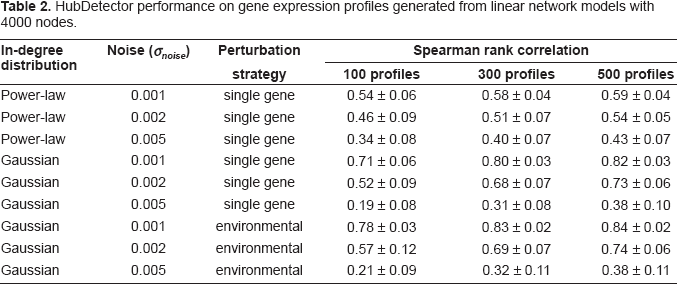

The HubScore as a function of in-degree in simulated gene networks after 100, 300 and 500 single gene perturbation experiments. The results are based on simulations of gene networks with a gaussian in-degree distribution and
Validation of the HubDetector using gene expression data
To further validate the HubDetector we analyzed to two publicly available whole-genome yeast expression datasets. From dataset A (Hughes et al. 2000), we used 273 of 300 gene expression profiles generated from mostly nonlethal deletions. Dataset B (Mnaimneh et al. 2004), generated more recently, consisted of 215 expression profiles from yeast cultures with titratable promoters of genes essential for cell survival. From each dataset, HubDetector generated a list of genes ranked according to their HubScores (see Supplementary Data on-line). The observed relation between the HubScore and the number of regulatory interactions of each gene in the effective network (Fig. 5a and b) clearly demonstrates that the HubDetector identifies in-hubs. The correlations between the HubScore and the number of regulatory interactions are 0.18 (

Validation of HubDetector using two independent gene expression datasets from S. cerevisiae. (a–b) The number of regulatory interactions as calculated from the effective gene networks, shown as a function of the HubScore generated by the HubDetector. HubDetector was applied to two datasets: (
Discussion
In this study we considered proteins binding to transcription factors acting as transcription co-factors and thus regulating the target gene of that TF. The function of proteins binding to TFs acting as functional cofactors were supported by Gene ontology analysis revealing an over-representation of gene ontology function “Transcription regulator activity”. Our analysis uncovered a significantly broader in-degree distribution of the target genes, thus supporting the existence of in-hubs in gene regulatory networks of yeast.
To enable the prediction of in-hubs directly from gene expression data we introduced an algorithm, the HubDetector. Validation of the HubDetector using two distinct gene expression datasets independently showed statistically significant correlations between the HubScore and the number of incoming edges in the effective gene network. It should be noted that the genes that the HubDetector identifies are the genes changing expression most often between different cellular states these, differ from the genes with the highest variance as studied in Bilu and Barkai (2005).
Interestingly, several of the identified in-hubs from the expression data were identical to in-hubs recovered from the integration of protein–protein interactions with TF–DNA binding data. It should be noted the HubDetector also identifies several putative and novel in-hubs which do not have many incoming edges in the effective network which was constructed in the first part of this work.
Rung et al. (2002) proposed a disruption network reconstruction algorithm based on the idea that whenever the expression level of a gene is changed by the deletion of another gene a putative interaction has been identified. Our study reveals that it is possible to interpret some hubs in a disruption network as putative in-hubs. However, in contrast to the disruption network reconstruction, the HubDetector is applicable not only to specific perturbations like gene deletions but also to non-specific perturbations like distinct cellular or environmental states.
Using the HubDetector does not require a complete identification of all interactions within the network. Thus, the HubDetector bypasses the limitations of current high-resolution network identification algorithms since the
Out-hubs (many of which are TFs) are important regulators of cellular activities and therefore are considered to be good drug targets (Butt and Karathanasis, 1995). In-hubs are instead highly regulated, maybe acting as sensors of intra- and extra-cellular environments, such as altered growth conditions or unfavorably states (i.e. diseases), and providing this information to the appropriate out-hubs. Thus, in-hubs merit further attention in future studies.
Materials and Methods
Gene Identifiers
The analysis in this study is restricted to verified ORFs, symbols and names for 4517 ORFs where downloaded from from Saccharomyces Genome Database (Cherry et al. 1998) in February 2007.
Construction of the Effective Gene Network in Yeast
Transcription regulation interaction data were downloaded from http://fraenkel.mit.edu/improvedmap/orfs by factor.tar.gz in January 2007 (MacIsaac et al. 2006). In our analysis we are using the 4900 edges between 2022 genes described in the file orfs by factor p 0.005 cons2.txt. Protein–protein binding data were collected from the Database of Interacting Proteins (DIP) in March 2007 (Xenarios et al. 2000), only including the high-confidence interactions (Deane et al. 2002) resulted in a Protein–Protein interaction (PPI) network involving 5562 interactions between 2310 proteins.
We used the edges in the transcription network to define a first set edges in the effective gene network. Then, for a given TF node in the transcription network, we identified all the proteins that bind to that TF. For this TF, a second set of edges are added from each binding protein to each target gene which is regulated by the TF via a primary edge. By repeating this procedure for all TFs an effective gene network was constructed. The effective gene network, constructed from the transcription network and protein–protein datasets referred to above, has 18 949 regulatory edges and 2085 genes connected by at least one edge.
In-silico Gene Network Architecture and Computational Model
In agreement with previous experimental studies of biological networks, we used a wide out-degree distribution of the

where
Generation of In-Silico Gene Expression Data
Without any external force on the system (
White noise is added to the expression values before differentially expressed genes are identified. The noise is normally distributed (around 0) with standard deviation
Genome-wide Expression Datasets
Two public S. cerevisiae genome-wide expression datasets were used. Dataset A (Hughes et al. 2000) contains 300 genome-wide expression profiles mainly from gene deletions. Aneuploid deletion strains and repeated deletions were removed (Supplementary Table on-line), leaving 273 perturbation experiments. We used the error model from (Hughes et al. 2000) and a threshold p-value of 0.01 to find Differentially expressed genes. Dataset B (Mnaimneh et al. 2004) consists of genome-wide expression profiles from perturbations of 215 expression profiles generated from yeast cultures with titratable promoters of genes essential for cell survival. Since dataset B did not include control experiments to estimate gene variance we instead regarded genes with twofold expression change (perturbed state versus wild-type) as differentially expressed.
HubDetector Algorithm
The HubDetector algorithm ranks the genes according to the number of times they are differentially expressed across a set of expression profiles. The HubScore for gene

Where
Statistics
P-values based on spearman rank correlation is computed through a Fisher transformation. P-values for enriched gene sets (GO-analysis) are estimated using hypergeometric distributions.
Software
Computations and simulations were performed in Mathematica 5.2 (Wolfram Research, 2005).
Footnotes
Acknowledgments
This research was supported by Swedish Knowledge Foundation through the Industrial PhD programme in Medical Bioinformatics at the Strategy and Development Office (SDO) at Karolinska Institutet, the Swedish Research Council, Carl Trygger foundation, Ake Wiberg foundation, Clinical Gene Networks AB and Linköping Institute of Technology.
Additional Files
Supplementry Materials