
Abstract
Innate immune response involves protein–protein interactions, deoxyribonucleic acid (DNA)–protein interactions and signaling cascades. So far, thousands of protein–protein interactions have been curated as a static interaction map. However, protein–protein interactions involved in innate immune response are dynamic. We recorded the dynamics in the interactome during innate immune response by combining gene expression data of lipopolysaccharide (LPS)-stimulated dendritic cells with protein–protein interactions data. We identified the differences in interactome during innate immune response by constructing differential networks and identifying protein modules, which were up-/down-regulated at each stage during the innate immune response. For each protein complex, we identified enriched biological processes and pathways. In addition, we identified core interactions that are conserved throughout the innate immune response and their enriched gene ontology terms and pathways. We defined two novel measures to assess the differences between network maps at different time points. We found that the protein interaction network at 1 hour after LPS stimulation has the highest interactions protein ratio, which indicates a role for proteins with large number of interactions in innate immune response. A pairwise differential matrix allows for the global visualization of the differences between different networks. We investigated the toll-like receptor subnetwork and found that S100A8 is down-regulated in dendritic cells after LPS stimulation. Identified protein complexes have a crucial role not only in innate immunity, but also in circadian rhythms, pathways involved in cancer, and p53 pathways. The study confirmed previous work that reported a strong correlation between cancer and immunity.
Keywords
Background
The immune system of a host defends it against invading pathogens, and it has two main subsystems: innate immunity and acquired immunity. 1 To initiate immune responses, it is crucial that the immune system can recognize pathogens. Recognition of pathogens is mediated by pattern-recognition receptors (PRRs) that recognize pathogen-associated molecular patterns (PAMPs), which are molecular structures that are common in pathogens.2,3 Once a PAMP has been recognized, PRRs initiate signaling cascades to achieve the first line of defense toward invading pathogens. 3 A group of major players in innate immunity response are toll-like receptors (TLRs), which are transmembrane proteins 3 that are specialized to recognize pathogens.4,5 The specificity of TLRs is based on PRRs, which recognize different PAMPs 6 such as nucleic acids, lipids, lipoproteins, and proteins from different pathogens such as viruses, fungi, bacteria, and parasites.6,7 One of the TLR member proteins is TLR4, which can be stimulated by many PAMPs, including lipopolysaccharide (LPS), 8 an essential part of the structure of the outer membrane of gramnegative bacteria.
Once TLR4 recognizes LPS, it initiates signaling cascades of immune responses.8,9 The TLR signaling pathways can be divided into MyD88-dependent pathways and TRIF-dependent pathways. 7 In TLR members, TLR4 is unique in 7 that it is the only TLR member that uses both MyD88- and TRIF-dependent pathways.
Many cell types play key roles in the immune response. Since dendritic cells (DCs) are among the key players involved in the immune response, we used them in this study. DCs bridge innate immune responses to acquired immune responses. They utilize various innate immune receptors such as TLRs. 10 TLR4 stimulation by LPS induces the production of various cytokines and these, in turn, stimulate the cells and induce downstream-signaling pathways.7,11 Thus, understanding the signaling pathways invoked by LPS stimulation will improve our understanding of these pathways.
Advanced high-throughput technologies provided genome-wide information such as transcriptome data, which is essential for studying biological systems. Protein–protein interactions (PPIs) are crucial for every biological process. 12 All protein interactions that exist in a specific organism form an interactome. Studying biological process in the context of the interactome provides a system-wide understanding of a given process. 12 Protein interaction networks are represented by nodes and edges where nodes represent proteins, while edges represent interactions between proteins. 13 Though the innate immune response has been extensively studied, key questions remain. For example, it is not known how protein interaction networks differ during innate immune responses, what the important protein complexes at different stages during innate immune response are, and which protein interactions are conserved during innate immune responses.
In this study, we attempt to address these issues by combining PPIs with gene expression data. Combining PPIs and expression data has been done before.14,15 A previous study examined the dynamic structure of a human protein interactome to determine if changes in an interactome organization could be used to predict patient outcomes. 15 Another study has applied a network-based approach to identify markers for breast cancer that are correlated with metastasis. 14 Using a network-based approach in which expression data was combined with PPIs data, breast cancer markers were identified as protein interaction subnetworks. Genes with known mutations in breast cancer were not detected by typical differential expression analysis, but they did connect many differentially expressed genes, indicating that they do play an important role.
Taken together, these studies indicated that using PPIs in combination with gene expression data leads to better results than using either expression or PPI data alone. In this study, we combined PPIs with time-series gene expression data to study interactome dynamics in order to identify interactome differences across different stages of the innate immune response.
Methods
Cell culture
Bone marrow cells were prepared from C57BL6/J mice. The cells were seeded into a 24-well plate at a concentration of 1 × 10 6 cells/mL, and they were cultured in Roswell Park Memorial Institute (RPMI) medium containing 10% fetal bovine serum and 10 ng/mL of granulocyte–macrophage colony-stimulating factor purchased from PeproTech (PeproTech, Rocky Hill, NJ, USA) for 6 days, and the culture medium was changed every 2 days. Six days later, floating cells were major histocompatibility complex (MHC) class2+CD11c+, which is a molecular hallmark of DCs. 16 The cells were collected and suspended in RPMI containing 10% fetal calf serum. LPS (Re595, purchased from Sigma-Aldrich, St Louis, MO, USA) were added at the concentration of 100 ng/mL and at 0 hours, 0.5 hours, 1 hour, 2 hours, 3 hours, 4 hours, 6 hours, 8 hours, 16 hours, and 24 hours later, the cells were collected and lysed in TRIzol (Life Technologies, Carlsbad, CA, USA). Ribonucleic acid (RNA) extraction was performed according to the manufacturer's instruction. Cells were subjected to TSS-Seq analysis as previously described, 17 where the TSS-Seq tag library was constructed by combination of the oligo-capping method with massively parallel sequencing. 17
TSS-Seq data
TSS-Seq data generated in this study were mapped to mouse genome mm9
18
using Bowtie.
19
We constructed a gene model that is slightly different from that used by Tsuchihara et al
17
in that for each Ensembl gene,
17
if the intergenic distance between a gene and its preceding gene is greater than or equal to 50 kb, we counted tags upstream of the TSS up to 50 kb. If the distance is less than 50 kb, the tags were counted upstream of TSS with distance equal to the intergenic region. Biomart
20
was used to import gene features. Tag count was done based on the gene model. Counts were smoothed by add one smoothing; then filtered, normalized, and differentially expressed genes were identified based on a
GO enrichment analysis for the top 100 differentially expressed genes showed high enrichment for the GO term “immune responses”, which indicates the importance of differentially expressed genes in the immune response.
Protein–protein interaction data
We prepared a set of unique mouse interactions from publicly available protein interactions. PPIs were collected from the PPIs databases, InnateDB 23 and HitPredict. 24 Network visualization and analysis was done using Cytoscape. 25 Cytoscape plugins used for the network analysis included MCODE, 26 and Network Analyzer. 27 Network edges were weighted by Pearson's correlation coefficient of gene co-expression.
Time-specific networks
We defined an interactome map for each time point during the innate immune response based on gene expression values at that time point. We constructed networks of proteins that are encoded by genes, which showed significant up-/down-regulation after stimulation for each time point. In this study, we considered proteins encoded by the genes that show up-regulation by fourfold or more to be up-regulated proteins, and those encoded by genes that are down-regulated by four fold or more were regarded as down-regulated proteins. We constructed nine time-specific networks.
Differential networks
From the time-specific networks, we constructed differential networks between two successive time points such that differential network between time t1 and t2 only had interactions that were unique to the t1 network but not to the t2 network, as shown in Figure 1. We identified differences in the PPIs networks between two consecutive time points by constructing differential maps.
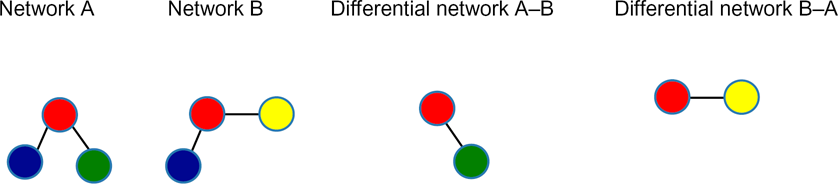
Differential networks.
Module identification and scoring – feature-weighted score
Protein modules were identified based on the density of the protein complex using Cytoscape plugin, MCODE. 25
Identified modules were scored using a novel scoring method to assess the significance of an identified module. The feature-weighted score is based on the following factors:
Module's density, as expressed by a clustering coefficient (MCODE score).
GO enrichment of the module nodes and whether the enrichment is statistically significant.
Proportion of differentially expressed genes in the module.
The average co-expression correlation coefficient of interactions in the module that reflect the co-expression of any two interacting partners.
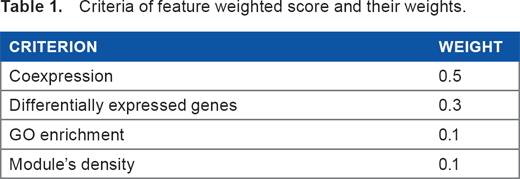
Weights and the score calculation for each criteria are shown in Table 1. We calculated the weighted mean and called it a feature-weighted score and scored each identified module by the corresponding score.
Criteria of feature weighted score and their weights.
The
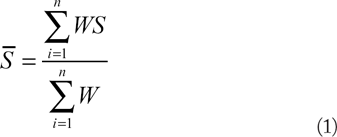
Where S is the score of each criterion in a protein complex; W is the weight of each criterion; and N = 4 (as we included four criteria in the score).
We minimized errors to avoid spurious scores as follows:
Co-expression scores of self-loops were ignored;
If the average PCC for co-expression was negative, it was replaced with zero; and
If the assigned GO term was significant, the score = 1; otherwise, the score = 0.
The weight of each criterion was assigned based on the significance of each criterion. For example, we assigned co-expression a weight of 0.5, as co-expression is the most important factor in ranking the significance of a module. GO enrichment was assigned a weight of 0.1, as it is the least significant criterion, and a module with no significant GO enrichment may still play an important role in immunity. Modules were classified into highly significant, significant, or less significant modules based on their respective scores. Identified modules were compared with protein complexes in the CORUM database, a database of protein complexes in mammals. 28
Interactions protein ratio (IPR)
The IPR for a network is defined as the ratio of the total number of interactions to the total number of proteins in the network.
IPR can be determined by the following equation:
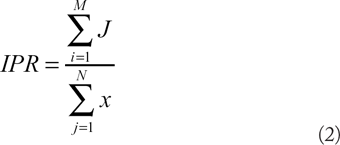
It may be also expressed as:
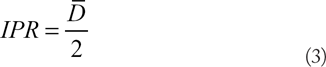
where J is an interaction in a network; x is a protein in a network; M is the total number of interactions in the subnetwork; N is the total number of proteins in the subnetwork; D is the degree of a protein in the network; and
The node degree is defined as the number of interactions that the node has. The proof of Equation 3 is in Supplementary data.
To determine the significance of IPR, we constructed 1,000 random networks that were the same size as the time-specific networks, and we calculated the IPR for each randomized network. We compared the IPRs of the time-specific and randomized networks and calculated
Pairwise differential matrix (PWDM)
PWDM is a matrix for normalized differences between each pair of networks specific for each time point. PWDM can be used to express differences in nodes or interactions between networks. Heatmaps and figures were made using R. 29
GO and KEGG enrichment
All GO term and KEGG pathway 30 enrichment analyses were done using DAVID.31,32
Results
Interactome dynamics: global overview
To reveal interactome dynamics during the innate immune response, we constructed a network of all unique PPIs from the databases InnateDB and HitPredict. The constructed network has 4,822 proteins with 10,549 interactions; we identified their expression patterns. In the interaction network, each protein was represented by a node where the node size represented the degree of interactions of the protein. To acquire a global view of interactome dynamics during the innate immune response, we identified the time point that had the largest number of interactions resulting from the smallest number of up-/down-regulated genes after stimulation with LPS. We considered interactome dynamics from two perspectives: First, we identified protein complexes from a network of proteins that are encoded by genes that show differential expression during the whole time course of an innate immune response. These proteins and their interactions constitute a differentially expressed network. Second, we identified differences in the up-/down-regulation of an interactome between two consecutive time points during an innate immune response (differential networks), as well as core proteins/interactions that were conserved in an interactome during the innate immune responses. Protein modules were identified from each differential network and were scored as shown in Equation 1, as described in the Methods section. The modules were classified into highly significant, significant, and less significant modules based on the score of each module.
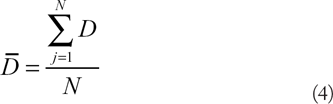
Interaction protein ratio (IPR) during the innate immune response
A previous study has reported that proteins with the highest number of interactions are the most essential proteins for survival. 33 We asked which time point after LPS stimulation is most essential for an innate immune response.
In order to determine the time point at which the largest number of up-/down-regulation occurs, we calculated the IPR of both up- and down-regulated proteins separately in each time-specific network, as shown in Figure 2. We found that the point with highest IPR was 1 hour after stimulation. This indicates that up-/down-regulated proteins at 1 hour may have the largest effect on the interactome during an innate immune response. The difference in IPR between 0.5 hours and 1 hour is small, but it is statistically significant (
Interactions protein ratio (IPR) during immune response.
Hubs in innate immune response
We found that networks that were constructed from up-/down-regulated genes had a high IPR, which indicated that these up-/down-regulated networks have a high number of hubs relative to the random networks, suggesting a role for those hubs in the innate immune response.
Differentially expressed network
We constructed a network of PPIs for differentially expressed proteins and their interactors. Differentially expressed proteins are proteins whose genes showed statistically significant changes in expression throughout the whole time course of the innate immune response. The network of differentially expressed proteins consists of 3,379 proteins with 5,472 interactions. We identified protein modules from this network using MCODE 25 and scored them, as described in the Methods section.
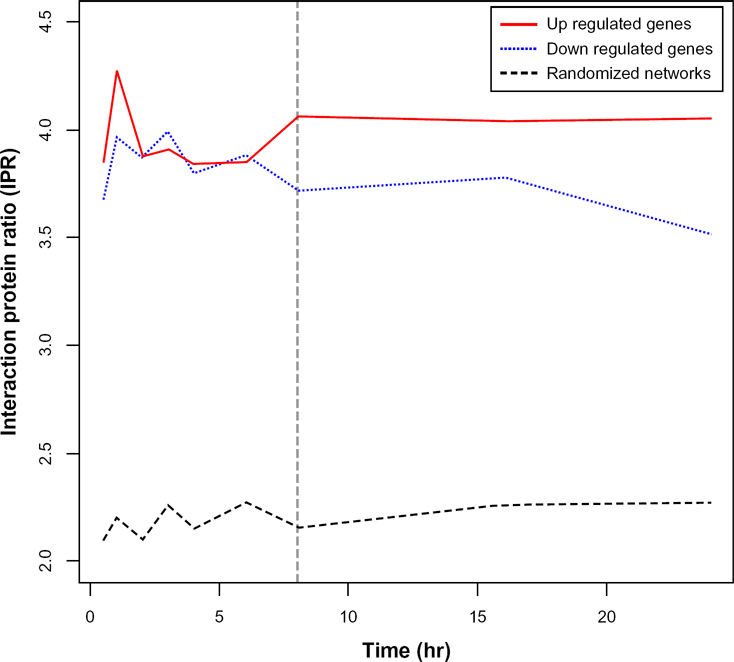
Four of the functionally significant modules with their GO analysis and enriched KEGG pathways are listed in Table 2. All 47 modules identified from the differentially expressed network are noted in Table S1. Many identified modules are listed in the CORUM database, which confirms the quality of our data.
Four identified protein modules from network of differentially expressed proteins with their GO biological processes and KEGG pathways.
Many modules have functions related to immunity. Several modules are also enriched for pathways in cancer, such as leukemia. A link between innate immunity and cancer has been previously reported. 34 Among highly significant modules is the PRIM1-PRIM2-POLA1-POLA2 module, which has a score of 0.61. This module is listed in CORUM 28 database. Another example is the SAP30–SIN3B–IFRD1 module, which has a score of 0.28 and forms a part of a bigger complex in the CORUM database. The JAK-STAT module has a score of 0.7. In addition, the CCR3–CCR5–CCL4–CCBP complex has a score of 0.535. A few of the identified modules have high scores, but they do not have significant GO enrichment. These modules have many differentially expressed genes and need further investigation to determine their exact role in innate immunity, such as NPHP1-NPHP4-RPGRIB1L (which has a score of 0.41) and PSTPIP1-FAS1-PTPN12, which has a score of 0.34.
Core PPI network
Conserved interactions during innate immune responses are those that exist in all interaction maps during the innate immune response. We identified proteins and interactions that are conserved in all time-specific interactome maps during the innate immune response and constructed a network of 390 proteins with 198 interactions, as shown in Figure 3. GO 22 and KEGG 30 pathway analysis results (Table S2) showed enrichment for biological processes such as immune system development and protein kinase cascade, while the KEGG pathway analysis showed enrichment across pathways involved in cancer and in the TLR signaling pathway. This further confirms a relationship between cancer and immunity, as reported previously. 34 We validated our pathway enrichment analysis by mapping genes in the KEGG pathways to the core interaction network. We found that the majority of core network members are involved in KEGG pathways, as illustrated in Figure S1.

Core interaction network for proteins and their interactions, which are common to all time points during the immune response.
We constructed the Trp53 network, a mouse homolog of p53, as shown in Figure S2, and found that many Trp53 interactors are differentially expressed due to LPS stimulation, which further confirms a relationship between the p53 pathway and LPS stimulation.
Differential networks
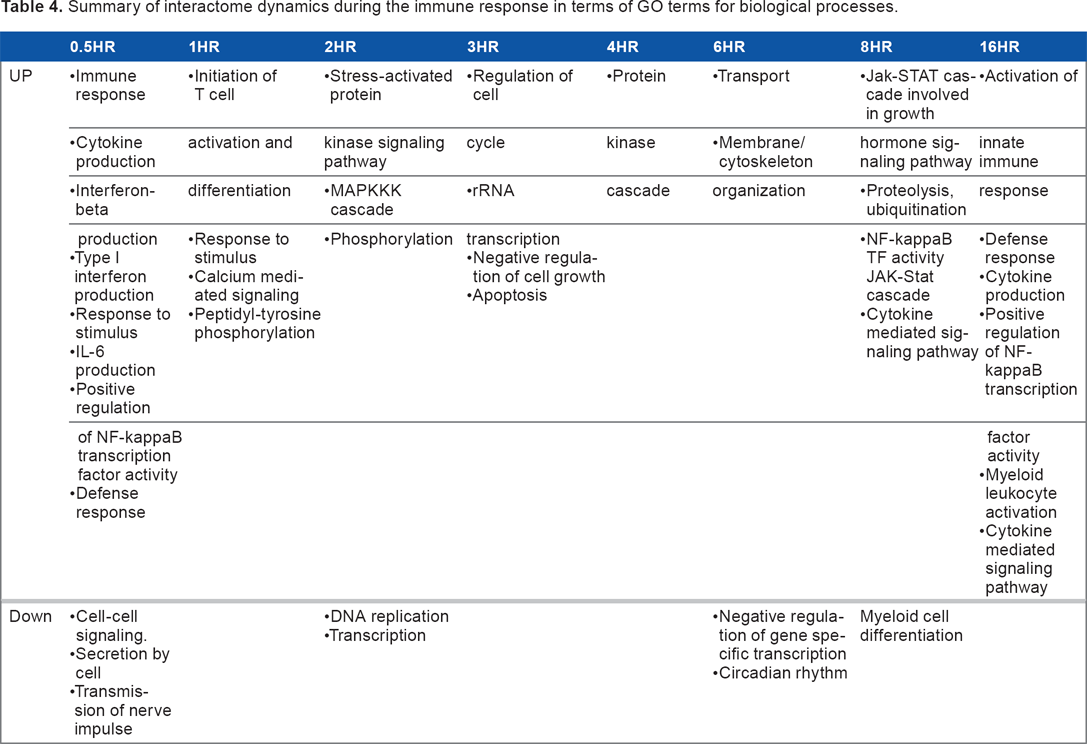
We constructed eight differential maps from nine PPI networks and identified protein complexes (modules) from each differential map, as described in the Methods section. Differential maps have been previously introduced in Bandyopadhyay et al. 35 Modules identified from the 0.5-hour–1-hour differential network with enriched GO biological process terms and KEGG pathways are noted in Table 3. Modules identified from other differential networks are noted in Table S3. For instance, the 0.5-hour network was characterized by down-regulation of the protein complex, which consisted of SYT1–CLSTN1–SYP–VAMP2–ATP60A1 subunits. This module is responsible for transmission of nerve impulse and cell–cell signaling. In addition, 0.5 hours after stimulation, interactome was characterized by up-regulation of the TICAM1/TBK1/TRAF6 subunits of a protein complex that consists of TICAM1–TBK1–TRAF6–TLR3. This protein module has an extremely important role in the innate immune response. Moreover, the TICAM1–TBK1–TRAF6–TLR3 complex exists in the 16-hour-24-hour differential network, with all of its subunits up-regulated. Identified modules also showed changes in their expression behavior. For example, the TICAM1–TBK1–TRAF6–TLR3 module was identified at 0.5 hours, where TLR3 is significantly down-regulated. However, the same modules identified at 16 hours showed that Tlr3 was significantly up-regulated. TICAM1 was significantly up-regulated at both 0.5 hours and 16 hours. In the 6-hour–8-hour differential network, we identified a protein complex that is related to circadian rhythms and consists of the CRY2–PER3–PER2 subunits. This complex is down-regulated during innate immune responses and shows up-regulation beginning at 16 hours after stimulation. The CRY2–PER3–PER2 module has a score of 0.89, indicating that it is highly significant. From modules that were functionally identified during the innate immune response, we summarized their interactome dynamics during the immune response in terms of their biological processes (as per GO terms), as noted in Table 4.
Four identified modules from the 0.5-hour–1-hour differential network with their GO biological processes and KEGG pathways.

Summary of interactome dynamics during the immune response in terms of GO terms for biological processes.
Pairwise differential matrix (PWDM)
For a more efficient visualization of the differences or similarities between the PPI maps at different time points throughout the immune response, we introduced the PWDM, which quantified the changes between networks at any two time points, allowing for a global view of these changes.
PWDM can be used to assess the differences between different networks. In this study, we used PWDM to assess the differences between time-specific networks throughout the experimental time course (differential network). We quantified these changes as changes in the number of nodes or interactions. The asymmetry of the heatmap can be explained by considering Figure 1. If we have two networks (A and B), the differential network A–B is different from the differential network B–A, as the interactions specific to network A are different from the interactions specific to network B. The PWDM heatmap showed that the half-hour network is the most different from other networks during the innate immune response. It also showed that the largest changes in the interactome between each of the two successive networks occurs at the transition from 0.5 hours to 1 hour. Figure 4 shows the heatmap for changes in interactions between time-specific networks. This is in line with the IPR values, which indicate that the networks show the greatest perturbation at 1 hour.
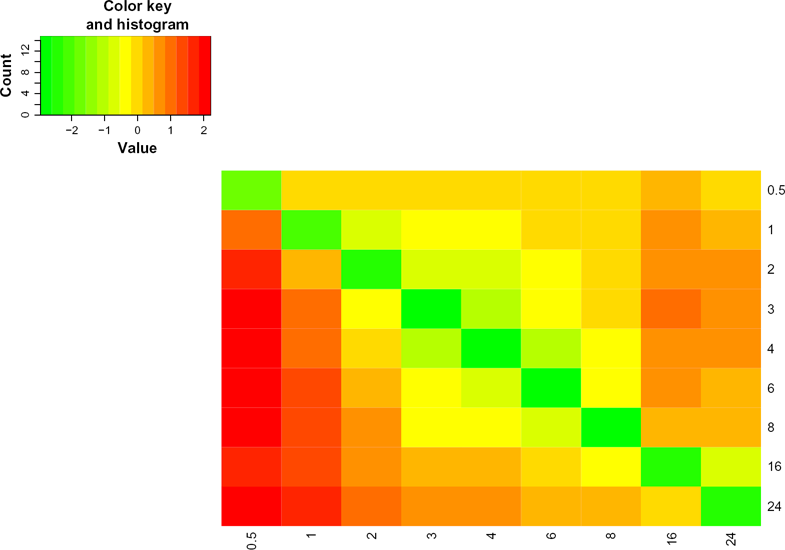
Pairwise differential matrix (PWDM).
Twenty-four hours after the stimulation of DC with LPS, the differences between the time-specific networks for each consecutive time point were the least pronounced at successive time points, with the exception of the transition between 0.5 hours to 1 hour. The half-hour network showed a greater difference with respect to the other time-specific networks (Fig. 4). All of the differences were normalized and transformed to Z-scores.
Toll-like receptor (TLR) interactome dynamics
TLRs play a crucial role in innate immunity. Mice have 12 TLRs, which are TLR1–TLR9, and TLR11–TLR13, where TLR10 is not functional. However, humans have ten TLRs (TLR1–TLR10). 7 We constructed a TLR network from all of the available mouse PPIs in our dataset. The network included eight TLRs (TLR2, TLR3, TLR4, TLR6, TLR7, TLR8, TLR9, and TLR13) with their interactors. We constructed a network of 49 proteins and 66 interactions. The heatmap of the TLR network members is shown in Figure 5. The TLR subnetwork dynamics are shown in Figure 6. The TLR subnetworks across the different time points during the innate immune response are noted in Figure S3.
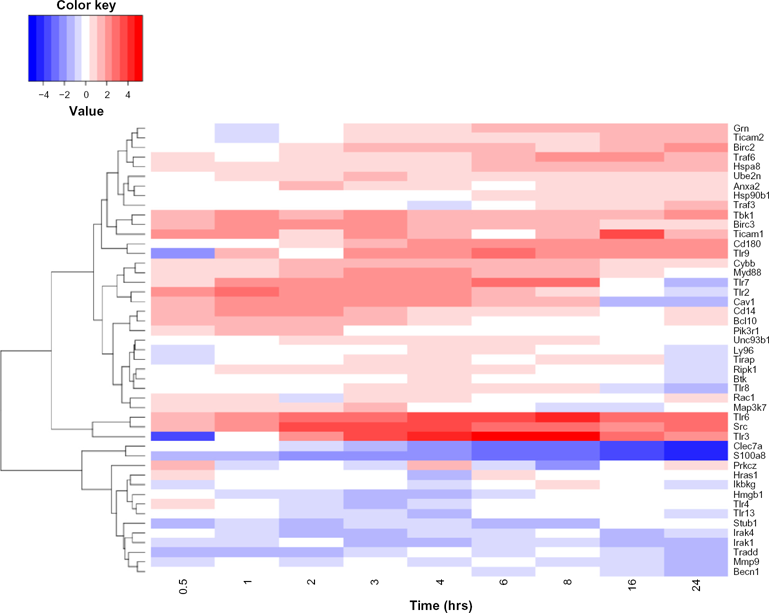
Heatmap of the TLR network genes during the time course after LPS stimulation.

The TLR interactome dynamics.
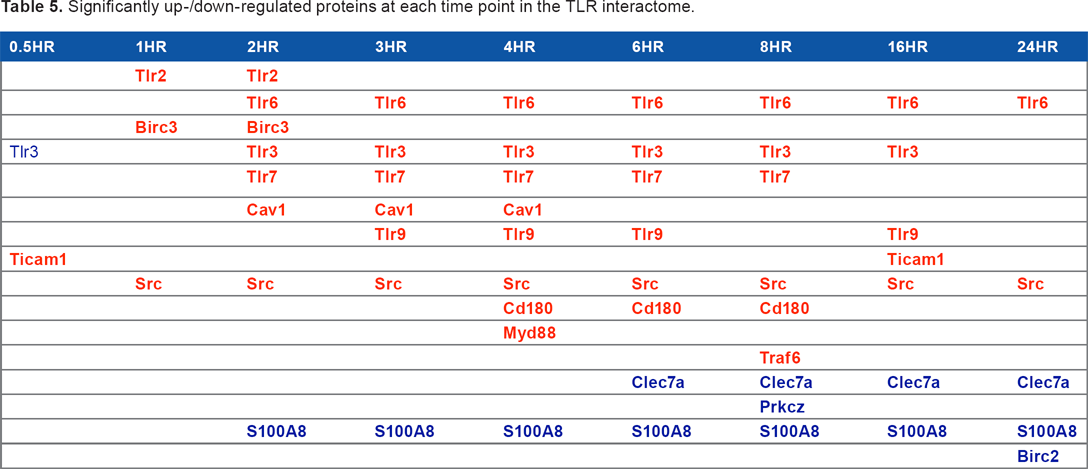
We found that half an hour after stimulation, TLRS was significantly down-regulated, while Ticam1 was significantly up-regulated. At 1 hour after stimulation, TLR2, SRC, and BIRC3 were significantly up-regulated. However, 2 hours after stimulation, TLR2, TLR3, TLR6, TLR7, SRC, CAV1, and BIRC3 showed significant up-regulation, while S100A8 showed significant down-regulation. Table 5 summarizes significant up-/down-regulations in TLR interactomes during the innate immune response.
Significantly up-/down-regulated proteins at each time point in the TLR interactome.
Interleukin subnetwork
In order to study cytokine subnetworks, we constructed an interleukin (IL) subnetwork (Fig. 7). IL12 is a cytokine known to have an inhibitory effect on tumorigenesis. It is also known to induce the regression of tumors. 36 In this study, we found the significant up-regulation of IL12 after LPS stimulation, which is in agreement with a previous study. 37 We further expanded the networks, as evident in Figure S4.
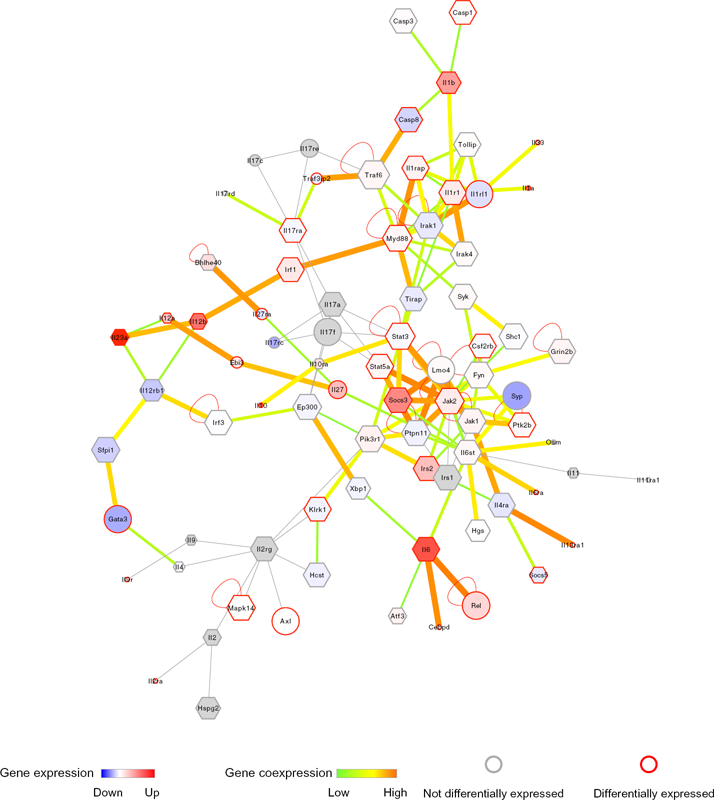
Interleukin subnetwork.
Network expansion is more informative, as it allows for the extraction of protein complexes from the network, which is not possible in smaller networks.
S100A8 down-regulation after LPS stimulation
S100A8, which is called calgranulin A or migration inhibitor factor-related protein 8, and S100A9 (also called calgranulin B), are members of the S100 calcium-binding protein family. S100A8 and S100A9 showed up-regulation in many inflammatory and autoimmune cases.38,39 S100A8 and S100A9 form a protein complex, which is generally known to play an inflammatory role. However, there are previous studies that suggested an anti-inflammatory role and immune-regulatory role for the S100A8/A9 complex.40–42 The modulation of inflammatory processes by the S100A8/A9 complex is both context- and cell-type-specific, which suggests that there is a complex network of regulation at play. The S100A8/A9 complex has both intracellular and extracellular functions. Among the intracellular functions is calcium binding.38,39 Released S100A8/A9 achieves extracellular functions, some of which are mediated by TLR4. 43 A previous study reported that S100A9 overexpression blocks DC differentiation. 44 In addition, it showed that those DCs that over-express S100A8/A9 have less ability to stimulate allogeneic T-cell proliferation than control DCs. 43 S100A8 showed down-regulation during differentiation of DCs, 44 but in this study, we found down-regulation of S100A8 following LPS stimulation. The down-regulation is more than fourfold from 2 hours~24 hours after LPS stimulation, as shown in Figure 4.
We constructed a subnetwork of three members of the S100 protein family (S100A8, S100A9, and S100A10), as illustrated in Figure 8. We found that there is a high correlation in the co-expression of S100A8 and S100A9 proteins, which is consistent with the properties of the subunits of a complex. S100A9 only interacts with S100A8; however, S100A8 interacts with S100A9, LY96, and TLR4 (as is evident in the S100A8/A9 subnetwork). The S100A10 protein, which is another member of the S100 protein family, interacts with Irak1, an important player in the TLR signaling pathways. We checked the co-expression of Zc3h12a with Sl00a8. Zc3h12 is a ribonuclease, and has an important role in controlling innate immune responses.
45
We found that there is a high co-expression of these two genes (
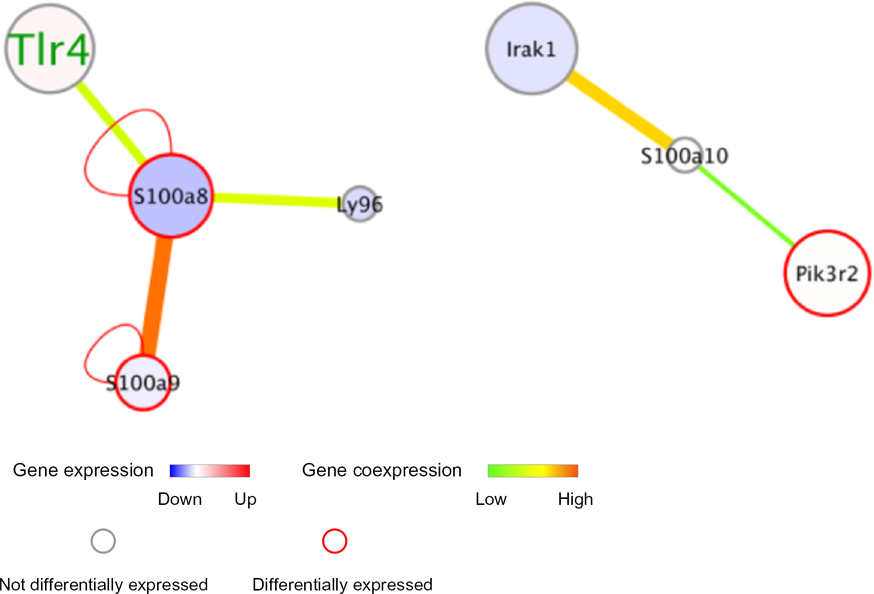
S100A8/A9 and S100a10 protein subnetworks.
Discussion
The goal of this study was to investigate interactome dynamics during the innate immune response. To achieve this goal, PPI data was combined with time series gene expression data. Combining PPIs with expression data is a well-established technique. One advantage of combining expression and PPI data is that it improves data reliability, as results supported by both expression and interaction data are more likely to be correct than results supported from either expression or interaction data alone. 46 To our best knowledge, this is the first study to infer innate immunity interactome dynamics by combining protein–protein interaction data with time series gene expression data followed by the identification of protein complexes.
Module identification is an essential step in network analysis, as protein subunits that form a protein complex have a higher probability of interacting with each other, and they have higher functional dependencies compared to other proteins in a network. 47 Understanding how protein complexes are arranged in the protein interaction network will increase our understanding of the coordination of cellular and biological processes. 47 Therefore, identifying protein complexes/modules in a protein interaction network will highlight the proteins that have physical and functional dependencies in a given network. When identifying interactome dynamics during the innate immune response, we considered the dynamics from two points of view: First, we identified protein modules in a differentially expressed network. We found that some identified modules have a role in innate immunity, cell cycle, signaling, phosphorylation, transcription, deoxyribonucleic acid (DNA) repair, chromosome organization, transport, development, and differentiation. In addition, some modules showed enrichment of the p53 pathway, as well as the pathways involved in cancer (such as colorectal cancer and acute myeloid leukemia). A previous study suggested the existence of specific features of innate immunity mediated by TLRs in tumors; this needs further investigation. 48
A direct interaction between cancer and the innate immune system has been reported.10,34 Different immune cells (including DCs, which are antigen-presenting cells) target cancer cells directly, acting as the bridge between innate and adaptive immunity and phagocytose apoptotic cancer cells. 10 Furthermore, TLRs play a role in sensing the endogenous molecules released from apoptotic cells.7,10 In addition, some identified modules from the differentially expressed network play a role in circadian rhythms (Table 2). A previous review had discussed a link between circadian rhythms and immunity. 49 Second, we identified protein modules specific to a certain time point. For instance, the half-hour time point following stimulation was characterized by upregulation of the gene-encoding proteins that were responsible for the innate immune response, cytokine production, interferon-beta production, IL-6 production, positive regulation of nuclear factor-kappa B transcription factor activity, and down-regulation of cell-cell signaling and transmission of the nerve impulse.
This study also introduces protein complexes as candidates that play a role in the innate immune response. However, identified protein modules need further experimental validation. This study can be used to predict the immune stage of a patient. This study also introduced PWDM, which is a novel way to assess the differences between different networks either in terms of the number of proteins or their interactions.
This study is based on an assumption that change in gene expression could reflect the change in protein abundance. A previous report 50 has proposed that the interactome can be affected due to changes in the abundance, sequence, or posttranslational modification changes in an individual protein. There is a possibility that interactions in modules with small average Pearson Correlation Coefficient are transient, occurring only at a certain time point. In addition, another study has reported that changes in human transcriptome can result in significant changes in interactome. 51 Future studies should consider adding various parameters like post-translational modification data to increase data reliability.
In addition, this study investigated the TLR network in a comprehensive way in terms of an interaction network-based analysis for the TLR-subnetwork. One of the limitations for this kind of study is the quality of PPI data. Some of the data in manually curated databases include some protein–DNA interactions that are stored as PPIs. Cleaner PPI databases will help improve such analyses. In addition, PPI databases include many spurious interactions that come from high throughput experiments.
Conclusion
This study has focused on an analysis of the dynamics of an innate immunity interactome, and it has identified protein modules that contain differentially expressed proteins. In addition, we identified protein modules that contain up-/down-regulated proteins specific to each time point in innate immune responses, as well as the biological roles and pathways involved in each module. We introduced IPR, which identifies the time point at which the least number of proteins with the largest number of interactions are up-/down-regulated. We also introduced PWDM, which allows for a global view of the differences between different networks. In this study, IPR identified 1 hour as the time point at which the least number of proteins with the greatest number of interactions were noted to be up-/down-regulated. We also found that the S100A8 protein is down-regulated during the innate immune response in DCs after LPS stimulation. Thus, we conclude that our analysis has helped in the understanding of the dynamic nature of the innate immune response.
Footnotes
Authors Contributions
AE designed the analysis, performed Tss-Seq data analysis, did protein–protein interaction network analysis, and wrote the manuscript under the guidance of AP and KN. YK performed LPS stimulation experiments, YS performed TSS-sequencing. All authors reviewed and approved of the final manuscript.
Acknowledgements
Most computations done using Human Genome Center supercomputer at University of Tokyo.