
Abstract
Breast cancer is a highly heterogeneous disorder characterized by dysregulated expression of number of genes and their cascades. It is one of the most common types of cancer in women posing serious health concerns globally. Recent developments and discovery of specific prognostic biomarkers have enabled its application toward developing personalized therapies. The basic premise of this study was to investigate key signature genes and signaling pathways involved in triple-negative breast cancer using bioinformatics approach. Microarray data set GSE65194 from the National Center for Biotechnology Information (NCBI) Gene Expression Omnibus was used for identification of differentially expressed genes (DEGs) using R software. Gene ontology and Kyoto Encyclopedia of Genes and Genome (KEGG) pathway enrichment analyses were carried out using the ClueGO plugin in Cytoscape software. The up-regulated DEGs were primarily engaged in the regulation of cell cycle, overexpression of spindle assembly checkpoint, and so on, whereas down-regulated DEGs were employed in alteration to major signaling pathways and metabolic reprogramming. The hub genes were identified using cytoHubba from protein-protein interaction (PPI) network for top up-regulated and down-regulated DEG’s plugin in Cytoscape software. The hub genes were validated as potential signature biomarkers by evaluating the overall survival percentage in breast cancer patients.
Keywords
Introduction
Breast cancer is one of the most commonly diagnosed cancers globally with about 2.26 million cases reported in 2020. Although this disease is considered to be largely predisposed in developed countries, but more than half of breast cancer cases were diagnosed and two third of breast cancer–related deaths were reported in the less developed regions.1,2 Of the known subtypes, triple-negative breast cancer (TNBC) is one of the most aggressive subtypes, accounting for 10% to 15% of all breast cancers. It is mainly characterized by the negative expression of estrogen (ER) and progesterone (PR) and human epidermal factor receptors (HER2). 3 The biological and clinical characteristics endowed in TNBC’s together with its aggressive nature disposes even younger women to experience deterioration and visceral metastases in comparison to other subtypes of breast cancer. Chemotherapy and radiation therapy remain the traditional therapeutic options for TNBC. 4 Studies have shown that, despite advances in pharmacologic research and disease treatments, still there are no effective treatments available for TNBC. The situation is more concernful, as the chances of recurrence and mortality of the patients are still not effectively controlled. As a result, TNBC continues to be a major challenge due to its poor prognosis, high probability rate of metastasis and limited curative options. 5
In recent years, integrated bioinformatics has been extensively applied in cancer research. 6 With continuous advancements, the bioinformatics tools have now frequently been exploited in the diagnosis, prognosis, and screening of cancers. 7 Numerous studies have shown the potential of integrating and using data sets to investigate the expression levels of several genes to predict prognosis of various cancer types.8,9 Thus, the use of bioinformatics in cancer research has opened up new avenues both for the development of diagnostic and prognostic markers as well as their use for improving the outcomes of cancer patients.10,11 A great progress has been achieved in understanding the genes that are differentially expressed in malignancies such as renal cell carcinoma, 12 prostate, 13 ovarian, 14 and other associated disorders.15-17 Many studies have found overexpression of CCNB1 in various cancers, such as pancreatic carcinoma 18 and lung carcinoma. 19 Likewise, Shi et al 20 demonstrated that ISL1-induced gastric cancer cell proliferation and carcinogenesis are mediated through the alteration in the expressions of genes like CCNB1, CCNB2, and C-MYC.
Breast cancer occurrence and advancement are a multistage process involving the synergistic action of number of genes. As a result, alteration in expression of these gene expressions has drawn interest in breast cancer for a long time. 21 Currently, some research investigations have looked into the genes that are expressed differentially in breast cancer patients. For instance, Chaun et al 22 demonstrated CXCR4 and CXCL10 as predictive biomarkers for TNBC. Similarly, Zhai et al 23 reported the investigation of NUF2 and FAM83D as potential biomarkers in TNBC.
Thus, the study of biomarkers provides the potential for developing diagnostic tools and enhancing the efficiency of health care therapies. 24 To have adequate sensitivity and specificity for the diagnosis or prognosis of cancer, it is becoming more expected that signature biomarker analytes rather than single indicators will be needed. 25 Many studies have shown that signatures with an appropriate combination of many potential biomarkers can significantly increase predictive accuracy.26,27 Thus, the necessity for cancer-specific biomarker panels stems that can reveal the molecular complexity of human carcinogenesis even within single cancer sites.
This study has been carried out with an objective to identify differentially expressed genes (DEGs) using R package. Their bioinformatics-based analysis has been performed for identifying novel TNBC signature biomarkers. Assessment of gene ontology (GO) and pathway enrichment evaluation were performed using different tools. Protein-protein interaction (PPI) networks were established to integrate DEGs. Candidate key genes were identified using cytoHubba plugin in Cytoscape software. The clinical relevance of these genes in TNBC was evaluated through survival analysis based on the Kaplan-Meier tool.
Methods
Information of microarray data set
The analysis of the microarray data set used in this study was performed on a data set retrieved from the National Center for Biotechnology Information (NCBI) Gene Expression Omnibus (GEO) database. The platform used for the TNBC data set samples was Affymetrix Human Genome U133A Array (GPL570 [HG-U133A]), and the file type was CEL files.
The “GSE65194” microarray data set was used in this study, which consisted of a total of 130 samples of breast cancer, including 41 samples of TNBC, 30 samples of HER2-enriched, 30 samples of Luminal B and 29 samples of Luminal A subtypes, as well as 11 samples of normal breast tissue and 14 TNBC cell lines.
For this study, a subset of 41 TNBC and 11 normal breast tissue samples were selected for further analysis. The selection of this subset was based on the principle of providing a diverse representation of breast cancer subtypes and normal samples, to conduct a comprehensive analysis of the gene expression data.
The pipeline of various tools used to conduct this study to predict the signature biomarkers in TNBC is illustrated in Figure 1.

Flowchart to investigate potential signature biomarkers in triple-negative prognosis. The flowchart represents an overview of the steps followed for data collection and method implementation to conduct this study.
Data set processing of differentially expressed genes
For bioinformatics analysis, R software (v4.1.2; http://www.r-project.org) was used. The DEGs in the gene expression profile of the data set was analyzed using GEO query, “dplyr” and “Limma” R package. The screening principle of DEGs was based on the log2 Fold Change (log2FC) and P-value set between targeted (TNBC patients) and control group (Normal Breast Tissue). The set filter conditions were adjusted to P-value < .01 and |logFC| ⩾ ±2 as cut-off criteria to identify the DEG. The Benjamini-Hochberg (BH) method test was performed to investigate the “observed” sensitivity of the false discovery present in our test sample considering |logFC| ⩾ 2.0 and adjusted P < .01 as cut-off criteria to be significant. The DEGs were visualized through volcano plot using ggplot2 R package.
Functional and pathway enrichment analysis
To investigate the functions of DEGs, functional enrichment analysis was performed using the ClueGo and CluePedia plugins for Cytoscape (3.9.1) tool (https://cytoscape.org/download.html). The ClueGO tool was used to decipher functionally grouped GO and pathway annotation network to understand their implication in categories of molecular function, Kyoto Encyclopedia of Genes and Genome (KEGG) and Reactome pathway. The relationship between each term was calculated using K statistic, and adjusted P < .05 was considered as a statistical significant difference.
Construction of protein-protein interaction network
Cytoscape software (version 3.9.1) (https://cytoscape.org/download.html) was used for the visualization of PPI networks generated by mapping DEGs by the Search Tool for the Retrieval of Interacting Genes (STRING) application. Parameters such as score >0.4 text mining, experiments, databases, and coexpression as well as species limited to “Homo sapiens” were used to create validatory PPI network.
Hub genes selection and analysis
To explore hubs genes in PPI networks, cytoHubba plugin of Cystoscope (3.9.1) tool (https://cytoscape.org/download.html) was applied on the networks that provided a user-friendly interface to identify important nodes present in our biological networks. cytoHubba possess 11 topological analysis methods for ranking nodes in a PPI network by their network features. For selection, we applied 2 topological methods, ie, Degree and Bottleneck parameter at cut-off of 2 for electing overlapping hub genes from up-regulated and down-regulated PPI networks.
External verification of hub genes expression level
To verify the alteration in the expression profiling of the key hub genes, Gene Expression Profiling Interactive Analysis (GEPIA2) platform was used. The tool validates the expression level by comparing transcriptomic data from The Cancer Genome Atlas (TCGA), TCGA normal, and the Genotype-Tissue Expression (GTEx) database. The TCGA data sets accessed through the GEPIA2 platform (http://gepia.cancer-pku.cn) can be independently verified and accessed at http://portal.gdc.cancer.gov/. The following parameters were set for the box plot expression: |log2FC| cut-off = 1, P-value cut-off = 0.01, log scale = yes, jitter size = 0.4, and match TCGA normal data. The box plot was used to illustrate the link between the gene expression and the samples.
The gene expression profiling of hub genes by box plot analysis was also performed on the data set “GSE65194” employed in this study, and the results were compared with those obtained from GEPIA2. This comparison allows for the identification of genes that are consistently differentially expressed across multiple data sets, which increases the confidence in the results. The comparison of results from GEPIA2 and GSE65194 data sets allows to ensure that the identified key hub genes are truly differentially and biologically relevant and can be used for further research and understanding of the disease.
Survival analysis
To study the clinical outcome of hub genes, predictive studies for overall survival (OS) were carried out using the Kaplan-Meier database (http://kmplot.com/analysis/), an online database that includes gene expression and clinical data. This database contains information on lung cancer, ovarian cancer, gastric cancer, and breast cancer. We used the Kaplan-Meir survival plot to assess the OS of breast cancer patients. The survival plots were obtained by uploading 8 genes into the database. Survival analysis for each gene was conducted using Cox proportional hazard regression, log-rank P-value, and the BH technique for multiple hypothesis testing.
Results
Identification of differentially expressed genes in triple-negative breast cancer
On analyzing the gene expression microarray data of GSE65194, up-regulated (2263) and down-regulated (980) genes were obtained from the data set of 54 674 genes using limma software package. For visualizing overall gene expression of differential genes, volcano map was generated using log2FC score and log10 P-values (ggplot2 package) in R software, where the dots are in 2 colors. In this visualization, up-regulated and down-regulated genes are in distinct colors, namely, red and blue, which have been denoted, respectively (Figure 2).

Volcano map of Differentially Expressed Genes: Volcano plot of differentially expressed genes between triple-negative breast cancer (TNBC) and Health Patient with|logFC| ⩾ ± 2, P-value threshold = 0.01 and adjusted P-value (q-value) threshold < .0001, where the red dots represented on the right-side panel are the genes that are up-regulated in the breast cancer, the blue dots represented on the left-side panel are the genes that are down-regulated in breast cancer, and the gray dots represent the genes that are not significantly differentiated.
The BH method was used to adjust the raw P-values into a false discovery rate (FDR), P < .01 and |logFC| ⩾ ±2were used as selection criteria. Thereafter, top 47 up-regulated DEGs and top 47 down-regulated DEGs were selected. The top DEGs are shown in Tables 1 and 2, and additional information of data has been provided in Supplementary Tables S1 and S2, representing the tabulated information of selected up-regulated and down-regulated DEGs.
List of top 47 ranks up-regulated DEGs.

List of top 47 ranks down-regulated DEGs.

ClueGO/CluePedia enrichment analysis
To investigate the potential biological function and molecular pathways that contribute to the pathogenesis of TNBC, DEGs were subjected to GO functional enrichment, KEGG, and Reactome pathway enrichment analysis. ClueGO/CluePedia plugin in Cytoscape software was used (Figure 3A and B). The enrichment analyses were carried out using hypergeometric test and kappa score ⩾0.4 as primary criteria.
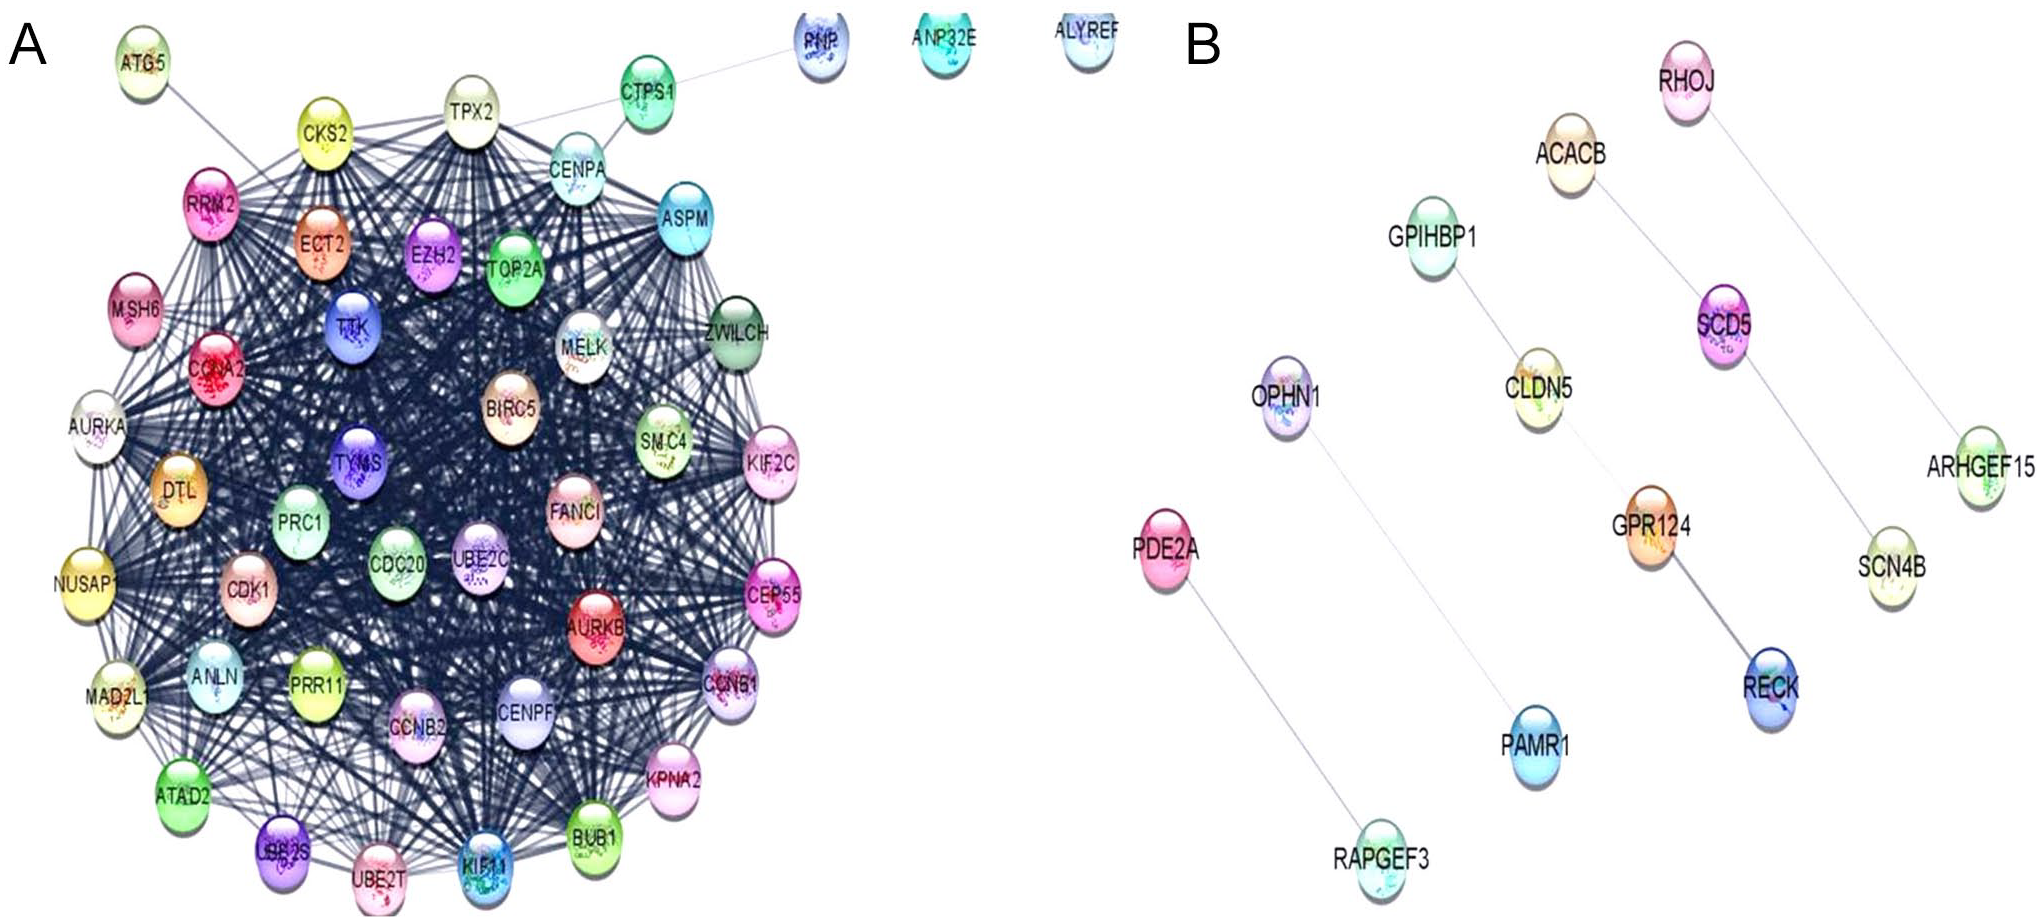
Schematic representation of protein-protein interaction (PPI) network analysis of differentially expressed genes established using Cytoscape software. Parameters set for analysis include degree cut-off = 2, node score = 0.2, k-score = 2. Each node represents the protein, and edges represent the interaction of proteins. (A) The PPI network of up-regulated DEGs and (B) the PPI network of down-regulated DEGs.
The up-regulated DEGs were found to be significantly enriched in molecular function for regulation of ubiquitin protein activities. The most significant terms of group were overviewed in the pie chart. It was seen that the 75% terms of up-regulated DEG’s genes were associated with the regulation of ubiquitin protein ligase activity and 12.5% terms in histone kinase activity and regulation activity of serine/threonine kinases (Supplementary Figure S1 (a)). Correspondingly, KEGG and Reactome pathway analysis (Supplementary Figure S1 (b) and (c)) revealed that 60% terms of up-regulated DEGs were significantly engaged in cell cycle pathway, PR-mediated oocyte maturation and oocyte meiosis, 20% gene in pyrimidine metabolism, and remaining genes were contributing to controlling cyclin A/B1/B2 associated events during G2/M transition, sumoylation of DNA replication proteins, and p53 signaling pathway. Genes such as AURKA, BUB1, and BIRC5 were identified to be involved in different stages of the cell cycle; similarly, KIF2C gene was seen to possess a role in controlling microtubule dynamics, whereas genes such as CDC20 and UBE2 were observed to influence the ubiquitin activities. Supplementary Table S3 (A) to (C) provides tabulated information of all the up-regulated DEG’s functional enrichment.
Down-regulated DEG’s molecular function (Figure 4A) was found to be engaged in pathway regulation of protein dimerization activity, protein domain-specific binding, nucleotide and nucleoside phosphate binding, and identical protein binding (Figure 4B and C). In addition to these, the genes were enriched in the peroxisome proliferator–activated receptor (PPAR) signaling pathway, RHO GTPase cycle, pyruvate metabolism, and so on.

Illustration of functional enrichment analysis was visualized using ClueGO/CluePedia plugin in Cytoscape. The plugin provides an extensive enrichment analysis for (A) molecular pathway, (B) KEGG pathway, and (C) Reactome pathway of up-regulated genes. The network’s functional nodes and edges that are shared by DEGs with a kappa value of 0.4 describe the connectivity of the pathways. The enrichment shows only significant pathways (P ⩽ .05). Different color coding indicates different molecular pathways that were examined during the enrichment analysis of the discovered DEGs. The names of pathways are denoted by bold typefaces, which highlight the most important functional pathways.
It was revealed that the genes like ARHGEF15, OPHN1, and RAPGEF3 were involved in the GTPase activator activity, 25.75% terms of down-regulated DEGs genes contribute to the metabolism of vitamins and cofactors, whereas other genes like PDE2A, ACACB, and VERGFD were involved in MAPK signaling pathway, RHOJ GTPase cycle and PPAR signaling pathway, and Rap1 signaling pathway, respectively. Supplementary Figure S2 (a) to (c) and Supplementary Table S4 (A) to (C) contain the tabulated data of all the down-regulated DEG’s functional enrichment.
The results obtained from ClueGO enrichment clearly illustrates that majorly up-regulated DEG’s contribute to regulating cell cycle and ubiquitin protein activities, whereas down-regulated DEG’s were found to be involved in regulation of mitotic metaphase/anaphase transition, change in major signaling pathways, metabolic reprogramming, and so on.
Protein-protein interaction network construction and module analysis
To identify and understand the interaction among DEGs, PPI network was constructed using STRING database. Figure 5A and B represents the PPI network of up-regulated and down-regulated genes, respectively. The PPI network established a single network comprising of 37 nodes and 665 edges in case of up-regulated DEGs and 5 clusters were obtained comprising of overall 32 nodes and 8 edges for down-regulated genes at the combined score >0.4.

Illustration of Functional enrichment analysis was visualized using ClueGO/CluePedia plugin in Cytoscape. The plugin delivers a comprehensive enrichment analysis for down-regulated DEGs including (A) molecular pathway, (B) KEGG pathway, and (C) Reactome pathway of down-regulated genes. The network’s functional nodes and edges that are shared by DEGs with a kappa value of 0.4 describe the connectivity of the pathways. The enrichment shows only significant pathways (P ⩽ .05). Different color coding indicates different molecular pathways that were examined during the enrichment analysis of the discovered DEGs. The names of pathways are denoted by bold typefaces, which highlight the most important functional pathways.
CytoHubba
To gain insights into the underlying biology of TNBC, which could be pivotal in governing various cellular processes and is often linked to critical functions and pathways, hub genes were identified. These hub genes, often described as a group of genes occupying central positions within biological networks or pathways due to their extensive connectivity and interactions with other genes or proteins, were pinpointed using the degree and bottleneck algorithms with a cut-off value of 2.
From the pool of DEGs, 5 hub genes (TTK, CCNB1, BIRC5, Cytidine nucleotide triphosphate synthase 1 [CTPS1], thymidylate synthase [TYMS]) were identified among the up-regulated genes and 3 hub genes (SCD5, CLDN5, GPR124) among the down-regulated genes. Supplementary Tables S5 and S6 contain the cytoHubba results for up-regulated and down-regulated DEGs, respectively.
Among the down-regulated hub genes, there was a direct interaction observed between CLDN5 and GPR124. Similarly, among the up-regulated hub genes, direct connections were found among TTK, CCNB1, BIRC5, CTPS1, and TYMS, with CTPS1 having direct links to BIRC5 and TYMS. A comprehensive list of these hub genes is shown in Tables 3 and 4.
Tabulated data of HUB genes identified from up-regulated DEGs.

Tabulated Data of HUB genes identified from down-regulated DEGs.

External verification of hub genes expression level
To verify the expression levels of identified hub genes in breast cancer samples, TCGA (http://portal.gdc.cancer.gov/) data set was analyzed using the GEPIA2 platform. The findings are represented by box plots illustrating the expression levels of the top 10 hub genes in breast invasive carcinoma (BRCA) samples compared with normal breast tissue samples, with 1085 tumor samples (num (T) = 1085) and 112 normal samples (num (N) = 112). For the overexpressed hub genes, the box plots show significantly higher median expression levels in tumor samples, suggesting their up-regulation in breast cancer and potential roles in cancer development. Conversely, the box plots for down-regulated hub genes display lower expression levels in tumor samples, indicating their under expression and possible function as tumor suppressors as illustrated in Figure 6.

Verification of expression level of hub genes and survival analysis of up-regulated genes. Part (A) represents the survival graph of each hub gene. Line color in black represents the survival of the patient when the expression of the genes is low; red line below represents the probability of the survival of the patient when genes with high expression. Part (B) represents the box plot of 2 hub genes constructed using TCGA and GTEx expression data. Gene Expression Profiling Interactive Analysis (GEPIA) was performed. Different color code boxes represent the breast cancer tissue group, gray was the normal tissue group, and asterisk represented P < .01. The dots represented expression in each sample. Part (C) of figure represents the validity expression of 8 hub genes using test and control samples of GSE65194 data set. Different color code boxes represent the TNBC samples, and gray represents the normal sample. The dots represented expression in each sample.
A similar pattern of alteration in the expression of the hub gene was reflected through the box plot of gene expression profile comparison in the selected data set (GSE651094) used in this study (num (T) = 55, num (H) = 11), as illustrated in Figure 7.

Verification of expression level of hub genes and survival analysis of down-regulated genes. In Part (A), each case represents the survival graph of each hub gene. Line color in black represents the survival of the patient when the expression of the genes is high; red line below represents the probability of the survival of the patient when genes with low expression. Part (B) represents the box plot of 2 hub genes constructed using TCGA and GTEx expression data. Gene Expression Profiling Interactive Analysis (GEPIA) was performed. Different color code boxes represent the breast cancer tissue group, gray was the normal tissue group, and asterisk represented P < .01. The dots represented expression in each sample. Part (C) of figure represents the validity expression of 8 hub genes using test and control samples of “GSE65194” data set. Different color code boxes represent the TNBC samples, and gray represents the normal sample. The dots represented expression in each sample.
Survival Analysis
To evaluate the prognostic roles of the potential hub genes for TNBC, the Kaplan-Meier plotter analysis platform was applied. A total of 1880 TNBC patient’s data were available for the analysis of OS. The results demonstrated that increased expression of TTK (HR (Hazard Ratio) = 2.18 [1.69-2.82], logrank P = 1.2e-09), CCNB1 (HR = 1.64 [1.36-1.99], logrank P = 2.6e-07), BIRC5 (HR = 1.7 [1.4-2.05], logrank P = 4.7e-08), CTPS1 (HR = 1.39 [1.15-1.68], logrank P = .00063), and TYMS (HR = 1.38 [1.14-1.67], logrank P = .00084) are associated with a lower survival rate of the patients than its low expression. In contrast, TNBC patients showed a lower likelihood of survival as a result of declining SCD5 expression level (HR = 0.96 [0.79-1.16], logrank P = .65). Likewise, a poor OS rate was observed to be associated with decreased CLDN5 expression (HR = 0.89 [0.74-1.04], logrank P = .24), suggesting these genes as potential therapeutic targets for patients with TNBC. The survival analysis of GRP124 gene (HR = 0.99 [0.82-1.2], logrank P = 0.93) was not correlated with OS.
Discussion
In this study, the potential signature biomarkers in the breast cancer pathogenesis have been deciphered using bioinformatics strategy. A set of 2263 up-regulated and 980 down-regulated DEGs were identified between breast cancer and normal samples. The panel of up-regulated DEGs was found to be enriched in “Cell cycle,” “Oocyte meiosis,” “Regulation of ubiquitin protein ligase activities,” and so on. Cell cycle is an evolutionarily conserved and fundamental mechanism for growth and proliferation. 28 Its dysfunction is a defining feature of human cancer. Previous studies have indicated correlation of cell cycle with the outcome of breast cancer. 29 These dysregulations in cell cycle have been consequence of breast cancer metastasis.29,30 Several cell cycle–related genes including CCNB1 and CDK1—discovered as dysregulated genes in this study—have been implicated in the onset and progression of cancer. 31 Likewise, abnormal regulation of meiosis and oocyte maturation has also been linked to affect cell cycle.32,33 A bioinformatics analysis reported by Wu et al shows that PR-mediated oocyte maturation and oocyte meiosis are associated with the pathogenesis of breast cancer. 34 A major regulator of protein ubiquitination, ubiquitin protein ligase (E3) functions to determine the fates of ubiquitin proteins. Aberrant functioning of E3 ubiquitin ligases results in altering the biological behavior of cancer cells, including breast cancer metastasis. 35 As a result, regulation of ubiquitin protein ligase activity demonstrates a critical role in metastasis of breast cancer. It is found that ubiquitin protein ligase exhibits its role in invasion, migration, angiogenesis, and immunity response. 36 In addition, these pathways have been acknowledged in the pathogenesis of prostate cancer and renal cell carcinoma.37,38 Similarly, down-regulated DEGs were found to be involved in “MAPK signaling pathways,” “Rap1 signaling pathway,” “PPAR signaling pathway,” “RHO GTPase cycle,” and so on. Among these pathways, MAPK pathway is primarily responsible for regulating the function of other proteins through phosphorylation. 39 Rap1 signaling regulates integrin or cadherin-mediated cell adhesion, expression levels of proteases, and cytoskeletal changes, which have been linked to cancer cell proliferation, development, and metastasis of cancer. 40 The PPAR is a nuclear hormone receptor observed to participate in cell proliferation and differentiation, regulate immune response, and promote endothelial NO synthase (eNOS) activation in breast cancer. 41 Other important pathway is the RHO GTPase cycle, which plays a critical role in breast cancer initiation, development, and metastasis. The Rho GTPase activation drives progression of cell through affecting metastatic cascade. 42
To detect highly connected protein nodes from PPI network, the cytoHubba plugin tool revealed SCD5, CLDN5, GPR124, TTK, CCNB1, BIRC5, CTPS1, TYMS genes as hub genes.43,44 The SCD5 is an endoplasmic reticulum-resident integral membrane protein that catalyzes the formation of monounsaturated fatty acids from saturated fatty acid. Down-regulation of SCD5 expression can be found to be related to more aggressive breast cancer phenotypes, such as high histological grade, late stage, and HER2 overexpression. 45 Claudin-5 is a protein member of the tight junction that is expressed in endothelial and epithelial cells. 46 It exhibits a critical role in maintaining homeostasis within the tissue environment. Overexpression of this protein is found to promote carcinogenesis and metastasis through increasing invasion and survival of cancer cells. In particular, previous studies revealed differential expression of claudins in cancers. High levels of Claudin-5 have been reported in ovarian, prostate, lung, and breast cancer; a “claudin-low” type has been found in TNBC.46,47 To date, only few studies have been addressed that corroborate the down-regulation of claudin-5 genes (similar to our finding) in breast cancer, especially TNBC.48,49 The TTK has been reported to be an attractive therapeutic target. It plays a key role in the spindle assembly checkpoint, mitotic regulation, and regulation of cell division processes, and it is up-regulated in a variety of cancers, such as bladder, esophagus, breast, lung, prostate, and anaplastic thyroid. Overexpression of TTK facilitates genomic instability in cancer cell proliferation and invasion. AI-Ejeh et al 50 found that elevation in the level of TTK protein in aggressive cancer leads to poor survival. Similarly, earlier TNBC studies also found that aberrant TTK expression in TNBC is an event that is significantly associated with an elevated risk of relapse and docetaxel resistance.51,52 These findings are further corroborated by this study’s observation. In addition, it was discovered through survival analysis that overexpression of TTK gene imparts a negative effect on patients’ chances of surviving. The CCNB1, a checkpoint protein, plays a significant role in apoptosis, chemo-resistance, and epithelial mesenchymal transitions to cancer cells. 53 Overexpression of cyclin B1 has been reported to be associated with many cancers, such as colorectal cancer, gastric cancer, pancreatic carcinoma, and lung carcinoma. 54 For instance, Aaltonen et al 55 demonstrated the correlation of overexpression of the cyclin B1 with an aggressive phenotype and association with shorter OS and metastasis-free survival in breast cancer patients. A similar finding has been reported by Ding et al, 56 in that high level of CCNB1 was closely associated with hormone therapy resistance, poor recurrence-free survival, disease-free survival, and distant metastasis-free survival of ER + breast cancer patients. Preliminary findings from this study show that CCNB1 is overexpressed in TNBC patients compared with healthy controls and may act as a potential biomarker for the disease, which is also laying the framework for future drug development. The CTPS1 is a CTP synthase that plays a critical role in DNA synthesis. Previous literature illustrates that higher CTPS1 gene expressions have association with worsen clinic-pathologic features such as larger cancer size, higher histological grade, and lympho-vascular invasion. 57 The results of our analysis also support the same trend, as TNBC patients with the higher expression of CTPS1 gene had poor OS rate. Few studies to date have evaluated its role in cancer development and progression. 58 The BIRC5 is a cell death preventing protein that is important for cell division in normal and cancerous cells. The BIRC5 is found during carcinogenesis in various cancer types. Treatment that targets BIRC5 has been increasingly noticed as a promising therapeutic strategy. 59 However, the detailed expression pattern, potential function, prognostic value, and drug interaction network of BIRC5 remain largely unclear in breast cancer. The BIRC5 when overexpressed in breast cancer patients is responsible for a worse survival. 60 The TYMS is a key rate-limiting enzyme essential for the synthesis of thymidylate biosynthesis. This enzyme transfers tetrahydrofolate as methyl donor acid and catalyzes the conversion of methylation from deoxyuridine-monophosphate (dUMP) to deoxythymidine monophosphate (dTMP), which, on further phosphorylating, forms a triphosphate (dTTP), one of 4 the precursors used to synthesize DNA. 61 The TYMS plays a crucial role in DNA synthesis and repair. 62 Recent studies demonstrate that increase in expression level of TYMS has been observed in the development of several malignancies such as prostate cancer and lung cancer. 63 The GPR124 was discovered to be down-regulated in patients with TNBC through differential expression. Furthermore, the survival study showed no statistically significant link between the patients’ OS, demonstrating a poor prognostic indicator for the triple-negative breast subtype.
Our in silico investigations revealed BIRC5, CCNB1, and TTK as key signature genes that were observed to be significantly enriched in numerous biological pathways. Compared with normal breast tissue, these 3 genes in breast cancer samples were found to be overexpressed, and the alternation of these genes was substantially connected with a poor survival outcome in breast cancer patients. Notably, these genes, in particular, have consistently ranked among the top dysregulated genes in other cancers like lung adenocarcinoma, 19 pancreatic ductal adenocarcinoma, 64 and esophageal squamous cell carcinoma. 65 Thus, the discovery of these parallels in TNBC and other cancers suggests a fundamental role for these genes in the development of cancer and strengthens their potential as therapeutic targets. 66
Taken together, in this study, the primary objective was to thoroughly examine the most probable candidate genes associated with breast cancer. The identification of these uncovered hub genes holds great promise in elucidating the intricate molecular mechanisms driving the development of TNBC. Beyond shedding light on the disease’s underlying processes, these discoveries may open up exciting new avenues for therapeutic interventions.
Fortifying the findings involved drawing from a wealth of examples in the existing scientific literature. These examples serve to underscore the substantial role that candidate genes play in the genesis of cancer. Consequently, the study provides a compelling body of evidence that not only enhances the understanding of breast cancer but also paves the way for promising directions in future breast cancer research.
Supplemental Material
sj-jpg-2-bbi-10.1177_11779322241271565 – Supplemental material for Bioinformatics-Driven Investigations of Signature Biomarkers for Triple-Negative Breast Cancer
Supplemental material, sj-jpg-2-bbi-10.1177_11779322241271565 for Bioinformatics-Driven Investigations of Signature Biomarkers for Triple-Negative Breast Cancer by Shristi Handa, Sanjeev Puri, Mary Chatterjee and Veena Puri in Bioinformatics and Biology Insights
Supplemental Material
sj-jpg-3-bbi-10.1177_11779322241271565 – Supplemental material for Bioinformatics-Driven Investigations of Signature Biomarkers for Triple-Negative Breast Cancer
Supplemental material, sj-jpg-3-bbi-10.1177_11779322241271565 for Bioinformatics-Driven Investigations of Signature Biomarkers for Triple-Negative Breast Cancer by Shristi Handa, Sanjeev Puri, Mary Chatterjee and Veena Puri in Bioinformatics and Biology Insights
Supplemental Material
sj-xlsx-1-bbi-10.1177_11779322241271565 – Supplemental material for Bioinformatics-Driven Investigations of Signature Biomarkers for Triple-Negative Breast Cancer
Supplemental material, sj-xlsx-1-bbi-10.1177_11779322241271565 for Bioinformatics-Driven Investigations of Signature Biomarkers for Triple-Negative Breast Cancer by Shristi Handa, Sanjeev Puri, Mary Chatterjee and Veena Puri in Bioinformatics and Biology Insights
Footnotes
Funding:
The author(s) disclosed receipt of the following financial support for the research, authorship, and/or publication of this article: This work was supported by the DBT Builder Grant BT/INF/22/SP41295/2020. The financial support provided by Panjab University is duly acknowledged. Infrastructure support by the Department of Biotechnology, UIET and Centre for Systems Biology and Bioinformatics, Panjab University, Chandigarh, India, is duly acknowledged.
Declaration of conflicting interests:
The author(s) declared no potential conflicts of interest with respect to the research, authorship, and/or publication of this article.
Author Contributions
S. H. contributed to formal analysis, investigation, writing. S. P. contributed to conceptualization, validation, supervision, Editing and review. M. C. contributed to conceptualization, validation, supervision. V. P. contributed to conceptualization, validation, supervision, writing, editing.
Supplemental Material
Supplemental material for this article is available online.
References
Supplementary Material
Please find the following supplemental material available below.
For Open Access articles published under a Creative Commons License, all supplemental material carries the same license as the article it is associated with.
For non-Open Access articles published, all supplemental material carries a non-exclusive license, and permission requests for re-use of supplemental material or any part of supplemental material shall be sent directly to the copyright owner as specified in the copyright notice associated with the article.