
Abstract
In this study, we explored a time course of peripheral whole blood transcriptomes from kidney transplantation patients who either experienced an acute rejection episode or did not in order to better delineate the immunological and biological processes measureable in blood leukocytes that are associated with acute renal allograft rejection. Using microarrays, we generated gene expression data from 24 acute rejectors and 24 nonrejectors. We filtered the data to obtain the most unambiguous and robustly expressing probe sets and selected a subset of patients with the clearest phenotype. We then performed a data-driven exploratory analysis using data reduction and differential gene expression analysis tools in order to reveal gene expression signatures associated with acute allograft rejection. Using a template-matching algorithm, we then expanded our analysis to include time course data, identifying genes whose expression is modulated leading up to acute rejection. We have identified molecular phenotypes associated with acute renal allograft rejection, including a significantly upregulated signature of neutrophil activation and accumulation following transplant surgery that is common to both acute rejectors and nonrejectors. Our analysis shows that this expression signature appears to stabilize over time in nonrejectors but persists in patients who go on to reject the transplanted organ. In addition, we describe an expression signature characteristic of lymphocyte activity and proliferation. This lymphocyte signature is significantly downregulated in both acute rejectors and nonrejectors following surgery; however, patients who go on to reject the organ show a persistent downregulation of this signature relative to the neutrophil signature.
Keywords
Background
The success of kidney transplantation has increased dramatically over the past several decades largely due to a better understanding of the immune biology and the molecular processes underlying allograft assimilation and rejection in addition to improved management of immunosuppression regimens. 1 3 However, acute rejection, caused by an immune response in the recipient against alloantigens of the donor graft, remains a major complication and prevents the long-term assimilation of the allograft. Management of the immune response associated with rejection is, therefore, essential for the prevention of irreversible damage to the graft.
T lymphocytes are known to be the principal mediators of acute allograft rejection, infiltrating graft tissues and interceding cell-mediated cytotoxicity reactions.4,5 Therefore, the majority of studies examining gene expression changes associated with transplant rejection have used lymphocyte-biased samples or platforms such as peripheral blood mononuclear cells (PBMCs) 6 and Lymphochip cDNA microarrays.7,8 More recent evidence has revealed an important role for the innate immune system in allograft rejection. 9 It has been demonstrated that the almost complete depletion of T cells is not sufficient to prevent allograft rejection. Furthermore, it has been suggested that rejection might be associated with innate immune activities related to ischemia-reperfusion injury.10,11 A more complete understanding of activities of the immune system during transplantation and allograft rejection is, therefore, needed to facilitate the discovery and development of more targeted and successful tolerance strategies. 12
Molecular profiling of circulating whole blood is a viable approach for monitoring the status of immune system activities associated with kidney transplantation and allograft rejection. 13 The identification of specific molecular signatures associated with allograft rejection has potential utility for the development of surveillance tools for real-time tracking of the rejection status of transplant patients. The feasibility of this type of approach is based on the utility of peripheral whole blood as a surrogate for biopsy tissue, as the blood carries educated immune cells circulating from the site of injury to lymphoid organs as it flows throughout the body. Blood cell molecular signatures are known to reflect system-wide pathological changes and physiological homeostasis in the body, 14 which can reveal a variety of immune responses. Profiling of blood transcriptomes by using genomic technologies, such as microarray, provides a snapshot of transcriptional activities in peripheral whole blood that can be used to characterize molecular signatures present in the sample. These techniques have, therefore, surfaced as a powerful approach that can be used to exploit disease-associated molecular phenotypes in blood.15,16
In this study, we use stringently filtered microarray data to identify and characterize transcriptional changes that are associated with kidney transplantation and acute allograft rejection. Using a data-driven exploratory analysis approach to eliminate potential confounding factors within the data, we identify biologically relevant genes representing physiological homeostasis and immunological activities that are associated with kidney transplantation and acute allograft rejection. This analysis encompasses data representing various time points from pretranslant and posttransplant, allograft rejection, and postrejection. This work provides potential biological insight into immune system activities throughout the kidney transplantation process including allograft acceptance or rejection.
Methods
Ethics Statement
This study was conducted in collaboration with the University of British Columbia investigators and was approved by the Providence Health Care Research Ethics Board. All patients in the study gave informed written consent.
Patient Group and Sample Selection
As described in our previous work, 16 all subjects receiving a renal transplant in the University of British Columbia renal transplant program from January 1, 2005, through December 31, 2009, were invited to participate in this study. Those who agreed and signed consent were enrolled and were followed routinely by the transplant program team throughout their course. 16 Patients received a standardized treatment protocol including basiliximab 20 mg intravenously (IV) on days 0 and 4, methylprednisolone 125 mg IV on the day of transplantation tapering to zero by day 3 posttransplant, tacrolimus 0.075 mg/kg twice a day, and mycophenolate 1000 mg twice a day. Tacrolimus concentrations were measured by tandem mass spectrometry, and the dose was adjusted to achieve 12-hour trough levels of 8–12 ng/mL in month 1,6–9 ng/mL in month 2, and 4–8 ng/mL thereafter. Allograft rejection was diagnosed by normal clinical and laboratory parameters, confirmed by biopsy, and graded according to the Banff 97 working classification of renal allograft pathology. 17 Banff categories 2 and 4 (antibody-mediated or acute/active cellular rejection) were considered significant. Subjects with borderline changes (category 3) were analyzed separately. All demographic, clinical, diagnostic, and therapeutic data were recorded longitudinally in an electronic database, and there was no patient loss to follow-up during the study.
A total of 252 blood samples were obtained during the first year in PAXgene™ tubes (Qiagen, Valencia, CA). Samples were obtained immediately prior to transplantation, at 0.5, 1, 2, 3, 4, 8, 12, 26, and 52 weeks posttransplant and at the time of suspected rejection. However, a complete collection of time point samples was not attained in every case. Additionally, samples were not uniformly collected for every patient for every time point. Graft tissue was obtained pretransplant and at the time of all biopsies performed for clinical purposes posttransplant. All samples were stored in a biolibrary until required for analysis. Blood samples from 20 healthy volunteers collected at a single time point, treated identically, served as controls. 16 The study employed a case-control design 18 to compare differential gene expression in subjects with or without acute rejection (AR). Patients were considered eligible for acceptance into the program and subsequent analysis if they were less than 75 years of age; did not have pretransplant immunosuppression or immunological desensitization; received an AHG-CDC crossmatch negative kidney transplant from a deceased or non-HLA-identical living donor; did not receive depleting antibody induction therapy; were able to receive oral immunosuppression; and had no evidence of infection, disease recurrence, or other major comorbid events. Cases with AR diagnosed during the first 12 months posttransplant were matched as closely as possible for age, sex, degree of sensitization, organ source, and date of transplantation with nonrejection controls (NR), who had no evidence of acute allograft rejection during the period of follow-up. Complete blood counts with differentials were obtained for some samples.
RNA Extraction and Microarray Data Generation
Total RNA was extracted using PAXgene™ Blood RNA kits (Qiagen, Valencia, CA) and integrity and concentration determined using the Agilent 2100 BioAnalyzer (Agilent Technologies, Palo Alto, CA). Gene expression was analyzed at the CAP/CLIA certified Microarray Core Laboratory, Genome Core at the Children's Hospital, Los Angeles, CA, using Affymetrix Human Genome U133 Plus 2.0 arrays. Quality of the samples, hybridization, chips, and scanning were reviewed using the tools in the Bioconductor packages affy version 1.16.0 and affyPLM version 1.14.0.
Microarray Data Processing and Filtering
GCRM A19,20 was used for normalization and background correction using R statistical language. Expression values were analyzed on the log-base 2 scale. We included not only the 252 samples from renal transplant recipients and 20 healthy controls, but also 136 samples from cardiac transplant recipients for normalization and background correction to increase the sample size for more robust data normalization. PANP (Presence-Absence Calls From Negative Strand Matching Probesets)
21
bioconductor R package was used for microarray filtering of background signals from unspecific hybridization (lower
Data Exploration and Analysis
MultiExperiment Viewer (MeV)
23
was used for the microarray data analysis. Data reduction tools including principal component analysis (PCA)
24
in MeV were used (standard default inputs) in order to reveal internal structures or hidden associations in the gene expression data with regards to clinical background, patient demographics, and transplantation outcome. In all cases, the first 2 principal components accounted for more than approximtely 70% of the variance. A pattern-matching algorithm, Pavlidis Template Matching (PTM)
25
and Significance Analysis of Microarrays (SAM)
25
in MeV were used to determine transcripts with differential expression between acute rejectors (AR) and nonrejectors (NR) that changed over time approaching rejection (adjusted
Results
Patient Group Description and Confounder Analysis
The samples collected for this study represent 48 transplant patients from different demographic and clinical backgrounds and include various time points from end-stage kidney failure through the posttransplantation period, including rejection and postrejection time points. Twenty-four patients experienced an acute kidney rejection episode, while 24 did not reject the transplanted organ. Table 1 summarizes the demographics of the 48 patients (Additional file 1, detailed 48 patient demographic and clinical data). In addition, single time point samples from 20 healthy subjects were used as a reference for several analyses, including as controls for immunotherapy.
Patient demographics.
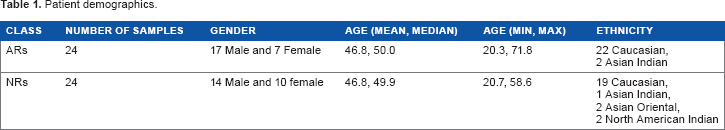
We performed a confounder analysis of patient demographics and clinical data in order to ensure balanced sample matching of acute rejectors (AR) with nonrejectors (NR). Pearson's chi-squared test and analysis of variance (ANOVA) were used for categorical and continuous variables, respectively. As shown in Table 2, potential confounders, including patient demographics and clinical variables such as treatment regimen, did not show any statistically significant difference between ARs and NRs. However, as expected, renal blood urea nitrogen (BUN) and creatinine levels were significantly different between the 2 patient groups (adjusted
Confounder analysis for 24 ARs and 24 NRs.

Microarray Data Filtering
We generated transcriptome data for 272 peripheral whole blood samples from the 48 kidney transplantation patients as well as 20 healthy volunteers. We subjected the transcriptome data to a rigorous filtering process to remove obsolete, erroneously mapped, or poorly performing probe sets (see Methods). This approach has been shown to increase the reliability and consistency of gene expression analyses and improve the correlation of microarray and RT-qPCR results.30,31 Of the 54,000 probe sets present on the arrays, 5619 passed our filtering pipeline, representing roughly 4000 unique genes that are equivalent to approximately 25% of the human blood transcriptome (Additional file 2). 14 Given that, on average, only 30% to 40% of expressed genes in any individual tissue are detected by microarray technologies, 32 our transcriptome complement was, therefore, a reasonable representation of robustly detectable and actively transcribed genes within the technical limitations of this methodology.
An Initial Comparison of Nonrejector and Acute Rejector Patient Samples Did Not Reveal a Gene Expression Signature Specific to Acute Allograft Rejection
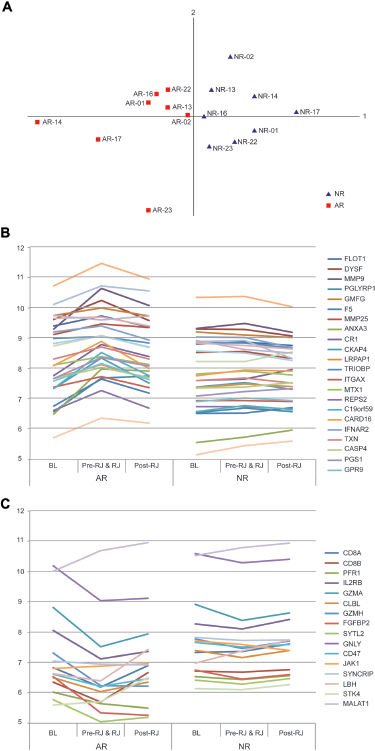
In an attempt to uncover differential gene expression signatures that correlated with acute allograft kidney rejection, we compared transcriptome data from 24 AR samples at the time of rejection with their matched 24 NR samples. To do this, we first simplified the analysis by performing data reduction using PCA (principal component analysis), 24 a method that creates a visualization of different clusters in two- or three-dimensional space, allowing the highest variations to be determined. PCA analysis revealed no significant variance (in the 2 principal components) that separated AR samples from NR samples (Fig. 1A). However, we found that the most significant of the criteria that separated the sample data was time posttransplantation, regardless of rejection status. Specifically, samples from early time points posttransplant separated from samples taken in weeks 3 and beyond (Fig. 1B). This result highlighted the importance of precise sample matching between the AR and NR patients groups with respect to sample collection time posttransplantation. A closer examination of the initial sample matching between AR and NR patients revealed an imbalance with respect to collection time in the first week post transplant. For example, 7 AR samples collected at day 3 or 4 were originally matched with 7 NR samples from day 6 or 7. Given the potential for the presence of dynamic and extensive transcriptional changes post surgery, the imprecise time matching of the samples may have introduced a confounding factor to the analysis, potentially masking rejection-associated expression changes.

Comparison of 24 ARs at rejection and 24 matched NRs. A. PCA plot of 24 AR patient samples at the time of rejection and their 24 matched NR patient samples. AR and NR samples do not separate clearly. B. The same PCA plot of 24 AR and 24 N R patient samples as in A. Samples are highlighted by the time (days) of rejection (ie, time of sample collection since transplant). Sample separation based on the time of collection can be seen indicating the presence of a time-dependent gene expression signature. C. PCA plot of samples from days 2 to 10 posttransplant generated using the time-dependent gene expression signature. Overall, a strong separation of samples from days 2 to 4 and days 6 to 10 posttransplant is observed (the number shown next to each sample point is the number of days posttransplant for that sample). D. PCA plot of 8 late ARs (week 3 and beyond, posttransplant) and the matched NRs using all the filtered probe set data. These late ARs separate from NRs more clearly compared to the early ARs and NRs.
Gene Expression Changes Common to Transplantpatients are Time-Dependent and Include Known Targets of Immunosuppression and Processes Involved in Inflammation and Innate Immunity
In order to further investigate the time-dependent gene expression changes that were separating the patient data, we compared the 24 AR and 24 NR patient samples using 20 healthy samples as a reference. PCA analysis of patient and control samples revealed that the highest variance present in these data was a molecular signature comprised of genes that showed an overall lower expression level among transplant patient samples when compared with control samples (Additional file 3, A and B). Furthermore, a high variability in gene expression levels was observed within the transplant patient data. PCA analysis using only the genes present in the differential gene expression signature revealed that patient samples collected at earlier time points (ie, those taken from a few days posttransplant) clustered more distantly from the control subject samples, regardless of their rejection status (Additional file 3, A). These genes were more severely downregulated in both early AR and NR time point samples. A clear separation was observed between samples collected at days 2–4 and days 6–10 posttransplant (Fig. 1C). Using InnateDB to identify specific biological processes associated with the highly downregulated genes revealed an overrepresentation of pathways related to T cell and B cell proliferation and activation such as TCR, downstream signaling in naïve CD8+ T cells, IL-2, IL-12 pathways, and BCR (Table 3). Having identified a time dependent downregulated gene expression signature that was common to transplant patients, we hypothesized that an expression signature representing upregulated genes would also be present. Pavlidis template matching (PTM)
25
is an algorithm that can be tailored to specify a template expression profile, or use a specific gene as a template, to search for matches to the template within an entire dataset. The match is based on the Pearson correlation between the template and the genes in the data set, and the threshold criterion for matching can be either the magnitude of the correlation coefficient or the significance (
Innate DB analysis of biological processes associated with the genes downregulated in both AR and NR transplant patient samples (compared with healthy controls) taken after 2 or 3 days following transplant.

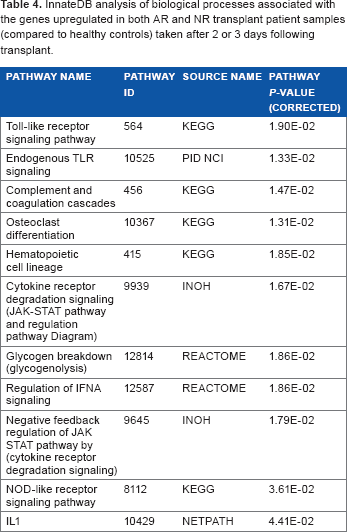
InnateDB analysis of biological processes associated with the genes upregulated in both AR and NR transplant patient samples (compared to healthy controls) taken after 2 or 3 days following transplant.
A Comparison of Closely Matched Acute Rejector and Nonrejector Samples from a Relatively Late Time Point (Week 3 Postsurgery and Beyond) Revealed Acute Allograft Rejection-Associated Differential Gene Expression Signatures
We found that dynamic expression changes common to both AR and NR patients at early time points, combined with an imbalance in sample matching in this period, was potentially confounding the identification of gene expression signatures associated specifically with transplant rejection. Therefore, to better reveal such signatures, we focused our analysis on samples taken from a relatively late rejection patient group (ie, minimum 15 days posttransplant) (Additional file 4, demographics and clinical data and the confounding analysis results for late 8 ARs and matched 8 NRs). This limited our analysis to a group of 8 AR patients who had a confirmed rejection episode between weeks 3 and 12 postsurgery and their matched NR patient samples. This highly matched patient case-control group did not show any significant confounding factors arising from demographics or clinical background except for the previously stated and expected creatinine and BUN readings. However, the age of the donor was found to be significantly different between the AR and NR patient groups (adjusted
We generated a PCA plot comparing the 8 AR samples at the time of rejection against their 8 time point matched NR samples. This plot demonstrated a much better separation between the AR and NR samples (Fig. 1D), revealing a significant differential expression signature specific to the AR patient group. Using SAM, we identified 120 genes that displayed significantly lower expression and 11 genes that were significantly more highly expressed in the AR samples (FDR < 0.05) (Additional files 5 and 6). Using InnateDB, we found that the downregulated expression signature was enriched for genes involved in lymphocyte activities including
Differential Gene Expression Analysis in Time Course Samples from 15 Days Posttransplant up to Rejection Further Expands Rejection-Associated Gene Expression Signatures
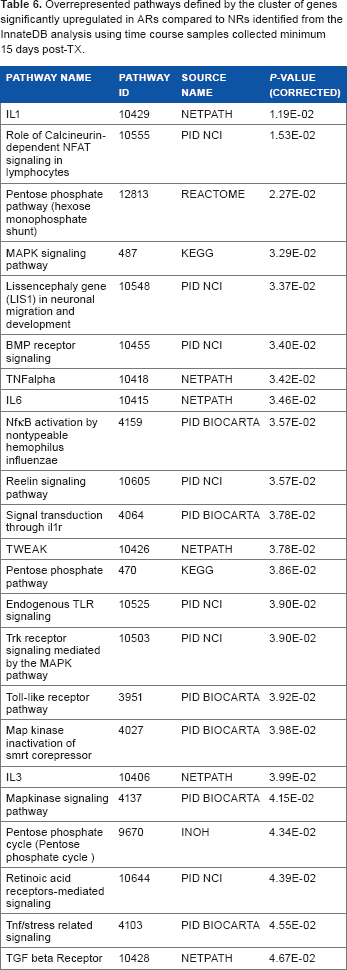
Having identified significantly differentially expressed genes at the point that the rejection state was confirmed, we wished to identify additional genes that were more highly or lowly expressed in patients as they approached rejection. To do this, we expanded our analysis to include all available time course samples from the late AR patient group from day 15 up to the rejection time point (19 AR and 16 NR samples in total) and analyzed them using SAM. This approach uncovered additional genes that were significantly upregulated or downregulated specifically in the AR samples (Additional file 8). Biological activities overrepresented by this expanded list of downregulated genes also included lymphocyte activities such as TCR, IL12, IL7, and IL2 pathways (Table 5). Biological activities overrepresented by the extended highly expressed gene set included known markers of systemic inflammation, including IL-1, IL-6, TLR, TNF alpha, NFκB, and Pentose phosphate pathways (Table 6). Additionally, we found that the most significant differentially expressed genes from this cluster overlapped with 286 neutrophil granule protein genes identified from a proteomic analysis of the azurophil, specific, and gelatinase granules from human neutrophils.
35
Commonly identified genes included
Overrepresented pathways defined by the cluster of genes significantly downregulated in ARs compared to NRs identified from the InnateDB analysis using time course samples collected minimum 15 days post-TX.

Overrepresented pathways defined by the cluster of genes significantly upregulated in ARs compared to NRs identified from the InnateDB analysis using time course samples collected minimum 15 days post-TX.
Upregulated Genes Associated with Acute Allograft Rejection are Highly Enriched in Neutrophils; Genes that are Downregulated are Enriched in Lymphocytes
To further investigate the biological functions of the differentially expressed genes associated with rejection, we used gene enrichment profiles created by Benita et al 36 to examine their significance across various cell and tissue types. As expected, neutrophil activity-associated genes that were upregulated showed significant enrichment in neutrophils (Fig. 2A). Conversely, the downregulated genes were found to be highly enriched in CD8+ T cells and mostly absent from neutrophils (Fig. 2B). This analysis provided evidence that the gene expression signatures might be cell specific and representative of both an increase in neutrophil activity and reduction of lymphocyte development and differentiation. Furthermore, the sum of enrichment scores for all genes from each signature across various cell and tissue types indicated that the AR associated upregulated genes are most highly enriched in the myeloid lineage while the downregulated genes are most highly enriched in T lymphocytes (Fig. 2C and 2D).

Genes upregulated approaching rejection are highly neutrophil enriched while genes downregulated are highly lymphocyte enriched.
Rejection-Associated Gene Expression Signatures are Modulated in a Manner Associated with Rejection Treatments
We reasoned that if the differential gene expression signatures we have described were specifically associated with acute allograft rejection, these signatures might be modulated in response to rejection therapies applied after primary confirmation of the rejection episode. To test this hypothesis, we interrogated patient transcriptome data collected after the time that rejection was confirmed and when rejection treatments were initiated. A PCA plot generated using the most significantly differentially expressed genes from both neutrophil and lymphocyte molecular signatures revealed a clear separation of the 8 AR patients and their matched 8 NR counterparts (Fig. 3A). Additionally, the expression levels of these genes were altered in AR patients undergoing treatment for rejection (ie, treated with solumedrol, prednisone, or antithymocyte globulin [ATG]). Specifically, genes upregulated in the neutrophil signature showed a decreased expression after rejection treatment (Fig. 3B). Conversely, downregulated genes associated with the lymphocyte gene signature exhibited a general increase in expression post rejection treatment (Fig. 3C).
Analysis of External Case-Control Patient Data Demonstrates Concordance with Molecular Expression Signatures that are Associated with Acute Allograft Rejection
To independently assess the reproducibility of the rejection-associated signatures, we obtained additional data from an independent multicentre international cohort of 15 AR and 22 NR kidney transplant patients. Data from this external patient group were generated using Affymetrix Human GeneST 1.1 arrays (Additional file 9, A and B), which differed from our microarray data, which were generated using Affymetrix U133 plus 2.0 arrays. To determine if the differential gene expression signatures were reproducible across both platforms, we generated transcriptome data using the Human GeneST 1.1 arrays for the rejection samples from our 8 AR patients described above and their matched NR samples. A PCA plot comparison of the neutrophil and lymphocyte signature genes generated from both platforms showed a similar separation. This indicated that these rejection-associated gene expression signatures were consistent across the 2 microarray platforms (Additional file 9, C and D). Subsequent SAM analysis of statistically significant differential gene expression signatures between the 15 AR and 22 NR patients in the external validation patient group demonstrated that neutrophil genes showed an overall upregulation in AR samples in comparison with NR samples. Approximately half of the signature genes showed statistically significant differential expression in this analysis (FDR < 0.05) (Fig. 4A). Conversely, lymphocyte genes were in general downregulated in ARs in this patient group, with approximately a third of the signature genes showing a statistically significant differential expression (FDR < 0.05) (Fig. 4B). Given that the transcriptome samples from the external validation cohort were not precisely time-matched, the level of validation described in this analysis might represent an overestimate or underestimate of the actual reproducibility of the rejection signatures. Overall, however, this analysis demonstrated that the gene expression signatures we have identified as associated with acute allograft rejection replicate to a reasonably significant degree in an independent group of kidney transplant patients.

Validation of the rejection-associated signatures using external kidney transplant study data. Validation study microarray data were generated using the GeneST 1.1 platform on 15 AR and 22 NR sample sets (BiT2).
Biological Processes that are Representative of the Neutrophil Gene Expression Signature are Increasingly Upregulated Posttransplantation and Approaching Rejection
We have described differential gene expression signatures in peripheral blood leukocytes that are associated with acute allograft rejection. In particular, the increasing gene expression changes described by the neutrophil associated signature have potential utility for predicting transplant patient outcome. To refine this expression signature, we interrogated patient time course data for genes whose expression was specifically upregulated in AR patients as they approached rejection using an artificially defined pattern of increasing expression. For this analysis, we selected time point data that encompassed samples collected from pretransplant up to and including confirmation of rejection. For consistency, we selected precisely matched time points, which limited this analysis to a small cohort of 5 AR patients and their matched NR samples. Three time points—at pretransplant baseline (BL), at 7 days prior to rejection (−7), and at the time of rejection (RJ) (ie, biopsy confirmation)—were selected within this patient group. We then performed pattern matching analysis using PTM to identify genes that were upregulated specifically in AR patients from pretransplant levels and maintained at a high expression level as they approached the rejection time point (Fig. 5A). Twenty-nine genes followed this pattern with an
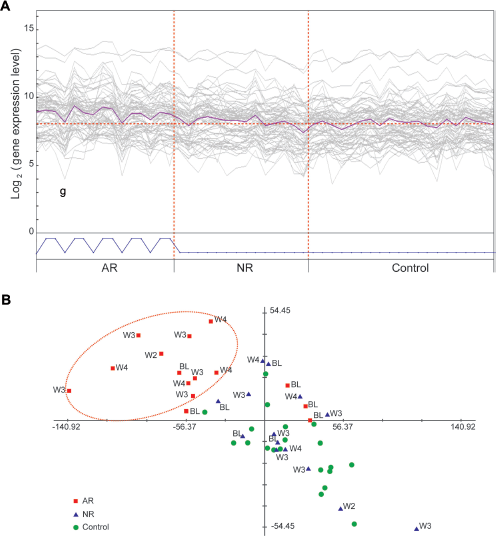
Pattern matching of gene expression changes over time reveals a molecular signature associated with AR.
Twenty-nine genes upregulated from pretransplant levels and maintained at a high expression level as they approach the rejection time point identified from the PTM (Pavlidis Template Matching) analysis.

Functional and Transcriptional Coherency Genes that Covary with DYSF Include Functionally Related Neutrophil Protein Genes and Potential Novel Members of a Biological Network
Having identified genes that were specifically upregulated in AR patients as they approached rejection, we wished to further investigate the potential for identifying tightly coregulated genes within this pattern. To do this, we took the expression pattern of one of the most significantly upregulated genes in rejection patients,
Identification of Highly Represented Transcription Factor Binding Sites within the Differentially Expressed Gene Signatures Reveal Potential Transcriptional Factors Regulating the Biological Response
Finally, our finding that the acute allograft associated differential gene expression patterns displayed a high degree of transcriptional coherency suggested the potential for coregulation of these molecular signatures by specific transcription factors. The identification of such transcriptional hubs might provide suitable targets for the development of therapeutic strategies directed at modulating these expression signatures. In order to gain insight into differential transcriptional regulation in these cell specific signatures, we examined overrepresented transcription factor binding sites among the neutrophil and lymphocyte enriched genes by using oPOSSUM.
29
From this analysis, we identified the most highly represented site in the genes of the T lymphocyte signature was specific to the ETS family transcription factor, GABP (
Discussion
In this study, we have used whole blood transcriptomics to investigate biological processes associated with kidney transplantation and acute allograft rejection. We have been able to identify molecular signatures that correlate with the underlying biology associated with both kidney transplantation and subsequent rejection. These signatures are found to be leukocyte cell type-specific, which potentially reflects systemic inflammation and immune dysfunction in patients following surgery and approaching rejection. Questions as to whether such activities are causal for allograft rejection are beyond the scope of this study, though investigating the primary kidney tissues (not available to us in this instance) might be a useful next step.
While transcriptional activities in peripheral whole blood can provide a system-wide picture of complex immune activities and networks, challenges and limitations to this type of approach exist. Interpretation of the vast amount of multidimensional genomic data can be complex and problematic. Limited patient selection and variation in patient treatment can also introduce potentially confounding factors into the data. Transcript abundance in highly complex tissues, such as blood, may be convoluted because transcript expression levels originate not only from differential regulation of gene transcription but also from changes in cell type population composition.41,42 Previously, Shen-Orr et al have developed a deconvolution method (csSAM), which takes advantage of complete blood cell count and differential (CBC/diff) data to statistically estimate differential gene expression changes within each cell type. 43 Using this approach, Shen-Orr et al 43 showed that groups of significantly upregulated genes within neutrophils and monocytes and significant downregulated genes within lymphocytes were associated with acute rejection in pediatric kidney transplant patients. While we have not undertaken csSAM analysis on our “late” adult kidney rejection samples (due to small sample size and lack of comprehensive CBC/diff data for all patients), our results are consistent with those of Shen-Orr et al 43 and build on their findings, providing further support for the molecular changes in these cell types associated with acute allograft rejection. Additionally, our analysis of time course data provides a biological context with which to interpret the observed expression changes motivated by a desire for biological understanding of the pattern of gene expression changes seen in the transplant recipient over time leading up to rejection. We have also collected whole blood samples that provide an unbiased representation of the transcriptomes from all blood cell types, including neutrophils. This is in contrast to most previously published studies, which are based on lymphocyte biased data that underrepresents or excludes neutrophils (such as peripheral blood mononuclear cell [PBMC] samples), 6 or the use of a lymphocyte biased platform (ie, lymphochip cDNA platform).7,8
From the initial analysis of all 24 AR and 24 NR patient samples, we characterized a differential gene expression signature that was associated with early time points posttransplant (ie, first 4 days posttransplant) and common to both patient groups regardless of their eventual rejection status. This signature was comprised of genes known to be involved in immunosuppression, such as the
The analysis of time-matched postsurgery transcriptome samples revealed gene expression signatures that were significantly different between the AR and NR patient groups. The most significant differences were correlated with cell type-specific processes and adaptive and innate immune responses that can be categorized into 2 general signatures, T lymphocyte activity and neutrophil activity. We found that genes significantly downregulated in transplant patients approaching rejection were enriched in T lymphocytes and involved in processes of T lymphocyte proliferation and activation. Conversely, we found that gene transcripts significantly elevated in the acute rejection patient group as they approached rejection were highly enriched in neutrophils and correlated with neutrophil activities. These molecular signatures appeared to be specific to the acute rejection of the allograft as we observed a general stabilization of the molecular signature in patient samples taken postrejection and after immunosuppressive treatment had been initiated to alleviate the rejection. Furthermore, we found that both the neutrophil and the lymphocyte gene expression signatures that we had described were reasonably conserved in an independent group of kidney transplant patients from a multicentre international study.
We found that lymphocyte genes were in general downregulated in all patient samples. One possible explanation for this is the immunosuppression regime the patients are exposed to as described above. However, persistent suppression of lymphocyte genes was a highly significant feature unique to AR patients approaching rejection when compared with recovering NR patients. Since depression of lymphocyte count and elevation of neutrophil count is known to occur in response to infections or glucocorticoid administration, it is possible that the AR associated signature is due to the presence of an infection or due to steroid treatment. However, at the time of sample collection, patients were not undergoing treatment with glucocorticoids. Furthermore, the treatment regimen did not differ between AR and NR groups. Additionally, the selection of the patient groups and matching of AR and NR patients was carefully designed to avoid potential confounding factors such as demographics and treatment regimen and included clinical records of patient infection status, as described in the confounder analysis.
The suppression of lymphocyte-associated genes in the AR group approaching rejection may represent a state of immune dysfunction and might potentially be associated with uremic conditions.44,45 This notion is supported by the significantly higher levels of creatinine in AR as well as the observation that a large number of chemokines as well as interleukins and their receptors, which promote the development and differentiation of T, B, and hematopoietic cells, are downregulated in AR patients. For example, the IL-7 (IL7R) pathway was one of the most highly downregulated interleukin pathways and a number of studies have demonstrated the role of IL-7 and its signal transducer, STAT5, in the development, differentiation, and survival of T cells. 46 50 The JAK-STAT pathway, a pleiotropic cascade used to transduce a multitude of signals for development and homeostasis in animals, is also downregulated in our data, and it has been shown that dys-regulation of JAK-STAT signaling can result in immune deficiency conditions. 51 Overall, these molecular changes indicate that, in patients approaching rejection, pathways that function in lymphocyte activities are downregulated (at least in relation to neutrophil activities [see below]), potentially representing immune dysfunction and deficiency.
The second category of transcriptional changes that we identified in AR patients was an increase in genes related to neutrophil activities. As shown in the gene enrichment analysis, most genes in this signature are highly enriched in neutrophils and indeed many are almost completely specific to neutrophils. A large proportion of neutrophil granule proteins, which represent neutrophil activation, chemotaxis, and degranulation, are included in this signature. Neutrophils are known to be key mediators in innate immunity and inflammation. The initial inflammatory response, represented by the upregulation of neutrophil enriched genes in our data, is present in all patients immediately after (first 4 days) transplant surgery. However, this signature remains high or is possibly reactivated in patients approaching rejection while appearing to be returning to a more normal range in nonrejector patients.
Neutrophils are known to be critical mediators of ischemic reperfusion injury after organ transplantation. 52 For example, syngeneic lung transplantations can stimulate the expansion of neutrophil progenitors, leading to the accumulation of neutrophils within the peripheral blood and graft tissues. 53 Furthermore, ischemia reperfusion injury prevents immunosuppression-mediated acceptance of mouse lung allografts unless granulopoiesis is inhibited, linking neutrophil accumulation and activities directly with tissue rejection. 54 Neutrophils mediate tissue damage by cytotoxic and proinflammatory cytokine production and can infiltrate the organ within hours after surgical trauma or ischemia has been established. 55 This early inflammation is due to the innate response to tissue injury independent of the adaptive immune systems and occurs before the T cell response.10,11,56 In fact, it has previously been shown that innate immune cells are able to respond to the allograft even in the absence of T lymphocytes.10,57,58 Based on these findings and our own observations, we hypothesize that inflammation arising due to surgery or ischemia reperfusion injury immediately following transplant surgery is returning to a normal range in stabilizing patients, whilst remaining high in patients who go on to reject the organ. These persistent or reactivated innate immune responses might be factors that act to prevent immunosuppression mediated graft acceptance, or alternatively are a consequence of other factors that initiate the rejection.
We have described an overall concordance of the gene expression signatures. The concerted response of these genes suggested a potential for the existence of expression control hubs mediated by specific transcription factors. Using overrepresented transcription factor binding site analysis we found GABP, an ETS family transcription factor known as an essential regulator of IL7-IL7Rα signals that is central to T cell proliferation and development, 59 as the top candidate transcription factor that might regulate transcription of the downregulated lymphocyte genes. Similarly, transcription binding site analysis using the neutrophil signature genes indicated RelA/NF-κB as a transcription factor likely to contribute to the regulation of the expression of genes involved in inflammation.60,61 In addition to well-known functions of toll-like receptors (TLRs) in the induction of the immune response under pathological conditions, modulated by transcription factors such as nuclear factor NF-κB leading to the production of proinflammatory cytokines, TLR activation is found to play a role in differentiation of hematopoietic stem cells as well as prevention of apoptosis in neutrophils. 62
Finally, a high neutrophil to lymphocyte ratio (NLR) has been shown to be a potential predictor of poor outcomes of transplantation, as well as in various diseases. 63 65 In our data, NLR was overall moderately increased in patients approaching rejection, when compared with nonrejectors. Our transcriptionally defined rejection-associated molecular signatures correlate with the observed NLR. The presence of an upregulated neutrophil molecular signature and downregulated lymphocyte molecular signature in patients approaching rejection could potentially represent a “molecular NLR” that might have potential for use as a monitoring tool for posttransplant patients, as the molecular changes preceding and modulating such global changes in cell type populations in blood, as well as cell type-specific gene regulation, may be more sensitive and specific than a direct count of cell populations.
Conclusions
In this study, we describe the use of whole blood transcriptomes for the identification and characterization of molecular signatures associated with kidney transplantation and acute allograft rejection. From this exploratory approach, we have identified an increased gene expression signature comprising genes involved in neutrophil activation that is indicative of systemic inflammation. We find that this signature persists in patients approaching rejection. Additionally, we have described a gene expression signature indicative of immune dysfunction, potentially arising due to conditions associated with the kidney malfunction or uremic conditions. Furthermore, we have demonstrated that circulating whole blood transcriptome profiling is representative of immune responses associated with transplant rejection and that this information might have potential utility for the identification of indicators that can predict acute kidney transplant rejection. The relative ease of obtaining circulating whole blood for the purpose of monitoring rejection makes this approach fundamentally appealing. Finally, characterizing the molecular basis of gene expression signatures associated with the biological and immunological processes that take place during kidney transplant allograft rejection and recovery may provide insight into the improvement of post-transplant maintenance regimens and targeted treatment options.
List of Abbreviations
Non-Rejector
Acute Rejector
Neutrophil to Lymphocyte count Ratio
Negative Strand Mapping Probes
Principal Component Analysis
MultiExperiment Viewer
Pavlidis Template Matching
Significance Analysis of Microarrays.
Author Contributions
HS carried out the data analysis and drafted the manuscript. OG and ZH participated in data analysis. JEW participated in the design of the study and coordination. RTN, RB, RM, and BMM conceived of the study and participated in its design. PAK and SJT conceived of the study, participated in the design of the study and in drafting the manuscript. NMI, GK provided reagents and materials for the study and performed experiments. All authors read and approved the final manuscript.
Supplementary Data
The following additional data are available with the online version of this paper.
Additional File 1
Patient demographic and clinical data for 24 ARs and matched 24 NRs.
Additional File 2
The 5619 probe sets, which survived filtering process.
Additional File 3
Comparison of 24 ARs at rejection and 24 matched NRs against healthy controls. A. PCA plot of 24 AR patient samples at the time of rejection, their 24 matched NR patient samples, and 20 healthy control subject samples. Control samples show tight clustering while patient samples are more dispersed. Limited overlap is observed between normal samples and both AR and NR samples. B. An expression plot of the genes that differentiates control samples from all NR and AR patient samples. These genes display an overall lower level of expression in both AR and NR patients and an increase in the variability of expression between patients when compared with control samples. C. PTM analysis using a defined gene expression pattern that is the highest at the earliest time points posttransplant and lower at the later time points in both AR and NR. Genes following this pattern potentially represent a signature that is associated with the transplant surgery and ischemic injury.
Additional File 4
A. Patient demographic and clinical data for 8 late rejection ARs and their matched 8 NRs. B. Confounder analysis for 8 ARs and 8 NRs.
Additional File 5
SAM analysis using late rejector samples only—Genes significantly downregulated in ARs versus NRs at the time of rejection.
Additional File 6
SAM analysis using late rejector samples only—Genes significantly upregulated in ARs versus NRs at the time of rejection.
Additional File 7
Innate DB analysis using late rejector samples only (day 15 and beyond posttransplant)—overrepresented pathways in the downregulated genes in acute rejectors
Additional File 8
SAM analysis using time course samples collected minimum 15 days post-TX—Cluster of genes significantly upregulated and downregulated in ARs compared to NRs.
Additional File 9
Cell type-specific gene expression signatures replicate across different microarray platforms.
Additional File 10
The 369 genes that covary with
Additional File 11
Gene Ontology (GO) analysis. Overrepresented cellular component GO terms by the genes whose expression most tightly correlates with
Additional File 12
Overrepresented transcription factor binding site analysis.
Footnotes
Acknowledgements
The authors thank all the patients and healthy donors that provided the samples for this research. We acknowledge contributions of clinical research coordinators, nurses, and physicians who made this work possible, including Dr. David Landsberg at St. Paul's Hospital, Vancouver. We also appreciate Dr. Alice Mui, UBC for helpful discussions.
As a requirement of publication the authors have provided signed confirmation of their compliance with ethical and legal obligations including but not limited to compliance with ICMJE authorship and competing interests guidelines, that the article is neither under consideration for publication nor published elsewhere, of their compliance with legal and ethical guidelines concerning human and animal research participants (if applicable), and that permission has been obtained for reproduction of any copyrighted material. This article was subject to blind, independent, expert peer review. The reviewers reported no competing interests.