
Abstract
Background
The aim was to verify whether the density of particulate matter (PM10), the climate, and the mobility of people can influence the pandemic in the 19 regions and in the two autonomous Italian provinces as incidence rate and lethality.
Design and methods
The incidence rates per 100,000 inhabitants and the case fatality ratio (CFR) (dependent variables) in all Italian regions were calculated in January 2021 at John Hopkins University Coronavirus Center. The independent variables were: Minimum average temperatures in the same month (January) of 2020; average pollution of PM10 in the air in each region in the last year available reported on a 0-10 scale to 0 = total absence of PM10 to 10 maximum pollutions; number of places in hotels occupied per inhabitants in 2020. Linear regression and Multiple Regression Analysis were carried out.
Results
The spread of the COVID-19 in the Italian regions seems to be related to pollution of PM10, the number of beds occupied in hotels (as an index of mobility and temperature (indirect correlation). On the contrary, the CFR correlates inversely with temperature but not with pollution. Measuring the concomitant effect of two independent variables by means of Multiple Regression Analysis, temperature and pollution show a synergistic effect on COVID-19 incidence.
Conclusions
The study seems to confirm the literature on the influence of temperature on the lethality of COVID-19 but adds the new results of an inverse relationship between the spread of the virus and low temperature in regions between the Mediterranean area (which includes southern Italy and Sicily and Sardinia islands) and the cold European temperate zone which includes the northern regions under the Alps. A new date also concerns the summation effect of the risk between cold weather and PM10 air pollution was found. Due to several methodic weakness the study has an exploratory than conclusive relevance.
Significance for public health
This paper has an exploratory value because a homogeneous population is taken into account. Presented results that basically contain the combined effect of cold climate (and pollution by PM10) on COVID-19 must be confirmed.
Introduction
The first case of Coronavirus 2019 (COVID-19) was identified in the city of Wuhan (China) at the end of 2019; a few months later, the epidemic had reached more than 200 countries.1,2 COVID-19 was declared a pandemic by the World Health Organization (WHO) on March 11, 2020. 3 Italy was one of the first nations to be affected and currently has a death rate from Covid-19 (136.61 x 100.000 inhabitants at 20 January 2021) that is among the highest in the world. 4 Worldwide, an enormous effort has been undertaken by researchers to produce effective vaccines in a short time, 5 to understand how to counteract the symptoms of pathological manifestations, such as acute respiratory syndromes and intravascular coagulation, resulting from infections, 6 and to try to understand the ecological factors that could influence the pandemic. 7 Among those factors, the most studied as potential determinants of the pandemic have been climate, 8 nitrous oxide (NO2)-induced pollution, 9 and particulate matter (PM), and mobility of people.10,11
At present, it is clear that air pollution, such as PM, can influence COVID-19 spread, while the data on the influence of pollution concerning the aggressiveness and lethality of the virus are less convincing. 12 On the contrary, concerning weather influences, more robust data address the high lethality of COVID-19 ranging from cold temperatures to warm or boreal climates, 13 also with possible modifications influenced by the passing of the seasons. 14 The role of mobility has still not been sufficiently investigated given the difficulty of accessing reliable data even if a well- known influence of the level of mobility on the pandemic has been shown. 11 Italy is a favorable situation for conducting this type of mobility-related investigation because throughout the national territory, a national public health system with free access to services for the citizen exists, which records data (such as new cases of COVID-19 and deaths caused by COVID-19) among the different regions using a homogeneous method. Healthcare is managed on a regional basis but with the use of national quality systems and relatively homogeneous per capita expenditure. Furthermore, the pandemic has been around for almost a year, and therefore, the expansion phase is similar. The systems that can be used to measure the independent variables are also homogeneous on a national basis. All of these elements, therefore, make the comparison system reliable. The Italian regions are also sufficiently homogenous with respect to age and gender distribution of the populations 15 since these parameters are known variables in influencing COVID- 19 mortality and probably also its spread.
The aim of this work was to verify whether the density of PM, the climate, and the mobility of people from the outside can influence the pandemic in the 19 regions and two autonomous Italian provinces as an incidence rate and lethality level measured as the case fatality ratio (CFR).
Design and Methods
The incidence rates per 100.000 inhabitants since the beginning of the pandemic (21 February 2020 to 19 January 2021 and CFR (dependent variables) in all Italian regions and in the two autonomous provinces of Trento and Bolzano were calculated as of January 19, 2021, on the basis of data from the John Hopkins University Coronavirus Center. 4 This site reports the official data of the Italian Ministry of Health and Civil Protection. The independent variables were extracted as average values for each region and autonomous provinces from several official databases:
Minimum average temperatures in the same month (January) of 2020, ISPRA 2020; 16
Average pollution of PM10 in the air in each region in the last year available (2019), ISPRA 2020, the indicator reported on a scale of 0-10 on which 0 = total absence of PM and 10 is the maximum pollution; and
Number of places in hotels occupied per inhabitants in 2020 until December 15. 17
We calculated the linear correlation for each of the two dependent variables (incidence of COVID-19 x 100,000 inhabitants between February 2020 and January 2021 and CFR) and for the three independent variables (PM10 Medium in 2020; Number of nights in hotel in 2020 x inhabitants; Mean Minimum temperatures in January) in each region and autonomous province as Pearson's R coefficient. We then conducted a multiple regression analysis coupling the correlated variables in pairs to verify the complex effect.
Results
Table 1 shows the linear correlations between the two examined dependent variables and the three independent variables. As can be seen, the incidence per 100,000 inhabitants shows a correlation with all the three of the examined variables examined: (1) PM10 medium (as indicator of air purity) 2020 r= -0.0334 (inverse correlation), p=0.021; (2) number of nights in hotel x year x inhabitants, r = 0.488, p = 0.024; and (3) mean minimum temperatures in January r = -0.522 (inverse correlation), p=0.009. In contrast, the CFR correlates negatively only with mean minimum temperatures in January r = -0.552, p=0.009. For the multiple regression analysis using the dependent variable Y = incidence, and independent variable X1 = PM10 and independent variable X2 = number of beds occupied in hotels x inhabitants, R square (R2) was equal to 0.247779. This finding indicates that the predictor (Xi) explains 24.8% of the variance of Y. Adjusted R2 was equal to 0.208188. The coefficient of multiple correlations, (R), was 0.497774. This finding indicates that a moderate direct relationship between the predicted and observed data (ŷ and y, respectively) exists. Overall regression showed right-tailed F(1,19) = 6.258523 and p-value =0.0216624. The linear regression model, Y = b0+ b1X1 +…+ bpXp, provided a better fit than the model without the independent variables, resulting in, Y = b0; The independent variable, iX2, was significant as a predictor for Y; therefore, it was excluded from the model. The Y-intercept (b) was two-tailed, T = 3.527832 with a pvalue =0.00224868. Hence b was significantly different from zero.
Correlation between the two dependent and the three independent variables examined.
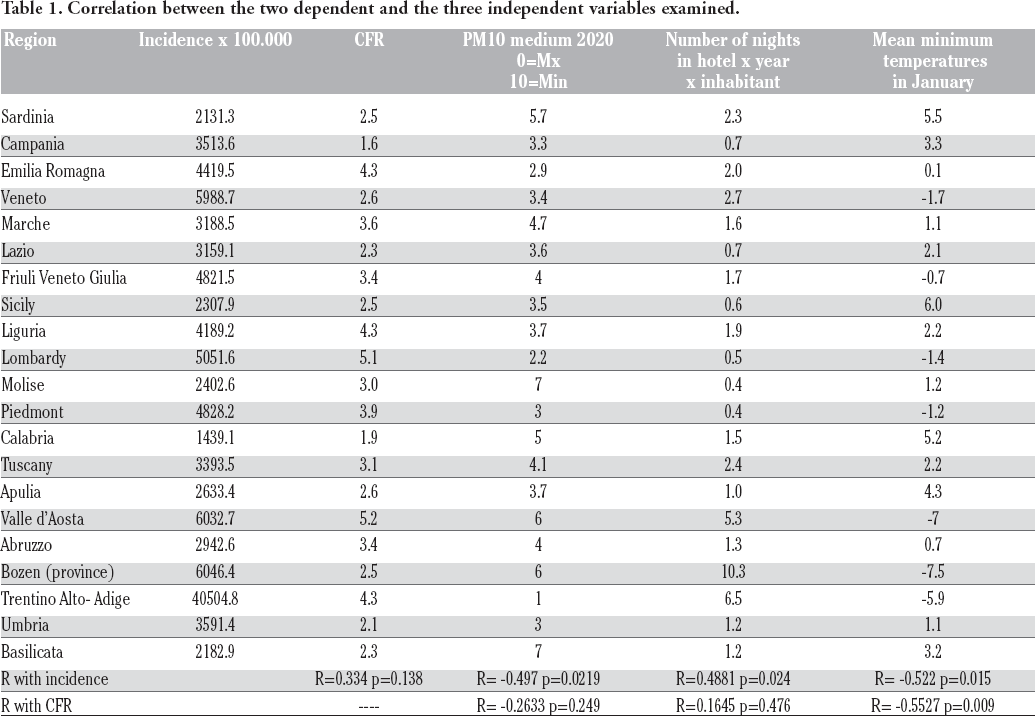
Using the dependent variable, Y = Incidence, independent variable X1 = PM10, and independent variable X2 = mean minimum temperature in January, R2 was found to be 0.474670. This finding indicates that the predictor (Xi) explains 47.5% of the variance of Y. Adjusted R2 was 0.416301. The coefficient of multiple correlations (R) was 0.688963 and indicates that a strong direct relationship between the predicted data (ŷ) and the observed data (y) existed. Overall regression: right-tailed, F(1,18) = 8.132103 and pvalue =0.00304710. The linear regression model, Y = b0+ b1X1 +…+bpXp, provided a better fit than the model without the independent variables resulting in Y = b0. All of the independent variables (Xi) were found to be significant. The Y-intercept (b) was two-tailed with T = 4.010683, and p-value =0.000820084. Hence b was significantly different from zero. Using dependent variable Y=incidence; independent variable X1= number of beds occupied x inhabitant and independent variable X2=mean minimum temperature in January, R square (R2) was equaled 0.272233. It means that the predictors (Xi) explain 27.2% of the variance of Y. Adjusted R square was equals 0.233929.
The coefficient of multiple correlations (R) was 0.521759. It means that there is a moderate direct relationship between the predicted data (ŷ) and the observed data (y). The overall regression showed right-tailed, F(1,19) = 7.107244, p-value =0.0152691. Since p-value < α (0.05), we rejected H0. The linear regression model, Y = b0+ b1X1 +…+bpXp, provides a better fit than the model without the independent variables resulting in Y = b0. The following independent variable X1 was not significant as a predictor for Y; therefore, it was excluded from the model. The Y- intercept (b) was two-tailed with T = 3.898631, and a p-value =0.000965824; hence, b was significantly different from zero.
Discussion
The study seems to indicate that the spread of the COVID-19 epidemic in the Italian regions is closely related to environmental variables such as pollution of PM10 (indirect correlation with indices of air purity), the number of beds occupied in hotels (index of the mobility of people, correlation direct) and temperature (indirect correlation), On the contrary, the lethality of the virus measured as CFR inversely correlated with the temperature alone. This work focused on a specific interest because it is known that the study of environmental factors is often affected by co-variables that are not always easy to treat, such as potential confounders, including social distancing,18,19 models of health systems influencing access to care,20-23 genetic profiles of populations,24,25 and differences in phases of an outbreak in different countries. 26 In this case, we are working on a population in which most of these variables are balanced. However, when we add two by two, the independent variables that showed a correlation with the highest incidence, only the mean temperature and pollution demonstrated a synergistic effect, while the effect of the indicator of territorial mobility did not show an increase in the effect of each of the two analyzed variables.
However, it should be noted that the regions of Northern Italy are the coldest as shown in Table 1. In descending rank, Bolzano, Valle d'Aosta, Trentino, Veneto, and Lombardy, were the most polluted (Table 1). Shown in descending rank are Trentino, Lombardy, Emilia Romagna, Piedmont, and Umbria in which there is higher average mobility of people (Table 1). Descending ranking Bolzano, Trentino, Valle d'Aosta, Veneto, and Toscana are shown in descending rank but are those areas with the highest incidence of COVID-19 (Table 1). Descending ranking Bolzano, Valle d'Aosta, Veneto, Lombardy, Piedmont). It is, therefore, possible that the analysis of regression of the last element alone suffers from the confounding effect of the relationship with the other two variables and therefore, shows a fictitious relationship that offers nothing additional with respect to the sum with the other two in the multiple regression analysis. On the other hand, the measure of mobility between regions we adopted does not mean that territorial mobility can be excluded as a determinant of the pandemic spread. The number of beds occupied in the hotel is an indicator that does not take into account the mobility determined by other variables, such as campsites, bed and breakfasts, and second homes. Therefore, considering the limits of this indicator, we can only say that the bed number cannot add significant value to the variability shown by temperature and leachate pollution. The effect of PM pollution is an extensively studied element in the literature, and the evidence of its direct relationship with the spread of the virus is quite robust.27-29 Inhaled PM particles are suggested to cause compromise to the immune response in respiratory systems by interfering with angiotensin 2 converting enzyme, resulting in susceptibility to COVID-19 infection. Furthermore, activation of other inflammatory diseases can induce a cytokine storm thus favoring and/or aggravating the symptoms of COVID-19. 30
So far, the study of the influence of climate on Covid-19 has been studied in relation to the lethality of the virus rather than the spread of the pandemic. The warmest provinces of some Italian Regions were found to have the lowest CFR for COVID-19. 31 It was also found that the areas with tropical climates (Netherlands, France, and UK) had lower CFRs than those in some other countries in Europe. 32 Coherently, the equatorial nations had lower COVID-19 lethality than other countries (with the exclusion of Ecuador, which had a cold climate due to the mean altitude). 8 However, the relationship, at least outside the temperate areas, is not linear; while the central cold temperate countries of Europe shows the highest levels of CFR, the sub-arctic and Mediterranean ones had lower CFRs. 13 Furthermore, the trend of CFR decrease in summer was seen both in temperate areas in the Southern rather than in the Northern hemisphere (similarly in Australia 33 and Chile 34 ). This study seems to confirms the literature concerning the influence of temperature on the lethality of the COVID-19 but adds new results about an inverse relationship between the spread of the virus and temperature (the lower the temperature, the higher the spread) in regions between the Mediterranean area (which includes southern Italy, and Sicily and Sardinia Islands) 14 and the cold temperate zone, which includes the Northern regions under the Alps.35 New data also address the summation effects of the risk between cold weather and PM10 air pollution although it need to be confirmed.
The study has the strong limitations of ecological studies in which it is practically impossible to balance all of the confounding variables. Furthermore, dealing with routine macro- indicators for measuring the variables, suffers from the scarce flexibility of these indicators. However, at least some confounders may have been balanced by the fact that we worked with a homogeneous population. The study has more of a heuristic and exploratory value rather than providing a definitive verification of hypotheses. The synergistic effect of the cold climate (within the limits of temperate areas) and pollution by PM10 must be confirmed by broader studies in terms of resources and methodology. The results could in fact be of importance in terms of public health and preventive strategies.