
Abstract
The interpretation of cell transplantation experiments is often dependent on the presence of an exogenous label for the identification of implanted cells. The exogenous labels Hoechst 33342, 5-bromo-2′-deoxyuridine (BrdU), PKH26, and Qtracker were compared for their labeling efficiency, cellular effects, and reliability to identify a human neural stem cell (hNSC) line implanted intracerebrally into the rat brain. Hoechst 33342 (2 mg/ml) exhibited a delayed cytotoxicity that killed all cells within 7 days. This label was hence not progressed to in vivo studies. PKH26 (5 μM), Qtracker (15 nM), and BrdU (0.2 μM) labeled 100% of the cell population at day 1, although BrdU labeling declined by day 7. BrdU and Qtracker exerted effects on proliferation and differentiation. PKH26 reduced viability and proliferation at day 1, but this normalized by day 7. In an in vitro coculture assay, all labels transferred to unlabeled cells. After transplantation, the reliability of exogenous labels was assessed against the gold standard of a human-specific nuclear antigen (HNA) antibody. BrdU, PKH26, and Qtracker resulted in a very small proportion (<2%) of false positives, but a significant amount of false negatives (~30%), with little change between 1 and 7 days. Exogenous labels can therefore be reliable to identify transplanted cells without exerting major cellular effects, but validation is required. The interpretation of cell transplantation experiments should be presented in the context of the label's limitations.
Keywords
Introduction
The correct identification of transplanted cells in host tissue is essential for the proper interpretation of cell therapy studies 1 . Survival and differentiation of implanted cells can only be accurately assessed if grafted cells can be distinguished reliably from host cells 2 . Hence, it is essential that the methods of identification are specific to implanted cells and are not transferred to host cells, potentially leading to a false-positive identification and erroneous conclusion that implanted cells survived and differentiated into site-appropriate mature phenotypes3,4. Conversely, if implanted cells cannot be readily detected inside the host tissue, an underestimation (i.e., false negatives) could lead to a misinterpretation of the effects of implanted cells on host tissue 5 . The unambiguous interpretation of cell therapy is therefore highly dependent on a reliable identification of implanted cells6,7.
The identification of implanted cells can be achieved by cell-specific characteristics that are different from the host tissue. Endogenous markers, such as the detection of the Y-chromosome of implanted male cells in female hosts8,9 and antibodies against species-specific antigens10,11, are the most reliable form of detection, but cannot always be applied, as in the case of syngeneic/allogeneic transplants, which constitute the most relevant clinical paradigms 9 . Indeed, even the distinction of mouse cells in rat brains has proven difficult. The use of genetic reporters, such as LacZ12,13 and green fluorescent proteins 14 17 , can overcome some of these issues. Nevertheless, silencing of these genes upon differentiation (false negatives), as well as false-positive detection, limits their interpretation18,19. A further concern for human studies is that genetic modification of cells can affect cellular characteristics 20 , such as differentiation, or invoke an immunological response 21 .
Exogenous markers that are nonpermanently inserted into the cells for identification upon implantation provide an alternative in situations where endogenous markers cannot be used1,22. For histological detection, a variety of exogenous labels are available ranging from histochemical dyes (e.g., Hoechst 33342, fast blue, carboxyfluorescein succinimidyl ester) 23 27 to fluorescent labels (e.g., PKH26, DiI, DiO, Quantum Dots)26,28-30. A major concern with these exogenous labels is their potential to be exocytosed and lead to a false-positive identification of host cells as transplanted cells 31 . The validation of their reliability as markers of implanted cells remains a challenge, and a “gold” standard is needed to distinguish host and implanted cells. A species-specific antibody against human cells in the rat brain can provide this validation 32 . Cellular effects of inorganic materials are also a concern33,34. For instance, 5-bromo-2′-deoxyuridine (BrdU) has been reported to affect neuronal differentiation35,36, as well as being transferred to host cells 37 39 . Only rarely do studies compare multiple labels in the same type of cell26,40,41, and this has not, to our knowledge, been done for neural stem cells (NSCs).
To establish the reliability of different commonly used exogenous markers for the identification of NSCs after intracerebral implantation, the exogenous labels Hoechst, BrdU, PKH26, and Qtracker were compared for their cellular effects in vitro on a single human NSC line, in addition to validating the identification of implanted human cells in the rat brain against a gold standard detection using a species-specific antibody.
Materials and Methods
Experimental Approach
To compare the reliability of different exogenous labels, a series of in vitro assays are conducted that provide Go/No-Go decision points to progress each label (Fig. 1A). In vitro assays determined labeling efficiency, toxicity, as well as potential effects on proliferation and differentiation (Fig. 1B) prior to evaluating their reliability after intracerebral implantation.
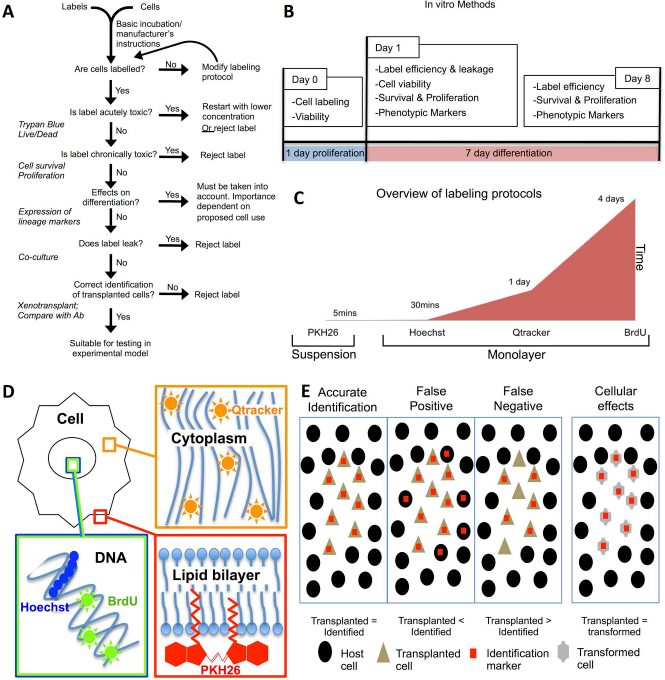
Experimental design. (A) Investigative flowchart to determine if labels affect cellular function and provide a reliable identification of transplanted cells. (B) Overview of in vitro experiments to determine cellular effects of labeling. On day 0, cells are labeled using the various methods, and acute toxicity is determined using viability measures. On day 1, the efficiency of labeling (percent cells labeled), viability (percent alive/dead at that moment), survival (cell numbers), and phenotypic characteristics are determined. To ensure persistence of the label without ill effects, the number of cells remaining labeled (efficiency), survival and proliferation, as well as potential impact on phenotypic differentiation are evaluated on day 8. (C) Overview of labeling methods in terms of culture conditions and time used for labeling. PKH26 in contrast to the other methods is a short-labeling protocol performed in suspension. Hoechst requires a relatively short labeling period while cells are growing, whereas 5-bromo-2′-deoxyuridine (BrdU), which only gets incorporated into cells in the S phase, requires 4 days of labeling to ensure that a sufficiently high percentage of cells are actually labeled. These methodological differences further affect the potential use of a particular approach. (D) Exogenous labels integrate into different intracellular locations. PKH26 integrates into the cell membrane, Qtracker into the cytoplasm, whereas Hoechst and BrdU insert into DNA in the nucleus. (E) Principles of identifying correctly labeled cells versus false positives (labeled host cells, type I error, specificity) and negatives (unlabeled implanted cells, type II error, sensitivity), as well as potential effects of cell labeling on cell phenotype (e.g., differentiation).
All procedures described here were approved by the Human Stem Cell Research Oversight (hSCRO) committee at the University of Pittsburgh. The institutional review board (IRB) determined that the use of human NSCs did not involve human subjects according to federal regulations [§45 CFR 46.102(f)].
Human Neural Stem Cell (HNSC) Line
The ganglionic eminence-derived NSC line STROC05 (ECACC accession number 04110301;ReNeuron, Gilford, UK) was cultured and passaged, as previously described in detail42,43. In brief, STROC05 NSCs were conditionally immortalized using cMyc-ERTAM under the control of 4-hydroxytamoxifen (100 nM; Sigma-Aldrich, St. Louis, MO, USA). In the absence of 4-hydroxytamoxifen, NSCs will cease proliferation and undergo differentiation. NSCs were expanded on laminin (10 μg/ml; Sigma-Aldrich)-coated flasks until they reached a 70%-80% confluency. Recombinant human basic fibroblast growth factor (bFGF; 10 ng/ml; PeproTech, Rocky Hill, NJ, USA) and epidermal growth factor (EGF; 20 ng/ml; PeproTech) were used as mitogens in serum-free medium supplemented with various factors (Table 1). All culturing was performed without the addition of antibiotics at 37°C in 5% CO2.
Components Added to DMEM/F12 Basal Medium for STROC05 Proliferation Medium

For differentiation medium, bFGF, EGF, and 4-hydroxytamoxifen were omitted.
Cell Labeling
Labels were used according to the manufacturers' instructions or as previously used for cell tracking. This resulted in a range of different conditions and incubation times (Fig. 1C). Exogenous labels target different subcellular structures and hence might exert different cellular effects and have different propensities for exocytosis (Fig. 1D).
Hoechst 33342
Hoechst binds to the adenine-thymine (AT)-rich minor groove of DNA, with an excitation peak at 346 nm and an emission at 460 nm 44 . A stock solution of Hoechst 33342 (2 mg/ml; Sigma-Aldrich)23,45,46 was added to cells at 1:1,000 for a final concentration of 2 mg/ml for 30 min. Cells were washed three times with Hank's balanced salt solution (HBSS; Thermo Fisher Scientific, Waltham, MA, USA) before being harvested. Because of the toxicity of Hoechst to this cell line, dilutions down to 0.02 μg/ml were tested, but a similar cell loss was observed. However, endothelial cells (ECs) were unaffected (data not shown).
BrdU
BrdU is incorporated into DNA, replacing thymidine, during DNA replication, which occurs during cell prolif eration and repair 37 . It is detected using antibodies, so the excitation/emission can be tailored as required. For this study, we used Alexa Fluor 555 (Thermo Fisher Scien tific), with excitation at 555 nm and emission at 580 nm. A stock solution of BrdU (50 mM) was diluted 1:250 (0.2 mM) and filtered (0.22-μm pore size) prior to addition to growing cells at 0.2 μM at 37°C 36 . BrdU-supplemented medium was replaced twice a day for 4 days.
PKH26
PKH26 is a lipophilic dye that is incorporated into lipid regions of the cell membrane. As it becomes internalized during endocytosis, it is also incorporated into organelle membranes, giving its punctate appearance 47 . PKH26 excitation peaks at 551 nm with emission at 567 nm. As previously reported28,48, cells were suspended (5 × 10⁵ cells/ml) in PKH26 solution at a final concentration of 5 μM PKH26 in Diluent C for 4 min. An equivalent volume of human albumin solution (1%; Biosera, Kansas City, MO, USA) was added and incubated for a further 1 min prior to three washes in Dulbecco's modified Eagle's medium/nutrient mixture F12 (DMEM/F12; Sigma-Aldrich).
Quantum Dots
The Qtracker system consists of Qdot nanocrystals (10-20 nm) coated with a proprietary targeting peptide for localization to the cytoplasm 49 . Qtracker 565 (Thermo Fisher Scientific) excitation peaks at 405-525 nm with emission at 565 nm. Qtracker 565 was prepared by mixing components A and B for 5 min at room temperature. Qtracker (15 nM) and human serum albumin (HSA; 2%; Biosera) in medium were vortexed for 1 min prior to incubation with cells for 24 h at 37°C. Cells were washed twice and incubated in fresh medium at 37°C for 2.5 h.
In Vitro Studies of Cellular Effects
Acute Toxicity
Trypan blue dye was excluded from viable cells with an intact membrane, whereas dead or dying cells were permeable to the dye. Equal amounts of cell suspension and trypan blue solution (HyClone, Logan, UT, USA) were thoroughly mixed. Counts of total cells and dead cells were taken on a hemocytometer and expressed as a percentage of viable cells.
Phototoxicity
Certain exogenous labels can induce toxicity through their interaction with light 50 . This phototoxicity has previously been reported for PKH26 51 , Hoechst 52 , and others40,53. For this, cells were labeled and seeded at 1 × 10⁵ cells/well prior to exposure to either ambient light in the tissue culture hood for 1 h or fluorescent light for 5 min at the label's excitation wavelength, or using 4′,6-diamidino-2-pheylindole (DAPI) filters for unlabeled and BrdU cells. Control conditions were included where cells either remained in the incubator or were left in the hood without light exposure to control for effects of temperature and CO2 variation.
All wells were returned to the incubator overnight. Using a lactate dehydrogenase (LDH) cytotoxicity assay kit (Thermo Fisher Scientific), cells were assessed for membrane damage leading to cell death. Supernatant (50 μl) was removed from each well to provide a measure of LDH released due to cell death or membrane damage. To provide a measure of maximal LDH release and control for cell number variation, lysis buffer was added for 45 min to the remaining medium to lyse all cells. To measure background activity in the medium, fresh medium was also included. The LDH dye was added and allowed to react for 30 min at room temperature in the dark before stop solution was added. Absorbance was measured at 490 nm with background (680 nm) subtracted. Cytotoxicity was calculated as:

Cell Viability/Acute Toxicity—Live/Dead
Live cells were detected with green fluorescent calcein acetoxymethyl (AM) (intracellular esterase activity; Thermo Fisher Scientific), whereas the red ethidium homodimer-1 (EthD-1; Thermo Fisher Scientific) indicated dead or dying cells. For this, cells (1 × 10⁵ cells/well) were cultured in proliferation medium for 24 h at 37°C prior to the addition of 4 μM EthD-1 and 2 μM calcein AM [in phosphate-buffered saline (PBS); 300 μl]. After the addition of EthD-1 and calcein AM, cells were cultured in the dark for 30 min. Cells were then live imaged immediately.
Cell Survival/Chronic Toxicity
After labeling, cells were cultured for 24 h in proliferation medium. Cells for the day 1 time point were then fixed, while cells for the day 7 time point were transferred into differentiation medium and cultured for a further 7 days. The total number of DAPI-stained nuclei was counted over nine fields of view per coverslip (445 × 335 μm, 20× objective) and compared to unlabeled STROC05.
Cell Proliferation
The number of Ki-67+ (1:500; Abcam, Cambridge, MA, USA) cells was expressed as a percentage of DAPI nuclei, giving the percentage of cells expressing this marker of proliferation.
Cell Differentiation
To assess effects on differentiation, cells were stained with a marker of astrocytic lineage, mouse anti-glial fibrillary acidic protein (GFAP; 1:3,000; Sigma-Aldrich); a marker of early neuronal lineage, class III β-tubulin (Tuj1; 1:500; Abcam); and an oligodendrocyte marker, galactocerebroside (Galc; 1:300; EMD Millipore, Billerica, MA, USA) (see Immunocytochemistry below for a detailed procedure). The number of cells staining positively for each of these markers was expressed as a percentage of DAPI+ cells, counted over five fields of view per coverslip.
In Vitro Label Transfer
In order to assess label leakage in vitro, NSCs were labeled, cultured overnight, and then mixed with unlabeled ECs (1:1 ratio) in suspension before seeding the mixture into wells. The immortalized human cerebral microvascular EC line (hCMEC/D3; gifted by Dr. Pierre-Olivier Couraud, Institut Cochin, Paris, France)54,55 was cultured in tissue culture flasks (BD Biosciences, San Jose, CA, USA) coated with rat tail collagen type I (150 μg/ml; BD Biosciences) at 37°C in 5% CO2 using endothelial basal medium-2 (EBM-2; Lonza, Allendale, NJ, USA), supplemented with 5% fetal bovine serum “gold” (PAA; Cell Culture Company, Minneapolis, MN, USA), 5 μg/ml ascorbic acid (Sigma-Aldrich), 1% chemically defined lipid concentrate (Invitrogen, Carlsbad, CA, USA), 10 mM 4-(2-hydroxyethyl)-1-piperazineethanesulfonic acid (HEPES) buffer (Sigma-Aldrich), and 1% penicillin/streptomycin (Invitrogen) (Table 2). Cells were passaged at 95% confluency.
hCMEC/D3 Medium Components
The medium and coating for the two cell types were mixed in a 1:1 ratio 56 . After 24 h, cultures were stained for nestin, which is present in NSCs but not in ECs. Therefore, colocalization of nestin and the tested label indicates correct identification, whereas the presence of the label in a nestin− cell indicates label leakage. In order to rule out the possibility that observed results were only due to mechanical transfer between cells during the pipetting process, other paradigms were investigated.
Immunocytochemistry
Cells were rinsed twice with HBSS before being incubated for 15 min with cold 4% paraformaldehyde (PFA; Electron Microscopy Sciences, Hatfield, PA, USA). Coverslips were washed 3 × 5 min in PBS and incubated in blocking solution (PBS + 10% normal goat serum; Vector Labs, Burlingame, CA, USA; +0.1% Triton X-100; Sigma-Aldrich) for 1 h at room temperature. Primary antibodies were applied overnight (Table 3) prior to incubation with appropriate Alexa Fluor secondary antibodies (1:500; Molecular Probes, Eugene, OR, USA) for 1 h at room temperature and washed 3 × 5 min in PBS. Coverslips were mounted onto slides with Vectashield + DAPI mounti ng medium (Vector Labs). Visualization of BrdU required a two-step procedure. Immunocytochemistry for other antibodies was performed first, followed by an additional fixation with 4% PFA for 20 min to preserve the previous staining and 3 × 5 min washes with PBS. An acid treatment to denature DNA afforded binding of the BrdU antibody. Coverslips were incubated on ice for 10 min with 1.0 M HCl (hydrochloric acid; Sigma-Aldrich), then 10 min at room temperature in 2.0 M HCl followed by 20 min in 2.0 M HCl at 37°C. To neutralize the acid, 0.1 M borate buffer (sodium tetraborate decahydrate; Sigma-Aldrich) was applied for 12 min at room temperature. Overnight incubation with the BrdU antibody (rat anti-BrdU; 1:5,000; AbD Serotec, Raleigh, NC, USA) and the relevant Alexa Fluor secondary were completed as described above.
Antibodies and Concentrations Used for Immunocytochemistry and Immunohistochemistry

In Vivo Cell Transplantation
Animals
Male Sprague-Dawley rats (180-200 g; Taconic, Hudson, NY, USA) were allowed 7 days of accli matization prior to cell transplantation. Each animal received one cell transplantation into each hemisphere, each consisting of a different label (n = 5 per label/time point). Animals were perfused at 1 and 7 days posttransplantation. All procedures complied with the Institutional Animal Care and Use Committee (IACUC) of the University of Pittsburgh, as well as National Institutes of Health (NIH; Bethesda, MD, USA) guidelines.
Cell Preparation
All labeling was performed using the same concentration of reagents than for in vitro characterization experiments (see above). To reduce potential in vivo leakage 57 , labeled and washed cells were incubated overnight in fresh proliferation medium. Cells were washed three times with HBSS before being harvested and resuspended in PBS to achieve a cell density of 50,000 cells/μl using the following formula 58 :

where VL is the volume of liquid to be added, VT is the total desired volume of suspension (μl), and VC is the cell volume = total cell number × 3.912 pl (volume of 1 cell).
Adjustments were made if the density was more than 10% different from the target density. A consistent high viability of >85% for 7 h was maintained when cells were kept at room temperature after suspension at 50,000 cells/μl. Samples of injected cell suspensions were measured for cell viability (trypan blue) before and after each surgery, as transplantation of dead cells is known to have effects on label leakage and reuptake 39 . For each animal, separate aliquots were prepared to minimize potential density variations and loss of viability due to repeated resuspension.
Stereotactic Surgery
Using isoflurane anesthesia (4% induction, 2% maintenance in medical air), animals were secured in a stereotactic frame (Kopf Instruments, Tujunga, CA, USA). Under aseptic conditions, a frame-mounted drill (Fore dom Electric, Bethel, CT, USA) was used to make small burr holes in the skull at −0.9 mm anterior and ±2.5 mm lateral to bregma with deposits delivered −6 mm ventrally to the surface of the cortex. The cell suspension was briefly pipetted (5×) to resuspend cells (5 μl) in a 10-μl Hamilton syringe. For each exogenous label, separ ate syringes were used to avoid cross contamination. The syringe was attached to the frame, and the 26-gauge needle was inserted slowly to 5.5 mm below the dura. Cell suspension (4 μl; total ~200,000 cells) was then injected at 1 μl/min using a frame-mounted automated micro-injector (Micro4; World Precision Instruments, Sarasota, FL, USA). The needle was left in place for an additional 2 min before being slowly removed. Each animal received two injections of a single deposit (different experimental groups), one in each hemisphere. The two burr holes were then sealed with bone wax (Thermo Fisher Scientific) before the incision was sutured. Animals were given topical analgesic cream (2.5% lidocaine and 2.5% prilocaine; Sandoz, Princeton, NJ, USA) and Buprenex [0.05 mg/kg, intraperitoneally (IP); Henry Schein, Melville, NY, USA]. No immunosuppression was given.
Perfusion-Fixation
Animals were given IP injections of pentobarbital sodium (10 mg/100 g body weight; Fatal Plus; Vortech Pharmaceutical Ltd., Dearborn, MI, USA) until all reflexes were absent. Ice-cold PBS (0.01 M) was perfused transcardially to flush blood out of the system, followed by ice-cold PFA (4% in 0.01 M PBS). Brains were excised and postfixed in 4% PFA overnight before being cryoprotected in 30% sucrose with 0.5% sodium azide (Sigma-Aldrich).
Immunohistochemistry
Brains were cut at 40-μm section thickness on a cryostat (Leica Microsystems, Buffalo Grove, IL, USA) and stored in tissue cryopreservation solution (TCS; 30% ethylene glycol, 25% glycerol, and 0.5% sodium azide in PBS) to prevent freezing at −20°C. Immunohistochemistry followed the same procedure as immunocytochemistry, except that after secondary antibodies were removed, sections were counterstained with the nuclear marker Hoechst (1 μg/ml in PBS; Sigma-Aldrich) for 5 min, and Vectashield mounting medium was used.
Image Analysis
Using an AxioImager M2 microscope (20× objective; Carl Zeiss Microscopy, Peabody, MA, USA) with Stereo Investigator software (MBF Bioscience, Williston, VT, USA), the first, last, and center sections containing human-specific nuclear antigen-positive (HNA+) cells were chosen as a representative coverage of the graft with Hoechst+, HNA+, and/or exogenous labels counted using ImageJ64 (NIH). Cells (Hoechst+) were categorized as “correctly identified” if both HNA and the label were present, “false-negative” cells were defined as HNA+ without an exogenous label, whereas “false-positive” cells contained an exogenous label but were HNA− (Fig. 1E) 59 .
Statistics
Statistical tests were performed using Prism 5.0f (GraphPad, San Diego, CA, USA). A nonparametric Mann-Whitney test was used to compare each group of labeled cells with its matching control, whereas a Friedman test with Dunn's multiple comparison test was used to analyze cell viability over time. For in vivo analyses, Kruskal-Wallis tests were used with Dunn's multiple comparison test. For in vitro assays, three biological replicates, each with three technical replicates, were conducted to give n = 9. For in vivo analysis, n = 5 per label per time point. Data were displayed using the median as a measure of centrality with range as a measure of variance.
Results
Efficiency of Cell Labeling and Toxicity
Exogenous labels are inherently different in their biophysical properties, influencing the uptake characteristics of the agents into the cells, as well as their intracellular localization. Specifically, Hoechst and BrdU are both bound to DNA and are therefore localized to the nucleus of a cell (Fig. 2A). In contrast, PKH26 and Qtracker are cytoplasmic with some evidence of membrane labeling. Hoechst and BrdU show continuous labeling throughout the nucleus, whereas PKH26 and Qtracker show punctate fluorescence throughout the cell body. All exogenous labels allow a robust in vitro labeling that affords the visualization of a population of cells (Fig. 2B). Label efficiency is high with ~100% of cells labeled for all labels at day 1. At day 7, PKH26 and Qtracker maintain their high efficiency, whereas BrdU declines significantly (p < 0.01) to 87% (Fig. 2C). A major challenge to the BrdU labeling is that it is only taken up into dividing cells. Since the other labels permeate into both dividing and nondividing cells, they appear more consistent across the population and are not as readily diluted. Therefore, BrdU constitutes the least-efficient exogenous label.
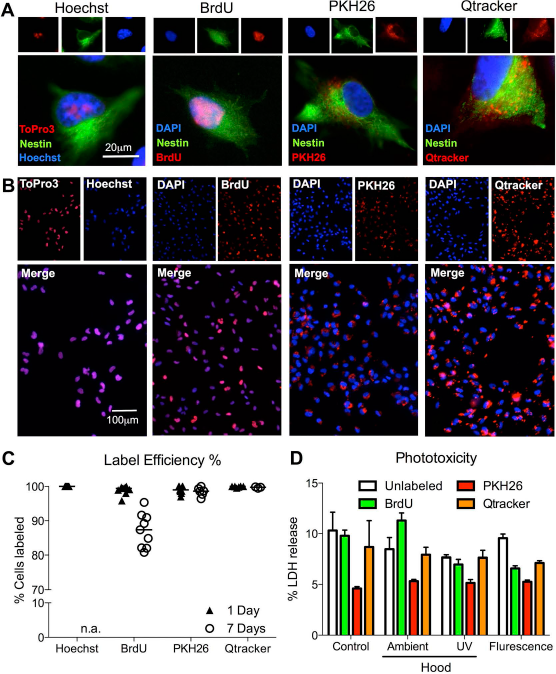
Efficiency of cell labeling. (A) Visualization of exogenous labels in a single cell. It is evident that Hoechst and 5-bromo-2′-deoxyuridine (BrdU) show an intranuclear localization, whereas PKH26 and Qtracker are distributed throughout the cytoplasm of the cell. (B) A population view of labeled cells further indicates differences in the appearance of the labels with nuclear markers being easier to ascribe to a cell than cytoplasmic markers. (C) The percentage of labeled cells at days 1 and 7 indicates that immediately after labeling, Hoechst, BrdU, PKH26, and Qtracker achieved an almost complete labeling. However, by 7 days, no Hoechstlabeled cells were present anymore (due to cell death), and the number of BrdU-labeled cells further reduced to a median of 87% (p < 0.001). PKH26 and Qtracker still afforded detection of almost all cells. (D) No phototoxicity was evident due to cell labeling across different light conditions compared to cells in the incubator (control).
BrdU contrasts with Hoechst, PKH26, and Qtracker in that it requires an antibody for detection. All other labels have inherent fluorescent properties that afford easy identification but also potentially renders them phototoxic. However, no phototoxicity was evident with BrdU, PKH26, or Qtracker in comparison to control conditions (LDH assay) (Fig. 2D). There was also no significant acute toxicity as indicated by viability of cells after labeling without light exposure being comparable to controls (Fig. 3A). Only an acute 4% decrease in live cells (p < 0.05) was evident after PKH26 labeling (Fig. 3B). At 24 h, an equivalent level of live cells was present in all conditions. These results indicate that none of the labels induce an acute toxicity. However, dead cells are removed from the culture during medium changes, and these assays may not be sufficient to demonstrate an absence of toxicity.

Toxicity due to cell labeling. (A) Assessment of cell viability using Live/Dead staining afforded a quantification of both fractions of cells. For PKH26 and Qtracker, the cell label occupied the same channel as ethidium homodimer-1 (EthD-1), the marker of dead cells. However, EthD-1 is nuclear and could therefore be distinguished from the labels based on localization. Additionally, live cells could still easily be distinguished by green calcein AM. (B) Quantification of viability after cell labeling with trypan blue measured potential toxicity effects during labeling. There was no effect of cellular toxicity due to Hoechst, 5-bromo-2′-deoxyuridine (BrdU), or Qtracker in comparison to unlabeled cells undergoing the same procedure. PKH26 was slightly (6.4%) reduced (p < 0.001). Only Hoechst exhibited a slight (2.4%), yet nonsignificant, reduction in live cells. Scale bar: 100 μm.
Effects on Cellular Functions
The most dramatic cellular effects were seen on cell proliferation and survival (Fig. 4A). Indeed, Hoechst labeling dramatically affected both proliferation (p < 0.001) and survival (p < 0.01) at day 1 (Fig. 4B). By day 7, only very few cells survived (p < 0.001) compared to unlabeled controls. In contrast, BrdU exerted no significant effect on survival at day 1 or 7 (Fig. 4C), although a small increase in proliferation was evident at day 1 (p < 0.05), which normalized again by day 7. On day 1, PKH26 decreased proliferation (p < 0.001), but overall more cells were evident (p < 0.05) (Fig. 4D). This opposing effect normalized by day 7. For Qtracker, both proliferation and total number of cells (p < 0.001) were elevated at day 1 (Fig. 4E). By 7 days, cell number remained elevated (p < 0.001), but proliferation was reduced (p < 0.001). These results indicate that Hoechst exerts a delayed toxic effect on cells and hence this label was not included in further assessments.

Cell survival and proliferation after cell labeling. (A) In contrast to viability, which measures what percentage of cells are alive/dead, survival measures how many cells in total are present at days 1 and 7, hence potentially discerning low, but persistent, levels of cell death that might not be evident on measures of cell viability. To this end, all 4′,6-diamidino-2-pheylindole-positive (DAPI+) cells were counted. In contrast, to determine how many cells are proliferating, the number of Ki-67+ cells was quantified. (B) The number of cells remaining after 24 h with Hoechst was reduced by 75%, and proliferation was down by 42%. By day 7 almost all cells had died. (C) 5-Bromo-2′-deoxyuridine (BrdU) led to an increase in proliferation at day 1 that was reflected in more cells being present than in control conditions. However, by day 7 this effect had normalized. (D) A decrease in proliferation was evident for PKH26, although more cells were present within the conditions compared to control, potentially indicating an early effect on proliferation that was reversed within 24 h. By day 7, again the effects normalized compared to controls. (E) Both proliferation and survival were increased for Qtracker after 24 h, with survival remaining elevated compared to control at day 7, although there was a slight decrease in proliferating cells. Scale bar: 100 μm.
A further key function of NSCs is their ability to differentiate into neurons, astrocytes, and oligodendrocytes (Fig. 5A). BrdU decreased the presence of GFAP+ cells at day 1 and day 7 (p < 0.05), but not Tuj (Fig. 5B). GalC was transiently increased at day 1 (p < 0.01), but the difference from controls was smaller (p < 0.05) by day 7. In contrast, PKH26-labeled cells were equivalent to controls at day 1. By day 7, there was a slight increase in GFAP+ cells (p < 0.01) and a decrease in Tuj and GalC cells (p < 0.05) (Fig. 5C). Qtracker exerted the most significant increase in GFAP expression (p < 0.001) (Fig. 5D), with no effects on Tuj and a slight decrease in GalC+ cells at 7 days (p < 00.05). These results indicate that all three exogenous labels exerted some effects on NSC differentiation, with PKH26 exerting the least effects, compared to Qtracker having the strongest effect on GFAP+ cells (20%-40% increase). However, both PKH26 and Qtracker appear to significantly alter the morphology of astrocytes (Fig. 5A).

Cell differentiation after cell labeling. (A) Day 7 of differentiation into the three cell lineages derived from neural stem cells (NSCs): neurons (Tuj), astrocytes [glial fibrillary acidic protein (GFAP)], and oligodendrocytes (GalC). Note that Tuj and GalC are typically at very low levels in day 1 cultures, so decreases are unlikely. (B) 5-Bromo-2′-deoxyuridine (BrdU) had no effect on neuronal differentiation, but reduced astrocytic cell fate, while shifting differentiation toward an oligodendrocyte fate. (C) PKH26 slightly, yet nonsignificantly, decreased neuronal and oligodendrocyte cell fate while enhancing astrocytic cell fate. (D) Qtracker did not affect neuronal fate, but significantly increased astrocytic fate, while reducing oligodendrocyte fate. Scale bar: 100 μm.
In Vitro Label Transfer to Unlabeled Cells
To determine the potential transfer from labeled NSCs to unlabeled ECs, a variety of assays were employed, such as coplating, plating of unlabeled cells first, plating of labeled cells first, as well as use of conditioned medium from labeled cells (Fig. 6A). Hence, transfer of the label from nestin+ NSCs to ECs was indicated by the presence of exogenous label in ECs. In all cases, transfer of PKH26 occurred with 100% of unlabeled ECs containing PKH26. To compare the potential transfer of different labels, labeled NSCs were coplated with unlabeled ECs. After 24 h of coculture, transfer of label was evident for Hoechst, PKH26, and Qtracker with all ECs containing label (Fig. 6B). However, only ~70% of unlabeled ECs were labeled with BrdU. These results therefore indicate that a significant label transfer occurs in vitro between labeled and unlabeled cells. This suggests that these labels have a high potential to generate false-positive identification after transplantation.
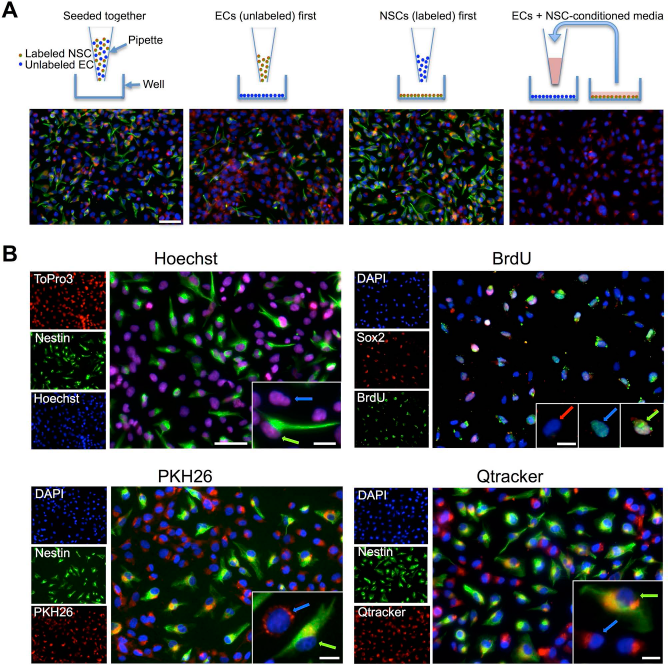
Leakage and reuptake in vitro. (A) A coculture of endothelial cells (ECs) and labeled human neural stem cells (hNSCs) affords an investigation of the transfer from labeled to unlabeled cells. However, in vitro, different setups for coculture can potentially lead to transfer of label. PKH26-labeled hNSCs stained with nestin for identification of NSCs. 4′,6-Diamidino-2-pheylindole (DAPI) served as counterstain for all cells. Regardless of the coculture method, PKH26 was found in both hNSCs and ECs with a transfer rate of 100%. Only PKH26 is shown here as a representative label, but each label's results were consistent across setup conditions. (B) Seeding of labeled hNSCs onto unlabeled ECs indicated that within 24 h of coculture there was significant transfer of label from hNSCs (green arrows) to ECs (blue arrows). Close to 100% of ECs contained Hoechst, PKH26, Qtracker, or 5-bromo-2′-deoxyuridine (BrdU), although a few ECs remained unlabeled with BrdU (red arrow). hNSCs remained identifiable based on the exogenous label. Nestin or sex-determining region Y-box 2 (Sox2; green) was used to label hNSCs. The procedure for BrdU interfered with nestin staining and hence Sox2 was used instead to identify hNSCs. Scale bars: 100 μm, 25 μm (insets).
In Vivo Identification of Implanted Cells
To ensure equivalent delivery of the number of cells, a quality control of the cell suspensions was performed to ensure that these were within a 10% error margin of the target concentration (Fig. 7A) and that their viability was maintained at room temperature (Fig. 7B). This resulted with all labels having a viability of ~90% at the start of the transplantation procedure and >85% at the end of the procedure (Fig. 7C). Hence, a consistent number of labeled cells was administered with a minimal number of dead cells being contained within the injectate.

Quality control. (A) Cell suspensions prepared for in vivo transplantation experiments fell within a 10% error margin (dotted lines) for all preparations, ensuring a consistent cell delivery. (B) To ensure a persistent viability, it was determined that maintaining cells at room temperature was favorable compared to keeping cells on ice. (C) Cell suspensions were assessed for cell viability using trypan blue, before and after 4 h of transplant surgery. Viability remained above 85% (dotted line) for all preparations used for in vivo experiments. (D) Three human-specific antibodies (all green), human nuclei antigen (HNA), human-specific heat shock protein 27 (HSP27), and a human nuclei-specific antibody (SC101), were tested for their ability to label all human neural stem cells (hNSCs) in vitro, and all achieved 100% [4′,6-diamidino-2-pheylindole (DAPI), blue]. (E) Each individual cell nucleus in a human tissue sample (i.e., positive control) from an adult hippocampus stains positive for HNA [HNA, green; neurons (Tuj), red; Hoechst, blue; scale bar: 100 μm]. (F) The normal rat brain (i.e., negative control) does not show any reactivity with these human-specific antibodies, as indicated here for HNA (HNA, green; Hoechst, blue; scale bar: 200 μm). (G) Image analysis, shown here with 5-bromo-2′-deoxyuridine (BrdU)-labeled cells, and symbols showing which cells would be counted as correctly identified (tick, labeled transplanted cell), false positive (+, labeled host cells), and false negative (-, unlabeled transplanted cells). An example is also shown of a cell with some green background that would be classified as HNA− (O).
To validate the reliability of exogenous labels for the detection of transplanted NSCs in the brain, it is essential to establish a “gold” standard for detecting human antigens. In vitro HNA, human-specific heat shock protein 27 (HSP27), and SC101 all reliably visualize 100% of human NSCs (Fig. 7D) and cells in adult human hippocampal tissue, indicating their sensitivity to detect human cells (Fig. 7E). In contrast, in normal rat brain, the antibody does not result in any staining of cells (Fig. 7F), indicating the antibody's specificity for human cells. The correct identification of transplanted cells using exogenous labels was validated against HNA staining to define correctly identified cells, false negatives, as well as false positives (Fig. 7G).
The identification of human NSCs in the brain based on exogenous markers can therefore be compared to their detection by HNA at 1 and 7 days posttransplantation (Fig. 8). The overall location and detection of “grafts” based on BrdU, PKH26, and Qtracker were accurate with no evidence of a significant amount of exogenous label outside of the transplant area. Although macroscopically exogenous labels might hence accurately report on the location and distribution of the transplanted cells, uptake of exogenous label in host cells could lead to a mistaken identification of individual implanted cells, potentially leading to an erroneous interpretation of cellular phenotypes. Consequently, for each label, it is essential to establish what proportion of implanted cells (based on HNA staining) is correctly identified, but also establish to what degree false negatives and positives could affect the interpretation of cell transplantation experiments (Fig. 9A). Approximately 60% of implanted cells were correctly identified using exogenous labels on days 1 and 7 (Fig. 9B). On day 7, PKH26 was significantly less reliable in identifying implanted cells compared to Qtracker (p < 0.05), but there was no significant decrease in the reliability of cell identification for PKH26 between days 1 and 7. Conversely, ~35% of implanted cells resulted in false negatives for all labels (Fig. 9C). Again PKH26, at 7 days postimplantation, resulted in a significantly higher amount of false negatives compared to Qtracker (p < 0.05). Surprisingly, in vivo very few (<2%) false positives were evident for all labels (Fig. 9D), contradicting results of the in vitro experiments. Individual transplanted cells can hence be reliably identified histologically based on exogenous labels, but there is a significant problem of underestimating the total number of implanted cells.

Histological characteristics of cellular grafts. Considerable differences in graft appearance based on cell labeling were evident. At day 1, human nuclei antigen-positive (HNA+) transplanted cells survived in all conditions and were confined to the deposit site. HNA afforded easy identification of cells in the unlabeled condition, and there was little evidence of autofluorescence in the red channel. 5-Bromo-2′-deoxyuridine (BrdU) in contrast was confined to the deposit site, but the immunohistochemical procedure used to detect BrdU led to some HNA-staining artifacts in the vicinity of the transplant site. PKH26 reliably defined the graft deposit, but the strong fluorescence in the red channel leached into the green channel and interfered with the detection of individual cells labeled with HNA. Qtracker did not induce a leach into the green channel, but the very punctate appearance of the Qdots complicates identification of individual cells in the absence of a cytoplasmic marker. After 7 days of survival, BrdU was well localized to areas with HNA staining with no significant dispersion of the label evident beyond the distribution of HNA-stained cells. PKH26 was also confined to areas of HNA staining, although it remained difficult to identify individual cells in these areas based on PKH26 staining. However, there was less bleed through into the green channel than at day 1. There was no distribution of PKH26 beyond the transplant site. A similar pattern to PKH26 was observed for Qtracker, although there was no significant bleed through into the green channel. Scale bars: 200 μm.

Accuracy of cell identification based on exogenous labels. (A) Quantification of reliable (correct) identification of cells based on their exogenous label in comparison to transplanted cells no longer identifiable based on the exogenous label (false negatives) and host cells containing an exogenous label (false positives). Sample images for each condition and label are presented. (B) On day 1, 5-bromo-2′-deoxyuridine (BrdU), PKH26, and Qtracker achieved approximately a 60% accurate identification of transplanted cells, whereas at 7 days, this increased to ~70% for BrdU and Qtracker and reduced to 50% for PKH26. (C) A significant portion (>30%) of implanted cells were no longer identifiable based on their exogenous marker at both 1 and 7 days postimplantation. However, this proportion was fairly stable, although it was significantly increased for PKH26 and potentially explains the decrease in correct identification of PKH26-labeled cells at day 7. (D) The proportion of cells that were misidentified as transplanted cells were surprisingly insignificant (<2%) for BrdU, PKH26, and Qtracker. HNA, human nuclei antigen.
Discussion
The interpretation of intracerebral cell transplantation experiments is dependent on the reliable identification of implanted cells. The use of exogenous labels potentially leads to an under- or overestimation of implanted cells, and labeling itself might exert ill effects on cellular functions. Here we evaluated and compared different exogenous labels for their uptake efficiency, cellular effects, as well as reliability for in situ histological identification (Table 4).
Summary of Strengths and Weaknesses for Consideration of Using Tested Exogenous Labels

++, Excellent; +, Good; -, Fair; - -, Poor.
The Reliability of Exogenous Labels for Cell Identification
The identification of transplanted cells is dependent on efficient labeling of cells in vitro. Hoechst, PKH26, and Qtracker efficiently labeled 100% of the cells and were easy to detect inside the cells in vitro. Only PKH26 and Qtracker progressed to in vivo studies, and although their fluorescence was easily detected for macroscopic localization of grafted cells, establishing colabeling of specific cells is more challenging because of the distributed punctate nature of the exogenous labels. Indeed, noncytoplasmic antibodies, such as GFAP, complicate a clear colocalization of these cell identification markers with phenotypic markers. BrdU labeling dropped to 87% of cells after 7 days despite 4 days of incubation, the longest duration of all exogenous labels. Indeed, the duration and immunohistochemical procedure to visualize BrdU complicate its use for cell transplantation studies. However, its nuclear localization made it much easier to definitively identify in vivo, where it was sometimes unclear with cytoplasmic labels to which nucleus they belonged.
PKH26 and Qtracker's punctate appearance is strong, but can also be confused with dust particles or other histological artifacts, such as lipofuscin 60 , if not associated with a cell or a sufficient amount of particles being visible. Individual punctate fluorescence dots in the interstitial space are hence ignored but could indicate exocytosis of the agent from labeled cells. There is a clear indication of label transfer being a potential issue, as the coculture here with unlabeled cells indicated a major transfer from labeled cells for both PKH26 and Qtracker. PKH26, being incorporated into the membrane, would necessarily be exocytosed during normal membrane turnover, so this effect cannot easily be attenuated. For Qtracker, the targeting mechanism is proprietary, so the method of label transfer cannot easily be inferred. BrdU, which is meant to stably insert into the DNA of labeled cells, showed a lower level of transfer, as observed by others38,39. The fusion of some labeled cells with unlabeled cells could account for a proportion of double-labeling and hybrid cells 61 but is unlikely to account for an almost 100% transfer rate. Although this assay clearly demonstrated the potential for label transfer62,63, the predictability of this coculture for in vivo studies is questionable, as there were very few (<2%) false positives found in vivo for BrdU, PKH26, or Qtracker. Other studies reported 5%-20% false positives31,32,38,39, but a key difference is that labeled cells here were incubated overnight prior to transplantation. This has been previously demonstrated to significantly reduce the leakage of an exogenous label 57 . Albeit the fusion of labeled cells with host cells can lead to a misinterpretation of transplanted NSCs 61 , results here indicate that this is unlikely. A more significant issue is potentially autofluorescent signals in brain tissue, including lipofuscin, which can complicate the unambiguous detection of transplanted cells in the absence of a gold standard18,60. Our results here suggest that the use of exogenous labels is potentially reliable to study the phenotypic differentiation of transplanted cells, but labels, such as PKH26 and Qtracker, are difficult to colocalize to yield an unequivocal interpretation of cell phenotypes.
A major issue that was apparent here is the high proportion of false negatives for all labels investigated. Approximately 30% of cells that were transplanted even at day 1 were not detectable based on the exogenous label. Considering that label efficiency was 100% at day 1, a smaller degree of false negatives could be expected. False negatives can potentially be due to dilution of label through cell division, but this is unlikely 24 h posttransplantation and hence cannot account for the high proportion of unlabeled cells here. Although photobleaching (i.e., reduction in fluorescent activity due to prolonged light exposure) could account for a decrease in fluorescent label detection64,65, Qtracker is not thought to be susceptible to photobleaching66,67. Processing of tissue for immunohistochemistry can potentially also affect exogenous labels. A further alternative explanation is that cell counts here in tissue sections based on HNA overestimate the number of transplanted cells. However, we previously demonstrated that HNA-based stereological cell counts are equivalent with an estimation of cell counts based on Alu-quantitative polymerase chain reaction (qPCR) 12 , and there is no cross-reactivity with rat cells. The high rate of false negatives reported here therefore remains poorly understood but indicates that for all exogenous labels this might be a more significant issue than previously considered.
The Influence of Exogenous Labels on Cell Functions
The reliability of exogenous cells to identify transplanted cells has been the main focus of methodological studies 1 , but potential effects on cellular functions have been mostly ignored, despite growing evidence to the contrary 33 . The most dramatic effect observable is cell death due to acute or delayed toxicity. Although all labels here exhibited good viability (>90%) after cell labeling, indicating a lack of acute toxicity, Hoechst-labeled cells did not survive for 7 days, revealing a delayed cytotoxicity. A thorough study by Pin et al. 68 showed that DNA-binding agents did not exert their toxic effects on the nucleus, but instead had direct toxic effects on neurites via the RNA present within them. This is also supported by our observation that ECs were unaffected by Hoechst labeling. PKH26 showed a minor reduction in viability straight after labeling, but this is likely due to the suspension labeling method retaining more dead cells compared to labeling attached cells. Although exposure to light of PKH26-labeled cells can induce phototoxicity 51 , there was no evidence here that light modulated toxicity for any of the labels. For Qtracker-labeled cells, the exact molecular composition of these nanoparticles can influence toxicity 69 , but there was no evidence of toxicity here. A previously reported selective neural toxicity of BrdU 36 was not evident here, possibly due to the use of lower concentrations of BrdU. Acute and delayed toxicities are hence essential reporters of cellular effects caused by exogenous labels that potentially invalidate their use to identify transplanted cells.
The incorporation of the exogenous label into different cellular compartments can further influence particular cellular functions, such as mitosis (i.e., cell proliferation). Cell division is a cardinal feature of NSCs. Hoechst and PKH26 both reduced proliferation acutely. Hoechst is known to cause DNA damage, as well as free radicals that lead to mutagenesis and free radical production, which all interfere with a normal cell cycle 70 72 . Although cell proliferation in PKH26 cells normalized, a significant decrease initially could still reduce the overall amount of cells present after transplantation. In contrast, BrdU and Qtracker increased proliferation acutely before normalizing. Although BrdU has been reported to affect the cell cycle at higher concentrations 35 , this was not evident here. These results indicate that all exogenous labels acutely affected proliferation, but there was no evidence of long-term effects.
A further key feature of NSCs is their ability to differentiate into neurons, astrocytes, and oligodendrocytes. Neuronal differentiation was not affected by BrdU, PKH26, or Qtracker labeling. BrdU has been reported to affect both neuronal and oligodendrocytic, but not astrocytic, differentiation in adult rat NSCs 35 . However, the BrdU protocol used here on fetal human NSCs resulted in a decrease in astrocytes and an increase in oligodendrocytes. It is possible that this difference is cell type dependent or is a BrdU concentration-dependent effect, which has been shown to selectively affect neural progenitors 36 . Qtracker also led to a major (20%) upregulation of GFAP with a minor (8%) decrease in GalC at 7 days. However, others have not reported any effect of quantum dots49,73. In contrast, PKH26 did not significantly affect cell differentiation, other than astrocytic morphology. The mechanism by which PKH26 and Qtracker affect cell phenotype is unknown but warrants further investigation in order to improve the design of future labels. It can be expected that BrdU induces conformational changes in the DNA structure 74 leading to more pronounced effects on cellular functions, compared to material localized within the cytoplasm or membrane. If these functions are deemed to be essential to therapeutic efficacy, more detailed studies are required prior to the use of these exogenous agents for cell transplantation studies.
Scope and Limitations of Cell-Labeling Studies
Our results here indicate that exogenous labels result in a similarly reliable in vivo identification of implanted human NSCs in the absence of in vitro toxicity. These results potentially apply to NSCs more generally, including those derived from the spinal cord, although we previously noted subtle differences in using the same label on different brain-derived NSCs 32 . Still, based on the results presented here, it remains unclear if these labels would achieve a comparable tolerance, efficiency, and identification potential if other cells are used. Optimization and validation are highly recommended for each label and cell type 4 . Importantly, we noted for instance that the Hoechst concentration used here was well tolerated by human ECs, although it exerted a delayed toxicity in NSCs. We previously demonstrated that human ECs are more tolerant to exogenous labels compared to NSCs, potentially indicating a more general difference between these two cell types 75 .
A further consideration is that the same cell type from different species could have different uptake or tolerance 76 . Nevertheless, the labels used here have been used widely in NSCs of different species for cell transplantation studies24,28,29. A direct comparison of NSCs from different species would hence be required to directly address this issue. Intracellular tolerance of the label is not only dependent on its direct toxicity but also determined by whether it is degraded into potential toxic components that could have delayed effects 77 . NSCs are known to be particularly fragile cells and provide a very sensitive system to probe toxicity33,76, but this also poses a challenge, as intracerebral implantation requires NSCs' long-term survival. In contrast, identification or tracking of other cell types, such as mesenchymal cells or lymphocytes26,78, is much shorter and hence labels, such as Hoechst, might still be suitable. A further evaluation of suitable labels for long-term identification of intracerebral transplantation hence requires an investigation of label retention, cell survival, and phenotypic differentiation at longer time points in conjunction with behavioral analysis33,60.
Conclusion
The interpretation of cell transplantation experiments is often dependent on the identification based on exogenous labels. Here we demonstrated that Hoechst 33342 is an inappropriate label for this purpose, whereas BrdU, PKH26, and Qtracker are reliable with <2% false-positive identification, although there is a major concern regarding false negatives. A further concern is the cellular effects these exogenous labels exert with both BrdU and Qtracker exhibiting significant effects on proliferation and differentiation. The choice of an appropriate label therefore depends on the main purpose of the cell transplantation experiment. The studies reported here indicate that exogenous labels can be reliable to identify transplanted cells without exerting major cellular effects but that validation is required and interpretations should be presented in the context of the label's limitations.
Footnotes
Acknowledgments
The authors acknowledge funding support by NINDS (R01NS082226) and the Commonwealth of Pennsylvania's Department of Health (4100061184). F.N. was supported by an MRC studentship. The authors thank Dr. Brenda Williams and Dr. Ellen Bible for useful discussions. The authors declare no conflicts of interest.