
Abstract
Quantity and quality assessment of human pancreatic islets are essential processes to define a safe and potent quality product used for clinical transplantation. The conventional method of manual assessment has been used in the field for longer than two decades. The high degree of variability in product quantity and lack of archival imaging records of the product for verification are two major disadvantages of using the manual method for quantity and quality assessment of human pancreatic islets. Investigators have developed promising new methods for technical improvement. In this study, we briefly review the published methods and highlight the advantages of digital imaging analysis (DIA) when compared to the manual method. The application of DIA reduces measurement variability and increases the precision of islet equivalent (IEQ) determination for batch analysis. It produces images that can be archived for retrospective analysis and validation, and the data can be transmitted electronically for off-site analysis. These features are important for quality pancreatic islet assessment and are consistent with FDA requirements of current good manufacturing practice for clinical islet transplantation.
Introduction
Islet transplantation is likely to become classified as an FDA-approved therapeutic treatment option for select individuals with type 1 diabetes in the US. As such, a regulatory framework will be established to ensure that the processes for isolating and purifying the islet product for clinical use will result in the ability to reliably produce and define a safe and potent quality product for transplantation. Quantification of islet mass is a crucial criterion for defining the quality and potency of the islet product. The methodology used to characterize the isolated islet product will continue to improve, and digital image analyses will be part of that evolutionary process.
Conventional Manual Method to Obtain Islet Equivalents
Accurate and reproducible qualification parameters of freshly isolated and cultured islets are essential steps for safe and effective protocols for clinical islet transplants. A major challenge pertains to the assessment of islet quantity because isolated islets are heterogeneous in size—typically ranging from 50 to 400+ μm. A major advance routinely adopted during the last two decades is the concept of quantifying the islet size in terms of islet equivalents (IEQ). This has been established and practiced as the standard islet quantification unit 1 . The volume of an islet with a diameter of 150 μm is assigned as one IEQ. Determination of IEQ is based on an assumption that islets are spherical—although islets actually have diverse shapes that are spherical, ellipsoidal, or irregular.
Isolated islets are physically measured in size as part of the manufacturing process. Islet product quantification is performed manually using a ruler or grid with standardized μm scales located in the eyepiece of a phase-contrast microscope used to visually measure the islet diameter. Since islets are not the true spheres, the diameter is regularly taken by mean diameter, which is the average of the sum of the longest (a) diameter and the diameter (b) perpendicular to the longest diameter of any islet [(a + b)/2]. That is a two-dimensional measurement. The diameter is then applied to the spherical volume formula (V = 4/3πr 3 ) to calculate the volume of the islet. The individual islet volume is then divided by the volume of an islet with 150-μm diameter to produce the individual IEQ.
To efficiently obtain the total IEQ, the islet diameter groups are set up as groups of 50–100 μm, 101–150 μm, 151–200 μm, 201–250 μm, 251–300 μm, 301–350 μm, and 351–400 μm. Islets with a size below 50 μm are considered mainly cell debris and therefore are not included in the calculation. Operators counting the islets enter the islet number into the corresponding diameter group. An excel template is applied to calculate the group IEQ (the number of islets in each group is multiplied by the volume conversion factor that results from the spherical volume of the median diameter of each group divided by the volume of a 150-μm-diameter sphere). The total group IEQ per sample is then multiplied by the sample dilution factor to reach the final total IEQ. The entire procedure takes 10 to 15 min and is operator dependent. The field accepts that the manual method of IEQ quantification per sample is an approximate estimate of the islet quantity.
Techniques to Quantitate Islets Using Digital Image Analyses
Many efforts have been made to assess the isolated islet product prior to infusion by employing new techniques. The use of confocal microscopy involves the assessment of three-dimensional images of intact isolated islets 2 . However, the technique is mostly of academic interest. It is a time and labor-intensive procedure to prepare tissue sections and to process images making it impractical for use in real-time islet isolation.
An automated method (Coulter Multisizer IIe) has been proposed for determining the number and volume of particles suspended in a conductive liquid by monitoring the electrical current between two electrodes immersed in the liquid on either side of a small aperture. The islet or particle passing through the aperture changes resistance between electrodes and produces an electrical pulse, the magnitude of which is proportional to the particle volume. The pulses are counted, and a size distribution curve of the sample is determined for data analysis. The instrumentation holds promise for three-dimensional islet quantification but it does not have the ability to differentiate islets from exocrine tissue 3 .
The other promising automated method was published in 2009 4 . This method uses LabView-based software (Laboratory Virtual Instrumentation Engineering Workbench: a graphical programming environment available from National Instruments, Austin, TX, USA) and a dedicated instrument (Islet Counter Model ICC-01). The study demonstrated the ability to correctly define the quantity of an islet surrogate, red microspheres, but it was not applied to samples of human islets.
The Kansas method 5 introduced an approach to estimate islet tissue volume by total cell numbers instead of IEQ. The study was carefully designed to measure the islet dimensions by confocal microscopy. Single-cell suspensions of individual islet preparations (3,663 islets from 17 donors) were quantified using computer-assisted cytometry. A spreadsheet was created that allowed the individual islet diameters to be entered to obtain the total cell number per islet in the sample. This methodology of calculating total cells per islet is probably a closer approximation to the true volume of islets compared to the islet volume calculated by the manual plane diameter and calculated spherical volume estimation. However, using fixed cell numbers to calculate the total cell volume for any islet preparation should be employed with caution since islets do not have a homogeneous quality. Islet quality is graded as A, B, C, D, and F (https://www.isletstudy.org/ master production batch record, page 38 of 71). Islets in the last three grades may contain a low number of single cells due to the poor pancreas quality or overdigestion during islet isolation. Nevertheless, the study does produce valuable basic cellular information of human islets.
Dia Application Using Black and White Digital Images
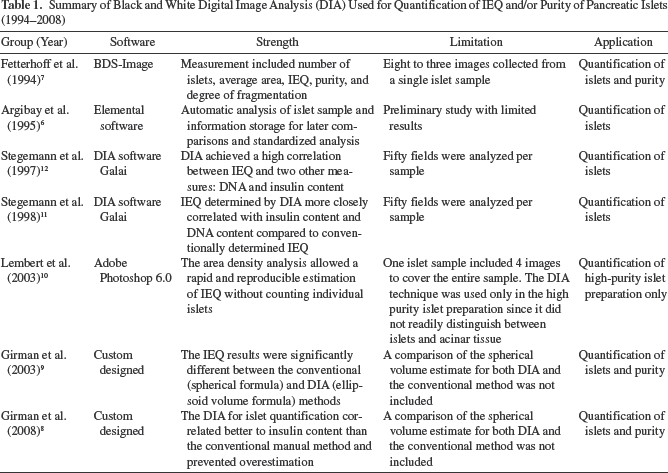
There are two major disadvantages of the conventional manual method: i) the high degree of variability in product assessment and ii) lack of archival imaging records of the product for verification. These shortcomings inspired investigators to improve the islet quantification methodologies. A summary of the initial investigations of DIA techniques is shown in Table 16–12. A black and white digital camera was used. Islet differentiation from exocrine and acinar tissue was based on the higher density of islets (Fig. 1A). A single sample was typically shot in multiple images. Thus, it was difficult to control the accuracy of the entire sample IEQ. The software used for image calibration was relatively cumbersome to handle compared to more contemporary techniques. Quantitative islet purity was hard to correctly acquire. However, the early studies showed promising results supporting future efforts to quantify pancreatic islet mass by using the current color DIA.

(A) Black and white islet images were used for image analysis. Reproduced with permission from Girman et al. 8 . (B) Color islet images were used for image analysis. Dithizone-stained islets appeared red. (C) The software Edit function made islets green and acinar tissue orange for digital analysis. Reproduced with permission from Nicholas et al. 15 . (D–F) Color islet images. Each image was composed so that all islets in the sample could be included in one image. (D) Islets stained as red. (E) The image had a calibrated grid mask on the same image. The grid was used for manual counting using the image. (F) Acinar tissue had yellow coloring by software for digital analysis. Reproduced with permission from Wang et al. 16 .
Summary of Black and White Digital Image Analysis (DIA) Used for Quantification of IEQ and/or Purity of Pancreatic Islets (1994–2008)
Dia Application Using Color Digital Images
The quality of stereomicroscopy, the digital camera, and software for DIA analysis has improved greatly since 200813–16 (Table 2). The image software has evolved and current choices include: MetaMorph and ImageJ described by Niclauss et al. 15 , Image Pro Plus version 5 described by Kissler et al. 14 , Leica Qwin Runner described by Friberg et al. 13 , and Image Pro Plus version 7 described by Wang et al. 16 . Although the multiple software choices for DIA are different, the techniques to obtain the islet image and perform the DIA have much in common. The color image is applied to isolated islet samples stained using dithizone (DTZ). The exocrine or acinar tissue appears white or yellow and is clearly differentiated from the red-stained islets. When an image is acquired for analyses, the background is adjusted to black to obtain an accurate outline of the acinar tissue. An appropriate magnification of the digital camera system allows for inclusion of the entire sample in a single image (Fig. 1B–F). All islet images must be spatially calibrated using the pixel conversion into μm derived from the transparent standard grid or ruler images14–16.
Summary of Color Digital Image Analysis (DIA) Used for Quantification of IEQ and/or Purity of Pancreatic Islets (2008–2015)

The software recognizes the original colors in the image. The operator chooses a suitable color provided by the software to cover the specific area representing islets or non-islet tissue. The color-covered areas are then calculated to produce parameters of area, radius (max), radius (min), and perimeter. Individual study teams create custom-designed Excel templates to convert the digital information to the islet quantification report. The sample islet purity is simply calculated using the formula of quantitated islet area divided by the sum of quantitated islet area plus exocrine area. The edit functions in the software offer options to correct and separate components of adhered islets or delete significantly fragmented islets.
Compared to the original method for obtaining islet purity by visual estimation only, the DIA also quantifies sample purity. The entire procedure takes 5 to 15 min. The advantages of DIA are summarized as follows: it removes operator bias and increases the precision of IEQ determination; it provides batch analysis without user interaction; it has the ability to customize the analysis for specialized requirements; it archives the image for retrospective analysis or transmitted electronically for off-site analysis; finally, it provides a data bank for staff training. These characteristics are consistent with quality FDA requirements of current Good Manufacturing Practice for clinical islet transplantation 16 .
Quantification of islets using DIA techniques has more advantages than the conventional manual method; however it also has its limitations. The DIA does not reach a perfect automated stage. It costs more than the manual method because it requires a specific microscope, a digital camera, and software. The technician needs training to reach a skill level to reliably use the equipment to acquire images of an ideal islet sample and to perform the correct DIA.
Islet Quantification Variability in Conventional Versus Dia Methodologies
There are three types of variability of islet quantification in both conventional and DIA methodologies. They may be categorized as measurement, sampling, and biological variability. Furthermore, they may exist alone or in combination.
Results are either accurate, or they over- or underestimate the true value. The causes of measurement variability could be due to inaccurate instrument settings or due to inaccurate counting methodology. In the conventional manual method, the ruler or grid in the eyepiece lens must be a standard 50 μm/unit 16 . In DIA, the spatial calibration must be done by using a standard grid (e.g., a hemocytometer) and applied before the DIA begins 16 . The variability of the actual counts, in both the manual and DIA methods, can arise due to inadequate training or counting bias. The manual IEQ counting method 1 itself has the potential weakness to overestimate the IEQ as analyzed by Buchwald et al. 4 .
Sampling variation can be minimized by a careful technique. The standard method requires duplicate samples of 100 μl from a 250-ml prepurification islet suspension, and 100 μl from a 50- to 150-ml postpurification or postculture islet suspension. The sample should be taken immediately after the islet suspension is well mixed and at the middle level of the container. A team of two well-trained technicians is required to perform this process. One technician takes care to mix the islet suspension thoroughly and gently, then to open the sample bottle for the other technician. The other technician immediately and accurately aspirates the islet sample, making sure to insert the pipet tip to the correct level, obtain a full 100 μl of sample, and transfer the entire sample into a counting dish. Even if all of the above steps are well controlled, Wang et al. 16 still found that the inter-sample variations ranged from 20% to 31%, in total 60 samples from the single islet preparation. In the same study, the intertechnician variation had a range from 5% to 14%. This suggests that biological variation (islet size range related) and measurement variation coexist in islet quantification with both manual and DIA methods. However, DIA has a lower measurement variation compared to the manual method. Friberg et al. 13 reported that the interindividual coefficient of variation (CV%) was 30% in the manual method compared to 17% by the DIA methodology.
Dia Application in Morphological Quality Assessment
Pancreatic tissue digestion is another important step during islet isolation. The two major issues involved in the control of whole pancreatic tissue digestion include donor pancreas quality and technical control. The various outcomes of the initial digestion can be summarized according to four types of endpoints reflected by the islet morphology: type 1—optimal digestion (Fig. 2A); type 2—overdigestion (Fig. 2B); type 3—underdigestion (Fig. 2C), and type 4—juvenile digestion (Fig. 2D). Optimal digestion normally occurs with high quality of donor pancreata, appropriate enzyme concentration, and the correct timing to end the digestion. Optimal digestion produces the highest islet yield, and its morphology shows high DTZ staining intensity, well-rounded borders, and a low number of small fragmented islets. Overdigestion results when ending the digestion occurs too late, an overdose of enzyme concentration was used, or when a donor pancreas of poor quality is used. The overdigested islets show overall fragmentation, resulting in DTZ staining that is not uniform and irregular borders. The total amount of IEQ may decrease significantly after culture. Underdigestion may relate to ending digestion prematurely, low dosage of enzyme concentration, or a poor-quality donor pancreas. The underdigested preparations show more trapped islets and normally have low islet yield and low islet purity. This is because the trapped islets have similar density to acinar tissue. The density gradient is unable to separate the trapped islets from the acinar tissue. Digestion of juvenile pancreata usually results in underdigestion, as juvenile islets are often surrounded by highly condensed acinar tissue that makes digestion very difficult (Fig. 2D).

(A) Type 1—optimal digestion (islet image by the University of Illinois at Chicago). (B) Type 2—overdigestion. (C) Type 3—under digestion. (D) Type 4—juvenile digestion.
Islet images taken at the postculture stage gave the operator a chance to review the culture quality. This may provide valuable information for improving culture conditions. Operators consistently reviewed the islet images combined with information from the donor and master production batch records, helping them to build up their experience and improve their techniques in islet processing.
Summary
DIA is evolving as an important tool for islet quantification of islet mass and purity. DIA application requires the use of an appropriate stereomicroscope, a high-quality digital camera, and proprietary software. The DIA technique also requires training and experience, and appropriate manpower. However, these limitations are offset by several advantages compared to manual islet assessment. DIA has the potential to minimize or remove operator bias and increase the precision of IEQ determination; it provides for batch analysis without user interaction; it produces images that can be archived for retrospective analysis and validation of results or transmitted electronically for off-site analysis; finally, it provides a data bank for staff training. These features are important for quality pancreatic islet assessment and are consistent with FDA requirements of current Good Manufacturing Practices for clinical islet transplantation.
Footnotes
Acknowledgment
The authors would like to thank the journals, Cell Transplantation, The Review of Diabetic Studies, and Transplantation, for granting permission for the use of published figures. We also greatly appreciate Dr. Piotr Witkowski, Director of the Islet Transplantation Program in the University of Chicago, for kindly providing the islet images (Figure 2) taken by his team. The authors declare no conflicts of interest.