
Abstract
Pancreatic islet mass, represented by islet equivalent (IEQ), is the most important parameter in decision making for clinical islet transplantation. To obtain IEQ, the sample of islets is routinely counted under a microscope and discarded thereafter. Islet purity, another parameter in islet processing, is routinely assessed by estimation only. In this study, we validated our digital image analysis (DIA) system by using the software of Image Pro Plus and a custom-designed Excel template to assess islet mass and purity to better comply with current good manufacturing practice (cGMP) standards. Human islet samples (60 collected from a single isolation and 24 collected from 12 isolations) were captured as calibrated digital images for the permanent record. Seven trained technicians participated in determination of IEQ and purity by the manual counting method (manual image counting, Manual I) and DIA. IEQ count showed statistically significant correlations between the Manual I and DIA in all sample comparisons (r > 0.819 and p < 0.0001). A statistically significant difference in IEQ between Manual I and DIA was not found in all sample groups (p > 0.05). In terms of purity determination, statistically significant differences between assessment and DIA measurement were found in high-purity 100-μl samples (p < 0.005) and low-purity 100-μl samples (p < 0.001) of the single isolation. In addition, islet particle number (IPN) and the IEQ/IPN ratio did not differ statistically between Manual I and DIA. In conclusion, the DIA used in this study is a reliable technique to determine IEQ and purity. Islet sample preserved as a digital image and results produced by DIA can be permanently stored for verification, technical training, and information exchange among islet centers. Therefore, DIA complies better with cGMP requirements than the manual counting method. We propose DIA as a quality control tool to supplement the established standard manual method for islet counting and purity estimation.
Introduction
Human pancreatic islet transplantation is a clinical cell therapy for patients who undergo total pancreatectomy due to benign pancreatic disease or trauma (autologous islet transplantation) or for select patients with type 1 diabetes (allogeneic islet transplantation) (9, 11). As islet product is regarded as a “drug”; it has to be processed in the clean room of a current good manufacturing practice (cGMP) facility and meet all release criteria required by the FDA in the US before being released for transplantation to the patient. Among all release criteria, islet mass is the most crucial parameter that correlates with clinical outcome after transplantation. Since islet size falls in a broad range (50 to 400 μm), islet equivalents (IEQs) were established to measure islet mass based on islet size and number in 1990 (8). The procedures to determine IEQ are described as follows. A sample of islet suspension is stained with dithizone (DTZ), which chelates the zinc of the insulin granules in β-cells of the pancreatic islets, resulting in a red color. The acinar cells remain unstained and white. The diameter of individual islets is measured using a calibrated grid with 50-μm increments in the eyepiece of a phase-contrast microscope. The concept of 1 IEQ is derived from an assumption that islets are spherical, and the volume of IEQ is equal to the volume of a 150-μm-diameter islet. An IEQ calculation table was created by displaying the islet size groups (diameter), the number of islets per group, and conversion factors (mean group volume/volume of 1 IEQ) used to calculate IEQ per size group (8). The total IEQs is calculated by multiplying the sum of IEQs in all size groups in the entire sample and dilution factor. Islet purity is a parameter used during islet processing. At the culture stage, islets are cultured in defined purity ranges, which are high purity (>70%), middle purity (40% to 69%), and low purity (30% to 39%). When the final islet product is transferred into the infusion bag for clinical transplantation, islet purity is one of the parameters used to determine the number of infusion bags needed. Islet purity is not calculated or measured but only roughly estimated by technicians (8).
The above method used to assess IEQ has been widely accepted and applied in research, in clinical islet isolation, and in transplantation for the last two decades. However, this method has obvious shortcomings, including technical bias, limited time for verification, and infeasibility of long-term sample preservation. In 2010, we reported preliminary results of islet mass quantification using our digital image analysis (DIA) protocol (12). Next, we confirmed the advantages of our DIA protocol as a part of an islet cell resource study (5). Recently, Friberg et al. (2) reported a different DIA system that allows for reduced variability of islet count compared to manual counting methods. Although many other DIA systems have been tested previously, shortcomings affecting accuracy of the results existed in these studies (1–4, 6, 7, 10) (Hui Jian Zhang, University of Minnesota, personal communication). Among the issues was that although islet samples stained with DTZ were manually counted immediately, the images might have been taken hours later or even on the following day. Some of the islets might have dissociated in the extended incubation in the DTZ solution. Another concern was that the picture taken was not complete and represented only part of the entire islet sample. A clinically applicable and reproducible DIA protocol has never been well described and validated in well-controlled human islet samples.
The aim of this study is to rigorously validate our DIA protocol in determination of IEQ and purity of human islet preparations. If successful, it would allow introduction of the DIA technique as a clinically applicable tool to supplement the current practice with a verifiable cGMP-compliant record.
Materials and Methods
Software, Microscope, and Camera
Image-pro plus version 7.0 was purchased from MediaCybernetics (Bethesda, MD, USA). Zoom stereomicroscope, SMZ1000, and 1.5-x ED Plan WD 45 high-magnification lens are made by Nikon (Tokyo, Japan). Microscope camera XC50 was procured from Olympus America, Inc., (Central Valley, PA, USA). Additional lens (0.63×) connected to the top of the adaptor for the camera is made by Diagnostic Instruments (Sterling Heights, MI, USA).
Reagents
DTZ and dimethyl sulfoxide (DMSO) were from Sigma (St. Louis, MO, USA). Dulbecco's phosphate-buffered saline (DPBS) and CMRL1066, supplemented, were from Mediatech (Manassas, VA, USA). Human albumin 25% USP was manufactured by CSL Behring (King of Prussia, PA, USA). Heparin sodium injection USP was manufactured by Hospira (Lake Forest, IL, USA). Insulin-like growth factor-1 (IGF-1) was procured from Cell Sciences (Canton, MA, USA).
Disposable Supplies
Most of the disposable items were ordered from Fisher Scientific (Pittsburgh, PA, USA). They were 250-ml conical tubes, 50-ml conical tubes, culture dishes (60 × 15 mm), large-orifice pipette tips, pipetter-specific tips, 10-ml syringes, syringe filters (0.22 μm), Kimax flasks, and one-hole rubber stoppers and glass Pasteur pipettes. Kimax flasks and rubber stoppers were used for islet wash before taking picture. T-75 culture flasks were ordered from Sarstedt (Nümbrecht, Germany).
DIA Protocol
Our DIA protocol has been prepared to meet the quality control criteria for reproducible data acquisition and analysis. Therefore, any deviations of the protocol will affect the accuracy of the data analysis. The methods below describe the details of our DIA protocol, including islet sample collection, image capture of hemocytometer for image spatial calibration, image capture of islet sample, DIA, application of HK template for the calculation of sample IEQ, purity, and islet purity number (IPN), and manual image analysis.
Islet Sample Collection
The islet isolation protocol, as part of the Clinical Pancreatic Islet Transplantation Study, was approved by the Institutional Review Board of University of Chicago and the FDA. Human pancreatic islet isolation was performed in the clean room of a cGMP facility. Islet processing was designed based on the Clinical Islet Transplantation (CIT) protocol (http://www.isletstudy.org/). Islet samples were collected from 13 isolations. In one clinical transplant-grade pancreas, immediately after purification islets were washed and suspended in CIT culture media (CMRL 1066 supplemented, 0.5% human serum albumin, 10 IU/ml heparin, and 0.1 μg/ml IGF-1) and transferred to T-75 culture flasks. High- and low-purity islet cultures were processed separately. The total volume of islet suspension was 100 ml in the high-purity and 75 ml in the low-purity flasks. Twenty 150-μl and 20 100-μl samples were collected from the high-purity preparation and named group H150 and group H100, respectively. Another 20 samples of 100 μl were collected from the low-purity preparation and named group L100. Under a biological safety cabinet, one technician gently mixed the islets with culture media then immediately opened the lid; the second technician inserted an autoclaved wide-mouth pipette tip with extension (large-orifice pipette tip and pipetter-specific tip) to the middle level of the islet suspension and aspirated the predetermined amount of islet sample to the center of a culture dish. Islet samples were stored in a culture incubator with 5% CO2 at 37°C. An additional 12 pairs of islet high-purity samples (100 μl per sample, n = 24) collected at postpurification stage from 12 cases of islet isolation were also analyzed to investigate the reproducibility of the methods in this study.
Image Capture of Hemocytometer
The grid in a hemocytometer is considered as the gold standard for microscopic measurement. Serial pictures with different zoom magnifications must be precaptured from an individual microscope for calibration purposes. The hemacytometer pictures were saved with microscope ID and zoom magnifications.
Imaging of the Islet Sample
DTZ solution containing 50 mg DTZ, 10 ml DMSO, and 20 ml DPBS were placed in a 50-ml conical tube covered with aluminum foil to protect it from light. The DTZ solution was filtered before being used. Islet samples were stained with DTZ and photographed immediately after collection. For the single isolation with multiple samples, four culture dishes were removed from the CO2 incubator at one time for DTZ staining and image capturing. Islets in culture dishes were stained with one to two drops of DTZ solution for at least 2 min before 3 to 5 ml culture media was added to the dish. After swirling islets to the center of the dish, any air bubbles were carefully aspirated off the surface of the media by a Pasteur pipette connected to a vacuum flask. It is important for an ideal islet picture to include all islets per sample in one picture, avoid overlapping islets, and show good resolution with a black background. In the ideal islet picture, islets are shown red and acinar white or slightly yellow (Fig. 1). It is important that the islet pictures are saved with the sample ID, microscope ID, and zoom magnification. In this study, all islet images were taken with 30× magnification.
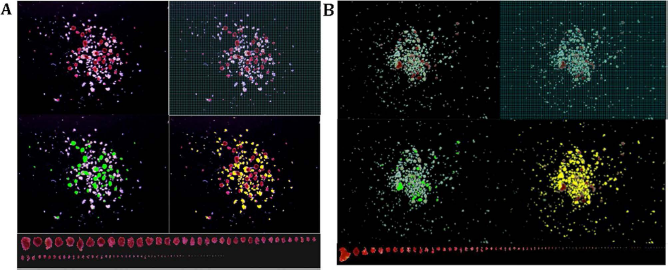
Islet samples captured in a calibrated image. (A) An islet sample with middle purity was captured in a calibrated image. The islet information in this sample includes: 78 islet equivalents (IEQs) by Manual I and 95 IEQs by DIA; purity 54% by Manual I and 53% by digital image analysis (DIA). (B) An islet sample with low purity was captured in a calibrated image. The islet information in this sample includes IEQ 24 by Manual I and 18 by DIA; purity 20% by Manual I and 12% by DIA. Note: Each picture was taken with spacious background so that all islets in the sample could be included in one image (30× magnification). Top left: Islets stained with DTZ (red) and acinar tissue (unstained). Top right: A grid mask was placed on the image for Manual I counting (a 50-μm grid was too small to be seen in this printed image, a 100-μm grid is displayed instead, as an example). Mid-left: Islets outlined in green in DIA. The pixels in the green marked area were converted to μm2 and used for islet area and volume calculation. Mid-right: Acinar tissue outlined in yellow in DIA. The pixels in the yellow marked area were converted to μm2 and used for total acinar area calculation. Bottom: All of the islets in the sample were lined up according to their sizes. Islet sizes smaller than 50 μm were not included in IEQ calculation according to the principle of IEQ calculation.
Digital Image Analysis (DIA)
Software Image-pro Plus 7.0 was used for this study. Following the manufacturer's instructions, the DIA procedures are 1) to do a spatial calibration of images by using the hemocytometer grid to determine the pixel per μm in defined distance; 2) to set up parameters required by image analysis [area, radius (max), radius (min), and perimeter]; 3) to select and apply colors for islet and acinar tissue, respectively (Fig. 1); 4) to click “count” to obtain all data from the colored objects; and 5) to sort islets (Fig. 1) to identify the islets with improper boundary for correction (in Edit function). The data are then copied and pasted into HK templates. In this study, the spatial calibration used was 0.294 pixels/μm.
HK Template
HK islet template, a custom-designed Excel template (by Dr. Hermann J. Kissler), has been routinely applied in an islet-processing cGMP setting since 2007.
The template is an essential tool in our DIA protocol. It contains the following sections. Section I: General information includes isolation ID, donor ID, date, name of camera, microscope ID, zoom magnification, pixel/μm, calibration date, sample ID, islet isolation stages, purity level, total volume, sample volume, and operator initials. Section II: Analyzed data are copied and pasted from Image-pro plus. Section III reports: Two islet information reports (DIA and DIA-E) are produced in this section. DIA uses a spherical volume formula to calculate the results. In DIA, the IEQ is calculated as the result of the volume of an islet in the image divided by the volume of a 150-μm spherical islet. DIA-E applies an ellipsoid volume formula, and the IEQ is calculated based on volume of an islet in the image divided by the volume of a 150-μm spherical islet. DIA reports contain islet size groups, sample IEQ, total IEQ, sample IPN, total IPN, and IEQ/IPN ratio and purity.
Manual Image Analysis
In the routine manual count method, a technician collects islet samples in a culture dish and counts islets under the microscope with a reticule. We called it the manual dish method (Manual D), which was not used in this study. Instead, islets were counted directly on the digital image with a calibrated grid. We called this method the manual image method (Manual I). For this we employed a calibrated 50-μm grid mask over the islet image for manual analysis (Fig. 1). After counting, the islets are marked by using the annotation function. Thus, the missed islets are easily found, and repeated counting is avoided. Islets in different size groups were counted and entered into the IEQ calculation table (8).
Operators
Seven well-trained technicians participated in IEQ and purity analysis using Manual I and DIA.
Statistical Analysis
The GraphPad software, Prism 6 (La Jolla, CA, USA), was used for statistical analysis. The methods of Prism 6 applied in this study were linear regression, two-way ANOVA with Bonferroni correction, and paired t-test. Statistical significance was determined by p < 0.05.
Results
IEQ Results of 60 Samples From Single Islet Isolation
Five technicians using Manual I and DIA analyzed 20 islet samples from each of the H150, H100, and L100 groups separately. In other words, every technician analyzed a total of 60 samples by Manual I and 60 samples by DIA. Linear regression tests showed statistically significant correlations in the IEQ results between DIA and Manual I (Table 1). Statistically significant differences in IEQ count were not found between Manual I and DIA in all groups (p > 0.05) (Table 2). Significant differences were found when IEQs of DIA-E were compared to those of Manual I and DIA (all p < 0.001) (Table 2) and linear regression was significantly correlated (Table 1) among comparisons. Comparative analyses in this study also include intersample variation (ISV), intertechnician variation (Inter-TV), and intratechnician variation (Intra-TV) (Table 2 and Fig. 2).

Intratechnician variation (Intra-TV) was assessed by reanalysis of IEQs on the same islet image three times by the same technician at least 3 days apart. Individual CV for each sample IEQ count is presented for each technician. The mean CVs for Manual I and DIA were <10%.
Summary of Linear Regression Reports on IEQs Counted From Islet Sample Groups

IEQ, islet equivalent; DIA, digital image analysis (spherical volume formula); DIA-E, digital image analysis (ellipsoid volume formula).
Comparison of IEQs Between Manual Count and DIA

Note: Every islet sample group (H150, H100, and L100) contains 20 islet image samples, respectively. Five technicians participated in IEQ counting. Results came from 100 counted data per islet sample group. ISV and Inter-TV were not significantly different among Manual I, DIA, and DIA-E.
ISV is the variation in IEQ of samples 1 to 20 from the same group (group H150 or H100 or L100) assessed by one technician. ISV values in Table 2 are means from the individual mean, SD, and coefficient variation (CV) calculated from the results of five technicians by Manual I or DIA.
Inter-TV refers to the variation of IEQ count in a single sample by five technicians. The values of Inter-TV in Table 2 show the means of the individual mean, SD, and CV calculated from the results the single sample counted by five technicians in the same sample group (group H150 or H100 or L100).
Intra-TV was assessed on the same islet image three times by the same technician at least 3 days apart by Manual I and DIA. Three technicians participated in this work. Three islet images from each sample group (group H150 or H100 or L100) were used separately for Intra-TV analysis. IEQ counts were consistent for each technician using Manual I and DIA with the mean CVs < 10% (range 1% to 23%) (Fig. 2).
IEQ Results of 12 Pairs of Samples From 12 Islet Isolations
Three technicians using Manual I and DIA analyzed 12 pairs of islet samples. A statistically significant difference was not found in the IEQ between Manual I and DIA (p = 0.0516) (Fig. 3a). The wide range of CVs reflected the mean CV per pair of the sample (Fig. 3b). Linear regression showed that the results analyzed by Manual I, DIA, and DIA-E were statistically correlated (Table 1). Statistically significant differences were found in the IEQs between Manual I and DIA-E (p < 0.0001) and DIA and DIA-E (p < 0.0001).
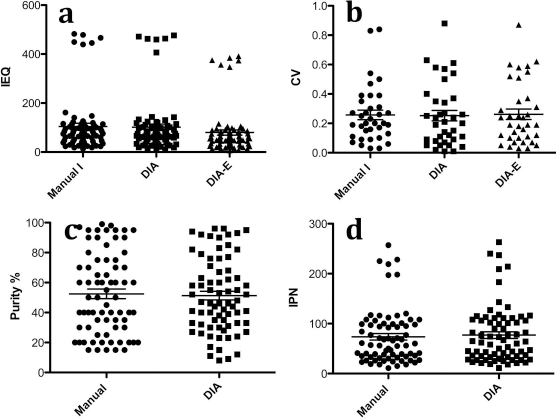
Twenty-four islet samples collected from 12 isolations were analyzed by Manual I and DIA. (a) IEQ was obtained from 72 individual counts (three technicians counted 24 samples individually, p = 0.0516). (b) CV was calculated from paired islet sample per case (n = 36, three technicians counted 12 pairs individually, p = 0.82). (c) Purity was obtained from 72 individual counts (p = 0.47). (d) Islet particle number (IPN) was obtained from 72 individual counts (p = 0.07).
In summary, statistically significant correlations were observed in the IEQ results measured by Manual I and DIA methods. No significant difference in IEQ quantitation was observed between the Manual I and DIA compared in various sample groups. Based on a different calculation formula, the IEQs counted by DIA-E differed significantly from Manual I and DIA in all sample groups.
Analysis of Purity Measurement
Technicians assessed islet purity in Manual I based on their experience. On the other hand, the purity calculated by DIA is the result of the measured total islet areas divided by the measured total areas of acinar tissue and islets. In the purity comparison of Manual I to DIA (60 samples of the single islet isolation) (Table 3), statistically significant differences were found in the group H100 (p < 0.005) and the group L100 (p < 0.001), but not in the group H150. Figure 3c showed the purity results of 12 pairs of samples from 12 islet isolations analyzed by three technicians. No statistically significant difference was found in the 12 pairs of samples.
Comparison of Purity, Islet Particle Number (IPN), and Ratio of IEQ/IPN Between Manual I and DIA
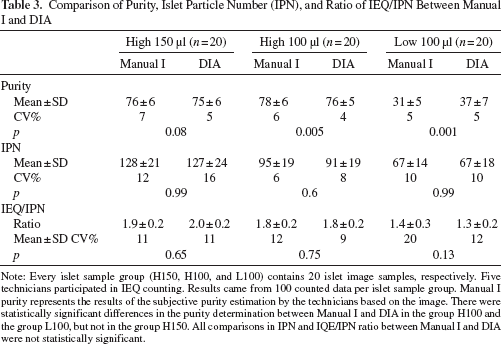
Note: Every islet sample group (H150, H100, and L100) contains 20 islet image samples, respectively. Five technicians participated in IEQ counting. Results came from 100 counted data per islet sample group. Manual I purity represents the results of the subjective purity estimation by the technicians based on the image. There were statistically significant differences in the purity determination between Manual I and DIA in the group H100 and the group L100, but not in the group H150. All comparisons in IPN and IQE/IPN ratio between Manual I and DIA were not statistically significant.
Analysis of Islet Particle Number (IPN)
We found no statistically significant difference in IPN between Manual I and DIA in this study (Table 3 and Fig. 3d). Islet size distribution showed similar patterns in both Manual I and DIA (Fig. 4). Additionally, IPN assessed by DIA-E showed that mean ± SD and CV were 121 ± 22 and 18% in the group H150, 86 ± 17 and 20% in the group H100, and 60 ± 15 and 25% in the group L100. Comparing IPN by DIA-E to IPN by Manual I and DIA in the samples of the single islet isolation, statistically significant differences between Manual I and DIA-E were only found in the group H100 (p = 0.005).

Islet distribution in size group was shown by Manual I and DIA. There was no statistically significant difference found in IPN between Manual I and DIA.
Analysis IEQ/IPN Ratio
We found no statistically significant difference of the IEQ/IPN ratio between Manual I and DIA in the same groups (Table 3). However, statistically significant differences in IEQ/IPN ratio were found between high- and low-purity samples (group H150 vs. group L100 and group H100 vs. group L100, all p < 0.001), regardless if Manual I or DIA was used (Fig. 5).

IEQ/IPN ratio assessed in high- and low-purity samples. (A) IEQ/IPN ratio assessed by Manual I was statistically higher in high-purity samples than in low-purity samples. (B) IEQ/IPN ratio assessed by DIA was statistically higher in high-purity samples than in low-purity samples.
Discussion
IEQ, representing pancreatic islet mass, is the most important of all parameters involved in decision making for clinical islet isolation and transplantation. However, the method to determine IEQ has remained the same for the last 20 years. The drawback of this approach is that a small amount of islet sample (around 100 to 200 μl collected from 100 to 200 ml of islet product) is counted in a culture dish and discarded thereafter. It is difficult to verify the results of manual islet counting mainly due to the difficulty of sample storage after DTZ staining. Moreover, high IEQ counting variations have been noticed by many islet processing laboratories (5). Therefore a better technique is needed to overcome the drawbacks associated with the IEQ manual counting method and to better comply with the cGMP standards in clinical islet transplantation.
In the study, we used manual islet counting on islet image (Manual I) instead of manual islet counting in a dish (Manual D). Applying Manual D would require five technicians to analyze 60 islet samples at the same time, which is impractical. Islets stained with DTZ may disassociate after staying in a suspension in a culture dish for a prolonged time. In contrast, Manual I islets are fixed as digital images; therefore, extensive analysis becomes possible. The Manual I method has many advantages over the Manual D method (Table 4). In Manual D, islets may be easily missed or double counted due to dish handling errors, leading to the relocation of the islets, or due to technician distraction during the counting. The Manual I overcomes this problem. However, both methods follow the same original instruction to group islets by measuring islet size using a 50-μm grid and the same calculation formula for IEQ count. DIA and DIA-E use calibrated pixel/μm values to measure the islet area. Then, the spherical volume formula was applied in the DIA method to calculate IEQ, whereas an ellipsoid volume formula was used in DIA-E. In comparison of Manual I and DIA, the DIA technique (sphere) has an equivalent ability to obtain results close to Manual I IEQ results. In DIA, the islet numbers per size group was not used to calculate IEQ. Instead, the sample IEQ was calculated based on the sum of individual IEQ per sample. The individual IEQ was obtained from an islet volume divided by the volume of a 150-μm size islet, where the islet volume was obtained from the measured islet area using the HK template. The standard IEQ formula used in Manual I is based on a defined standardized islet volume for each islet size group, whereas in DIA, it is based on the actual volume of each islet in the sample; therefore, technically, IEQ count should be more accurate in DIA than in Manual I. However, the difference in IEQ results between Manual I and DIA was not statistically significant in our study. Since we did not perform Manual D counting due to the technical limitations and time constraints, it was not possible in this study to compare the efficiencies of Manual I and Manual D. However, theoretically, both results of Manual I and Manual D should be comparable if their measurement grids were validated by image or microscopic calibrations.
Comparisons of Manual D and Manual I

The significantly lower IEQ results obtained by DIA-E compared to the results of Manual I and DIA was due to the use of a different calculation formula based on ellipsoid shape rather than the measurement error. Although the islet shape on the image resembles an ellipsoid more than a sphere (see random pickup samples in Fig. 1), there is no strong evidence of superiority of either the formula based on ellipsoid or spherical shape in prediction of the islet function after the transplant. Historically, we have correlated islet function with IEQ based on spherical shape in manual count, so there is no need to change it. Therefore, we propose digital image analysis purely as a quality control tool to supplement rather than replace the established standard manual IEQ count method. The algorithm for calculating the IEQ needs to remain the same to ensure comparability of the results. Of note, the 50-μm grid mask has been used historically as a standard size grid in manual IEQ counting. When we tested 100-μm grid masks, IEQ results were significantly higher than the results using 50-μm grid masks and DIA (data not shown). So using larger grid masks may result in overestimation of the islet count.
IEQ measurement assessed in the same islet sample by five technicians allowed us to calculate Inter-TV that represents the measurement variations. The Inter-TV stayed below 11% for Manual I as well as DIA in our study (Table 2). Friberg et al. reported the CVs in manual and DIA were 31% versus 17%, respectively (2). It is very common to see CVs of Inter-TV around 30% or even higher by the Manual D method in most of the islet processing centers using Manual D (personal communications). In a multicenter study in which we also participated, the average Inter-TV using the Manual I method ranged from 8.4 to 29.3 (5). In our current study, we obtained lower Inter-TV, which is related to the fact that technicians were trained at the same center, following the same rules to perform the manual count as well as DIA. Additionally, all islets in the sample were preserved as a single digital image with a calibrated grid set on the image. By using the software annotation function, every islet was marked while being counted to prevent being repeated or missed during counting as is possible in the Manual D method.
IEQ count of 20 samples from the same flask performed by five technicians allowed for the calculation of the CVs of IEQs as ISV. ISV of IEQs in Table 2 had means ranging from 21% to 28%. Those 20 samples were collected from the same purity level of the islet preparation. The mean CV (equal to ISV) obtained from IEQ results of 12 sample pairs of 12 islet preparations was 32% in Manual I and 29% in DIA. Factors contributing to ISV include biological variation and measurement variation. Biological variation is mainly related to islet size. Islet size always varies from 50 to 400 μm, and it is an intrinsically variable factor for any islet preparation. Measurement variation could result from sampling and analysis errors. Sampling method has been introduced in the method section. In this study, sampling error is minimized since two experienced technicians carefully sampled in a consistent manner. Analysis error was around 10% as indicated from the CVs of IEQs in Inter-TV. Therefore, islet size must be a major factor contributing to the higher CVs in ISV. This biological variation can be minimized by consistent sampling technique, but cannot be avoided.
In this study, observations from three technicians were analyzed for intra-TV. Three islet samples from each group were analyzed three times by each technician on different days, at least 3 days apart. Both Manual I and DIA had mean CV of less than 10% without significant difference. In the previous multicenter study, the average of the intra-TV was 7.9 and 9.9 by the Manual I method (5). Intra-TV reflects the technical proficiency of the individual technician. Achieving mean Intra-TV less than 15% is feasible in Manual I and DIA and should be set as a goal in the technician's training.
Islet purity is a parameter used during islet processing. According to the purity level, islets are grouped in high, middle, or low purities during culture. Islet purity is one of the parameters that determine the islet distribution in the infusion bag for transplantation. Rough estimation of islet purity has been a standard, acceptable method utilized in all islet processing facilities (8). In this study, we compared purity estimation by the technicians based on the islet image to the DIA islet purity measurement. Their estimation of the high-purity islet samples (group H150) in our study did not differ significantly from the measured purity by DIA. It may be due to the fact that technicians had been well trained in the DIA method prior to the study, and they learned to correlate the purity based on DIA measurements with the islet sample image. Despite that, statistically significant differences of purity determination were found between estimation in Manual I and DIA when the other samples were assessed (group H100 and L100) (Table 3). Since purity in DIA is based on precise measurements instead of approximation in the manual method, it is obvious that DIA results are more accurate. It is objective and also can be verified retrospectively. Therefore, purity measured by DIA certainly has a distinct advantage over the traditional estimation method.
In this study, Manual I and DIA identified a similar number of IPN count; there were no statistical differences between Manual I and DIA. Islet distribution pattern per size group was similar as shown in Figure 4.
The IEQ/IPN ratio allows estimate of the shift in islet size distribution in the sample. Since one IEQ has a diameter of 150 μm, if IEQ/IPN ratio is 1, it implies the average size of islets in the flask is 150 μm. If the ratio is below 1, it means that islet size distribution is shifted to the lower islet size–-relatively more islets are smaller than 150 μm and, if ratio is >1, there is a shift in islet distribution to the large islet size, there are relatively more large islets in the sample. In our experience, IEQ/IPN ratio may be related to pancreas quality; there is a different islet size distribution after isolation from healthy pancreas or pancreas exposed to disease or stress, from an organ well preserved or inappropriately procured. Isolation technique may also influence the IEQ/IPN ratio. Our results also indicate that the IEQ/IPN ratio varies in different purity preparations from a single pancreas processing. In our study, although each of the samples tested came from the same organ and islet isolation, we found significant differences in IEQ/IPN ratio between high- and low-purity samples regardless of counting methods—Manual I or DIA (Fig. 5). The IEQ/IPN ratio was found to be higher in the high-purity samples than in low-purity ones. This confirms that the IEQ/IPN ratio is not a constant number in the islet preparation from a single donor, and it varies depending on the purity levels.
In this study, we validated our DIA protocol for measurements of islet mass and purity in comparison to the standard manual islet count and purity estimate. We concluded that DIA is a reliable technique. The advantage of DIA is that both islet sample and result produced by DIA can be permanently stored as electronic files and can be easily verified at any time. Retrospective review of islet quality and quantity during different processing stages available by using DIA provides a solid platform for laboratory professional training and promotes exchange of information between islet centers and progress in the field. Based on the observations, we conclude that DIA complies better with cGMP requirements than the manual counting method, and it is feasible to be applied in the settings of clinical islet processing and transplantation as a supplemental tool for current manual islet count.
Footnotes
Acknowledgments
The authors thank the cGMP facility staff, Diane Ostrega and Susan Wilson, for their consistent support to provide a high-quality work environment for human islet processing. We would like also to acknowledge the generosity and support of Dr. Martin Jendrisak and the entire team of the Gift of Hope Organ and Tissue Donor Network in Chicago for providing the human pancreas tissues used in this study. The authors also thank Dr. Ted Karrison and Mr. Rangesh Kunnavakkam, Department of Health Sciences, University of Chicago, for their thorough work on statistical analysis. This study was supported by the Illinois Department of Public Health Grant (Pancreatic Islet Transplantation) as well as University of Chicago DRTC Grant # P30 DK020595. Dr. Xiaojun Wang is recipient of a postgraduate research grant provided by China Scholarship Council, China. The authors declare no conflicts of interest.