
Abstract
For isolated pancreatic islet cell preparations, it is important to be able to reliably assess their mass and quality, and for clinical applications, it is part of the regulatory requirement. Accurate assessment, however, is difficult because islets are spheroid-like cell aggregates of different sizes (<50 to 500 μm) resulting in possible thousandfold differences between the mass contribution of individual particles. The current standard manual counting method that uses size-based group classification is known to be error prone and operator dependent. Digital image analysis (DIA)-based methods can provide less subjective, more reproducible, and better-documented islet cell mass (IEQ) estimates; however, so far, none has become widely accepted or used. Here we present results obtained using a compact, self-contained islet cell counter (ICC3) that includes both the hardware and software needed for automated islet counting and requires minimal operator training and input; hence, it can be easily adapted at any center and could provide a convenient standardized cGMP-compliant IEQ assessment. Using cross-validated sample counting, we found that for most human islet cell preparations, ICC3 provides islet mass (IEQ) estimates that correlate well with those obtained by trained operators using the current manual SOP method (r2 = 0.78, slope = 1.02). Variability and reproducibility are also improved compared to the manual method, and most of the remaining variability (CV = 8.9%) results from the rearrangement of the islet particles due to movement of the sample between counts. Characterization of the size distribution is also important, and the present digitally collected data allow more detailed analysis and coverage of a wider size range. We found again that for human islet cell preparations, a Weibull distribution function provides good description of the particle size.
Introduction
While type 1 diabetes (T1D) 1 can now be managed quite well through continuous glucose monitoring and exogenous insulin treatment, chronic and degenerative complications still occur in a considerable fraction of patients due to the unavoidable metabolic abnormalities that result from the autoimmune destruction of the insulin-producing β-cells2,3. Transplantation of pancreatic islet cells can provide much better metabolic control, but because of the lifelong immunosuppression required, it is currently limited to the most severe forms of diabetes4,5. Because of the increase in survival and function achieved in the last decades with improved therapeutic management6,7, it is already an approved treatment in some countries, and it is likely to become an Food and Drug Administration (FDA)-approved procedure for a selected cohort of patients in the US too. Therefore, a rigorous regulatory framework is needed to ensure that the isolation and purification of islet cells for clinical use can be reliably and reproducibly performed and that the criteria for a safe and quality product can be clearly defined. This makes it increasingly important to be able to consistently and reliably assess the mass and quality of isolated pancreatic islet cells needed for the corresponding clinical (i.e., transplantation) or research purposes—especially since islet mass has been consistently shown to be one of the most crucial factors correlating with clinical outcome after transplantation 8 .
Current methods used in human islet isolation and processing still rely on the method introduced three decades ago9,10. Several qualitative and quantitative tests are used to verify the quality of the final human islet cell product11,12. For example, pretransplant criteria that must be met include the determination of the total islet cell mass (>5,000 islet equivalents/kg recipient body weight), total pellet volume of the final preparation (<7 ml of tissue), islet cell purity (>30% islets), and viability (>70%). However, accurate assessment of the isolated islet mass is quite difficult because simply counting particles is not sufficient. Islets are spheroid-like cell aggregates of different sizes covering a relatively wide range: diameters from <50 μm up to 500 μm so that there can be differences of 1,000-fold in the mass of the smallest and largest particles. Typical size distributions also mean that whereas most particles are smaller (with the expected, i.e., statistical average, value of islet diameter being around 100 μm for human islets), most of the volume (mass) is contributed by the relatively few larger islets 13 . Following the consensus report of 1990 14 , it is standard practice to express the total volume of isolated islets in islet equivalent (IEQ) numbers (i.e., the number of “standard” islets of diameter d = 150 μm that would have the same total volume). Such a standard islet has a volume of VIEQ = 1.77 × 10⁻¹² m3 = 1.77 × 106 μm3 (containing around 1,500–2,000 cells). To not waste too many islets when assessing islet preparations, it is also standard practice to take a small sample from a gently but well-mixed islet suspension (e.g., 100 μl from 100 ml, representing a 1:1,000 dilution) and stain it with a diphenylthiocarbazone (dithizone; DTZ) solution. This will stain islets red by chelating the zinc from the insulin granules of the β-cells while leaving the acinar cells unstained and whitish. Islets are then manually counted using a light microscope with an ocular micrometer by following a classic international procedure (CIP15,16). All islets larger than 50 μm are classified on the basis of their estimated average diameter into classes of 50-μm increments (i.e., 50 −100, 101–150, 151–200, …, 351–400, >400 μm) and counted as such. For each class, the number of corresponding IEQs is calculated by multiplying the islet counts with a conversion factor based on the mean volume of that class15,16.
It is well known that, in addition to errors due to sampling, manual counting is prone to considerable scatter due to high intra- and interoperator variability caused by the subjective nature of the size assessment procedure and the tediousness of counting each individual particle in the sample. Because of the rapid increase in volume (mass) with size (i.e., proportional with d3), only a few large islets can contribute considerably to the total IEQ. Typically, islets with d > 250 μm that represent only about 5% of the total particle count provide approximately 25–30% of the mass (IEQ) 13 . For the manual count of islet mass (IEQ), coefficients of variability (CV) as high as 20–30% have been found in several studies, for example, 31% in the work by Friberg and coworkers 17 , 32% in our own previous study using islet-like microsphere mixtures of known composition 13 , as well as intertechnician variabilities of 15% 18 and 9% 19 for image-based counts that are less error prone. Digital image analysis (DIA)-based methods could provide much more reliable and reproducible assessments, and several versions have been proposed especially in the past decade13,17–28—see Wang and Kaufman 29 for a recent detailed review. Considerable improvements have been achieved in the last few years; nevertheless, because all of these methods rely on various image collection equipment and image processing software that need to be acquired, standardized, and learned at each islet-processing center, none has become widely adapted or accepted as standard. In addition to DIA-based methods, flow cytometry techniques 30 as well as cytometry on dissociated islets31,32 were also explored to provide a more objective quantitative evaluation, but manual counting techniques are still the only ones widely used and accepted.
The purpose of the present study was to assess the ability of a new fully automated islet cell counter (ICC3; Biorep Technologies, Miami, FL, USA) to quantitate the mass, size distribution, and purity of isolated human islet cell preparations and to compare it with the current standard manual procedure. ICC3 is a compact, self-contained unit that includes both hardware and software designed specifically for islet counting and requires minimal operator training and input for the whole process; hence, it can be easily adapted at any center and could provide a convenient standard Current Good Manufacturing Practice (cGMP)-compliant islet cell mass assessment method.
Materials and Methods
ICC3 Islet Counter
The islet cell counter used for the present study (ICC3; Biorep Technologies) is a machine vision system that includes both hardware and software designed specifically for automated islet counting (Fig. 1). For each sample, a single high-resolution image is taken (using scattered light and excluding the light from the source for a dark background; camera pixel size: 5.3 μm) (Fig. 2C) that is then subjected to DIA to assess the amount and purity of the islet cell sample. ICC uses a fully automated counting method implemented in LabVIEW software [Laboratory Virtual Instrumentation Engineering Workbench (LabVIEW); National Instruments, Austin, TX, USA]. Islet samples are prepared and stained with diphenylthiocarbazone (dithizone; DTZ) following the same standard operating procedure (SOP) as is used currently15,16. The software uses pixel coloration to separate islets from acinar tissue (Fig. 2C and D), and a segmentation-based algorithm (see Fig. 3) to delineate each individual islet and calculate its area. The area (A) is then used to calculate an average diameter of the islet corresponding to that of a circle with the same area, d = 2r = 2(A/π)1/2. To maintain similarity with the current manual counting procedure, the IEQ (mass) contribution of each islet is than obtained using the same 50-μm increment group classification and standard IEQ group values as in the current SOP15,16: 0.167 for 50–100 μm, 0.667 for 101–150 μm, 1.685 for 151–200 μm, 3.500 for 201–250 μm, 6.315 for 251–300 μm, 10.352 for 301–350 μm, and 15.833 for >350 μm. All calculated values including islet particle number (IPN), estimated islet mass (total IEQ), purity (%), and size group distributions, as well as the high-resolution image, are saved in the final output as both Word document and Adobe pdf files (Fig. 2E). Furthermore, a detailed listing of the size, position, and other characteristics (e.g., circularity) of each single islet detected is saved in an additional Excel file. For exploratory purposes, the current version also calculates three other IEQ estimates: one with the same group-based approach just using a set of slightly different distribution-corrected group contributions 13 (bIEQ), one that uses a simple two-dimensional (2D) area-based estimate (area IEQ; aIEQ), and one that uses the individual volume of each islet [assuming spherical islets, V = 4πr3/3 = 4π(A/π)3/2/3] to obtain individual contributions (IEQ = V/Vd=150) (pIEQ).

The laptop-controlled fully automated islet cell counter (ICC3) used for the present digital image analysis (DIA) assessment. Inset at bottom left illustrates the special dish used by ICC3 (compared to a standard 35 × 10-mm counting dish with 2-mm grids used for manual counting on the left) together with acceptable dithizone (DTZ) staining.

Samples of DTZ-stained human islets from the same isolation as seen in transmitted light through a regular bright-field counting microscope (A, B) (different pictures taken with two different cameras and exposures) and as imaged by the current ICC3 DIA machine (C) (dark-field-like scattered light with dark background). A corresponding software-generated islet tissue selection (D) (highlighted in blue) and a typical detailed output (E) are also included. In the column graph, the islet number per group is shown on the y-axis, and the islet size group is shown along the x-axis.

Screen capture illustrating the standard display and the segmentation algorithm used to delineate individual islets based on their color and to assess their size. For each islet, average diameter is determined as that of the circle with the same area as measured here. ICC3 resolution is approximately 5.3 pixel/μm.
ICC uses specifically designed dishes (ICC-Dish) (see inset in Fig. 1) for its imaging system because they have to be compact enough to allow for high-resolution imaging of the region of interest (ROI) in a single picture, but still provide enough area to spread the sample sufficiently to minimize errors due to aggregation. With this dish, a fill volume of 350–400 μl is recommended to ensure complete coverage of the dish surface—typically, this is achieved by mixing an islet sample volume of 100 μl with 250 μl of either standard filtered DTZ solution (for stained preparations) or clear buffer (for unstained preparations). To have a reliable estimate, one should have a sufficient number of islets, but not as many as to have unavoidable aggregation problems—in our experience, particle numbers of ~50 to ~400 work best. Because for stained samples a color-based classification is used to identify islet tissue (Fig. 2C and D), both under- or overstaining can lead to erroneous estimates, and it is important to use standard staining conditions as described in the user manual. ICC3 is calibrated to work for DTZ staining prepared following the same procedure as the currently used SOP for manual counting15,16. To ensure that size estimates are correct, a calibration test has been done using red ChromoSphere polymer microspheres (Thermo Fisher Scientific, Waltham MA, USA) with nominal diameters of 150 μm as used previously 13 . Because they gave ring-like reflections due to their very regular shape, they could be counted only after placing an additional semitransparent diffusive layer on top of the counting dish. Manual islet counts used as reference for the present cross-validation were obtained by averaging counts from n = 2–4 trained human operators who followed the current SOP for the accepted CIP using a light microscope with an ocular micrometer15,16. Since the standard 35 × 10-mm counting dish with 2-mm grids used for this manual SOP method is different than the special dish used by ICC, islets had to be transferred from one dish to another between the two different counts. This was done carefully using wide-tip pipettes and verifying each time that no detectable islets were left untransferred. To avoid bias, a cross-validation approach was used in which half of the samples were first counted with the manual method and then transferred for the automated counter, while the other half were first counted with the automated counter and then transferred for the manual method. All counts shown here are for postpurification samples. Coefficients of variability (CV) were calculated as the ratio between standard deviation (SD) and mean as customary: CV(%) = σ/μ.
Islet Cell Preparations
Islet cell samples used for the present comparison were from human isolations performed at the Human Islet Cell Processing Facility at the Diabetes Research Institute (University of Miami, Miller School of Medicine, Miami, FL, USA). The islet isolation protocol, as part of the Clinical Pancreatic Islet Transplantation Study, was approved by the institutional review board (IRB) of the University of Miami and the FDA. Human pancreatic islet isolations were performed in the clean room of our cGMP facility. Human pancreases were from deceased multiorgan donors for which consent for transplantation was obtained by accredited organ procurement organizations (OPOs) from the donors' families or next of kin. Islets were isolated by using a modification of the automated method 9 as described previously9,11,33.
Islet Size Distribution Models
Islet counts used to estimate the size distribution (i.e., fractional composition per islet size group) of isolated islets were from more than 200 isolations performed in the past and used retrospectively. As described previously 13 , for this purpose, only data from isolations with a total number count of at least 150 and estimated IEQ of at least 200K were used to calculate fractional compositions leaving n = 113 for prepurification (pre-Ficoll) and n = 56 for high-purity layer data. Analyses of the size distribution data have also been performed following, essentially, the method described previously 13 . Islet size was assumed to follow either a Weibull distribution or a log-normal distribution. The Weibull distribution function 34 (also known as Rosin–Rammler distribution 35 ) is a flexible probability density function often used in survival and failure analysis and various other applications to characterize particle size 36 . The corresponding probability density function is:
where x is the independent variable (here, d the diameter), κ > 0 is a shape parameter, and λ > 0 is a scale parameter. To obtain the parameters of the function describing the size distribution of human islets, the corresponding average frequency distributions (fractional compositions) of IPN and islet mass (IEQ) per islet size groups (of 50-μm increments) were calculated, renormalized, and then optimized using the Solver tool in Excel (Microsoft, Redmond, WA, USA) to give the best fit [minimum sum of squared errors (SSE)] with the average fractional compositions obtained from the experimental islet cell counts for both IPN and IEQ13,37. A log-normal distribution, which describes a probability distribution of a random variable whose logarithm is normally distributed, can give a similar profile and has been used in some cases for islet size distribution. The corresponding probability density function 36 is given by:

This was also fitted to the experimental data with a procedure identical to the one used for eq. 1. In addition to the data from manual counting per standard 50-μm size groups, the present digitally acquired data were also used for size distribution studies, as they include the exact size estimate of each large enough islet in the sample. Using a specialized setting, all islets down to a size of approximately 25 μm were counted in several samples from n = 4 human isolations. They were grouped in 10-μm size increments to allow more detailed fitting using the same procedure as described above.
Results
Accuracy and Variability Assessment
The main objective of the present work was to evaluate a new fully automated islet cell counter (ICC3; Biorep Technologies) and assess how its ability to quantitate the mass, purity, and size distribution of isolated human islet cell preparations compares with the current SOP that relies on manual counting by trained human operators. The ICC counter is a compact, self-contained machine vision unit controlled from a laptop with a built-in light source and high-resolution camera that uses DIA to quantitatively characterize islet cells placed in a special ICC counting dish (Fig. 1). It includes both hardware and software designed specifically for islet counting, and it does not allow adjustments to be made by regular users (fully adjustable settings can be allowed for selected advanced users). Other than staining the islets with DTZ, placing them in the counting dish as a single layer, spreading them to minimize aggregation (islet to islet contact), and entering the description and dilution data of the sample, the DIA-based counting requires minimal input from the human operator. We compared counts (i.e., islet cell mass, IEQ, and estimates) obtained with this automated counter (n = 2 different machines) to those obtained with the current SOP manual method15,16 by multiple trained human operators (n = 2–4) for the same human islet samples. Such a comparison was particularly important, because the ICC count is based on images taken with scattered light (similar to dark-field microscopy excluding the light from the source and resulting in a dark background) that are different than the images with transmitted light in the typical bright-field microscope used for manual counting (Figs. 2 and 3), and one has to make sure that these do not result in counts that need some recalibration. A calibration test with red polymer microspheres of known diameters as used previously 13 confirmed that size estimates are in the right range; spheres with a nominal diameter d = 150 μm (149 ± 8.9 μm; n = 248) were detected by ICC3 as having an average diameter of d = 139 ± 11.0 μm (back-calculated from their area). A slight reduction is likely due to the fact that such regular smooth spheres could be counted only after placing a semitransparent diffusive layer on top of the counting dish, and this resulted in a lighter background and some loss of area around the edges of the projected image of each sphere.
Comparison of the human versus machine (ICC3) counts obtained for a total of 14 islet samples from three different human pancreas isolations counted in a crossover manner shows that the ICC3 counts agree well with the average human counts (Figs. 4 and 5); while there is some scatter, overall there is good correlation (r2 = 0.78), and the slope is very close to unity (1.02). Accordingly, the ICC3 IEQ estimates could be considered equivalent with the manual SOP estimates, and there is no need for conversion factors due to the different imaging methods. The average variability of the automated counts (CV = 8.9%) was much less than that of the human counts (CV = 16.7%). This is also evident in Figure 4 by comparing the corresponding error bars representing SDs for both the automated ICC3 and the manual counts. Most of the variability of the ICC3 automated counts came from the fact that samples were moved between counts as well as between the two machines used, and the islets rearrange in the dish, leading to slightly different images and, hence, counts. On the other hand, most of the variability for the human counts (Fig. 5) was true interoperator variability, as, typically, the samples were not or just minimally moved between those counts. The CV for human counts obtained here (16.7%) is in good agreement with previous estimates suggesting CVs as high as 20–30% (e.g., ~30% in dish-based manual counting13,17 or 10–15% intertechnician variabilities in the less error-prone image-based counting18,19).

Average islet mass (IEQ) counts obtained for the same samples with the present DIA method (ICC3) versus the corresponding ones obtained by experienced operators using the current manual standard operating procedure (SOP). Data are mean ± standard deviation (SD) for multiple samples collected and counted in a crossover manner (i.e., half counted first manually then digitally with ICC3, and half counted first digitally and then manually; n = 14 samples from three different human pancreas isolations). Each point represents average of n = 4 counts for ICC3 (from two machines each with two counts) and n = 2–4 counts for humans (SOP, different experienced operators). Error bars represent corresponding variabilities (SDs) for the human and automated ICC3 counts for each individual sample (horizontal and vertical lines, respectively).

Two illustrative sample counts showing IEQ counts for the same sample obtained by the manual SOP (left columns: different experienced human operators, HO1–HO4) and the ICC3 DIA machine (right columns: two counts each from two different machines). Data are total IEQ counts shown as stacked columns color coded by the 50-μm increment size groups as indicated by the labels. Each colored column segment denotes the IEQ contribution of the corresponding size group (see figure key) as assigned by the counter.
In addition to the islet number (IPN) and mass (IEQ) estimates, ICC3 also provides purity estimates based on the ratio of areas classified as islet and total tissue. While these are only estimates, they still can serve as useful guides, especially as in the current standard manual procedure islet purity is not actually calculated or measured, just roughly estimated by the technician performing the counting. ICC also provides a detailed description of the islet size distribution. Its standard output includes the IPN and the corresponding IEQ contribution per each standard 50-μm increment size group in a manner similar to the current manual counting practice (Fig. 2D). In addition to this, it also provides a detailed listing of the size, position, and other characteristics (e.g., shape) of each single islet detected in a separate file.
Size Distribution of Isolated Human Islets
The size distribution of islet numbers has been reanalyzed using, in addition to the previous data from manual counting per standard size groups 13 , the present digitally acquired data that also includes the exact size estimate of each large enough islet in the sample. As described previously 13 , islet size was assumed to follow either a Weibull distribution or a log-normal distribution. The frequency distribution (fractional composition) per islet size group used for the fitting was from manual islet counts from more than 200 human isolations performed at the Human Islet Cell Processing Facility at our institution (Diabetes Research Institute, University of Miami, Miller School of Medicine) 13 with a standard automated method9,11,33. Similar data obtained from 276 human isolations performed at the University of Illinois 37 was also included, and the overall average of both IPN and islet mass (IEQ) was used for fitting (Fig. 6).

Frequency distribution of the islet particle number (IPN; top) and mass (IEQ; bottom) of average human islet preparations (blue) versus those calculated with the Weibull distribution function used here (κ = 1.3, λ = 101; dark red) for the standard islet size grouping of 50-μm increments. Islet data shown are average of 113 (prepurification, Miami Pre) and 56 (high-purity layer, Miami L1) isolations performed at our institute (DRI) 13 as well as 276 isolations performed at the University of Illinois at Chicago 37 .
For these data, best fit was obtained with a Weibulltype probability density function (eq. 1) 36 having parameters of κ = 1.3 and λ = 101, just slightly different from the parameters obtained in our previous fitting using IPN data only (κ = 1.5 and λ = 105). As before, a log-normal density function (eq. 2) 36 was also fitted and found again to give a slightly worse fit [sum of squared errors (SSE) of 5.5 × 10⁻³ vs. 2.1 × 10⁻³], reinforcing that, even though differences are small, a Weibull distribution function seems more adequate to fit the size distribution of human islets. Corresponding distributions per size groups are shown in Figure 6.
The present digitally acquired data also include the exact size estimate of each large enough islet detected in the sample. This allows further, more detailed, analyses since with manual counts only islet numbers per 50-μm size group were available, while here they can be grouped in any arbitrary size group. We used a grouping in 10-μm increments, as this seemed a sufficiently detailed, but still reasonable, choice considering the resolution of the present digital image-based data (5.3 μm per pixel). Furthermore, we also counted islet particles down to a size of about 25 μm, not just 50 μm. As data from only a relatively limited number of isolations (n = 4) were available so far, the parameters of the distribution functions were not readjusted, but the Weibull distribution function with its above-derived parameters fits these data quite well (Fig. 7). Again, it also provides a better overall fit than the log-normal function (SSE of 1.0 × 10⁻² vs. 4.3 × 10⁻²), suggesting that it is the better-suited distribution function for (human) islet size. Digital counting of the small particles suggests that they contribute a relatively large fraction to the total islet particle count—about 35% for islets with diameters between 25 and 50 μm; however, their contribution to the total IEQ is negligible (<1%). This agrees with previous findings from two recent DIA studies17,28 and further supports a more Weibull-like distribution as the two functions are relatively similar, but one of the main differences is in the left side of their shapes with the log-normal distribution predicting a smaller frequency of small particles (see Fig. 7).
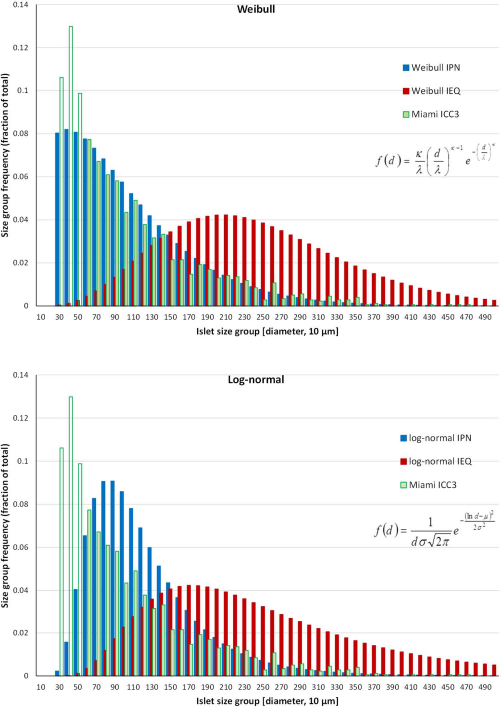
Frequency distribution of the islet particle number (IPN) obtained with the ICC3 (green, average of multiple samples from four different human islet preparations) for islet size grouping of 10-μm increments overlaid with the distribution predicted by the present Weibull distribution function (eq. 1; fitted for the data of Fig. 6, κ = 1.3, λ = 101) for both IPN (blue) and IEQ (dark red) (top). A corresponding graph with the log-normal distribution function that gave the best fit for the data of Figure 6 (eq. 2; σ = 0.54, μ = 4.54) is also shown (bottom).
Discussion
The correct quantitative assessment of the mass and quality of isolated pancreatic islets is very important for anyone working with such preparations, and it is particularly important for clinical applications, as islet mass has been shown to be one of the main factors determining clinical success after transplantation 8 . The current manual practice used as standard in all centers is known to be error prone, highly variable, and operator dependent. The skills required to carry out direct microscopic analysis as needed for the current manual SOP necessitate considerable training and several years of practice. Quality assurance requires bi-yearly validations of personnel authorized for manual counting; nevertheless, considerable intertechnician variabilities are known to persist. Because samples are discarded, manual counts are impossible to reanalyze and are difficult to verify (an important criteria for cGMP-compliant implementation). DIA-based methods may have many advantages over these manual methods, as they can provide faster, less-subjective, more reproducible, and better-documented islet cell mass (IEQ) estimates. Nevertheless, none has become widely used or accepted as standard mainly because the lack of easily available standard hardware and software across all centers that would require minimal training. The ICC3 machine presented here is a compact, self-contained unit that includes both the hardware and software needed for automated islet counting and requires minimal operator input for the whole process; hence, it can be easily adapted at any center and could provide a convenient standard cGMP-compliant islet cell mass assessment. ICC3 also provides a digital record, and the corresponding images can always be reanalyzed later.
We found that for most human islet cell preparations, this automated counter provides IEQ estimates that are in line with those obtained by trained operators using the current manual SOP method (r2 = 0.78, slope = 1.02) (Figs. 4 and 5). The variability and reproducibility of the counting are also acceptable, as most of the obtained variability (CV = 8.9%) results from the rearrangement of the islet particles when the counting dish is moved. Because each automated count takes less than a minute, as general practice, we suggest counting each individual sample three times, slightly stirring the sample and allowing the islets to resettle between each count, and then using the average of these counts. If any of the counts is more than 15% different, at least one additional count should be performed and the outlier omitted if needed. Because of the different lighting conditions (scattered vs. transmitted light resulting in dark vs. bright background), some islet samples might look a bit different, and in one case of islets that did not stain very well with DTZ, we obtained about 30% higher counts with ICC than the average of human counts; these were not included in the present analysis. Low-purity samples can be counted, but if abundant acinar tissue is present (e.g., prepurification samples), lighting is affected, and the counts are no longer reliable. Hence, at least during a first evaluation/transition period, both counts should be performed in parallel, but, by all indication, the ICC automated counts are faster, more reliable, more reproducible, less variable, and much easier to perform than the current manual SOP counts. One also needs to remember that regardless of the accuracy of the counting, sampling errors still remain, and at the large dilutions typically used for human islets (e.g., 1:1,000), they are likely to be quite significant and larger than the counting errors13,17.
Correctly assessing not only the total IEQ content but also the fractional composition of islet cell preparations is of considerable relevance, as the proportion of smaller or larger islets present may have important consequences that influence the effectiveness of research or clinical transplantations. It has been suggested that smaller islets could provide better results38–45, most likely because nutrient delivery and, in particular, oxygen delivery limit the viability and insulin-producing ability of the core regions of larger avascular islets. This is something that has been clearly shown with computational models of glucose-induced insulin secretion46–49. In smaller islets, delivery limitations are less severe during the first few days while the transplanted islets are still avascular and have to rely on gradient-driven passive diffusion. Smaller islets might even revascularize better 50 . Single islet glucose-stimulated insulin release (GSIR) studies found that high-glucose-induced insulin secretion per IEQ was significantly lower in larger islets than in smaller islets 51 . In agreement with these, a recent retrospective study of human islet autotransplants found that recipients of marginal islet doses were more likely to achieve insulin independence when transplanted with a greater number of smaller islets 44 .
A normal human pancreas has around 1 million islets 52 that contain the endocrine cells (α, β, γ, and PP cells), whose main role is to secrete hormones that regulate blood glucose levels. The size frequency distribution of pancreatic islets has been assessed in various animals18,23,25,53–62 as well as in humans13,27,37,63–65 from as early as the 1930s. Notably, despite large differences in body weight, pancreas size, and total β-cell mass among different species such as mice, rabbits, pigs, monkeys, and humans, the size distribution of islets seems to be quite similar 66 , possibly suggesting an intrinsic limit to islet size 62 . The size distribution of islets also seems to be quite similar to that of thyroid follicles 67 . Human and monkey islets tend to contain larger particles than those from other species, but the overall distributions estimated from pancreas staining do not seem that different 66 . Detailed quantitative/statistical studies to describe the size distribution have been done in a few cases, and log-normal54,55,60,62,63 or Weibull distribution functions13,60,64 were found to provide the best fit; this is why they were selected here as well. We analyzed the size distribution of human islets using both a large number of data from manually counted isolations, where only frequency distribution per standard 50-μm size groups were available, as well as the present digitally acquired data for recent isolation, where detailed size distribution data for all islets were available.
As described previously 13 , we found that Weibull or log-normal distribution function can provide adequate descriptions, with a Weibull function providing the better fit. Because the two shapes are overall quite similar, having only slightly different tails (Fig. 7), the existing data do not allow a clear distinction between them, but the Weibull function consistently provided a better fit with all of our data (Figs. 6 and 7). Some theoretical support for Weibull or log-normal distribution has been provided, as they can be obtained by assuming growth dynamics within the islet with independent or coherent replication, respectively 60 . The present islet size distribution data, including that from ICC3, confirm again that in human islet samples, large islets (d > 250 μm) constitute a significant portion of the total mass (IEQ; i.e., on average, more than 25%). It is possible that the isolation process somewhat disrupts the composition of islets in their native state resulting in somewhat smaller, more fragmented islets. Hence, native islets might exhibit an even higher volume contribution from larger islets 58 . The frequency distributions of the islet isolations performed here in Miami are quite consistent with those published by the group at the University of Illinois (Chicago, IL, USA) 37 (Fig. 6). Older data published by the University of Alberta (Edmonton, Canada) 65 and the University of Geneva (Geneva, Switzerland) 27 are also similar, but with larger fractions of the smallest islets (50 μm < d < 100 μm; ~70 vs. ~45% here). Some of this might be due to older, less optimized isolation conditions, as well as to misjudging the size in manual counting (see manual vs. DIA 27 ). Furthermore, because of the low volume of these islets, the IEQ distributions are barely affected and very similar to those found here. Along the same lines, counting islets smaller than 50 μm confirmed again here that, while they contribute a large portion of total particles (~35% here for islets sized between ~25 and 50 μm), their contribution to the total mass (IEQ) is negligible (<1%). Two recent DIA studies that counted islets smaller than 50 μm also found that they accounted for a large portion of the total islet number: 37% for islets 20 μm < d < 50 μm 17 and ~60% for islets 10 μm < d < 50 μm 28 , but very little of the total islet mass. As mentioned, this further supports a Weibull-like distribution versus a log-normal one as the latter predicts less particles at the smaller sizes (Fig. 7). Analyses of immunostained pancreatic sections also seem to suggest that most islets are small, with diameters <100 μm or even <50 μm—an observation that seems to hold even across species 66 . While islets with d < 50 μm are not counted in the manual SOP method, partly because they are considered cell debris and partly because they contribute only very little to the total mass (IEQ), they could be easily counted with DIA methods down to a lower limit (e.g., d > 20 μm, determined by the pixel resolution and the limit of debris). While of relatively little overall mass, these small islets might still influence the outcome of transplant significantly, as they might better survive the early hypoxia that occurs following transplantation while the islets are not yet revascularized.
ICC3 as tested here uses the same size group-based IEQ calculation as the current standard manual SOP to maintain similarity with the current method. However, for beta testing and exploratory purposes, ICC3 also provides three alternative IEQ estimates: one with adjusted group contributions 13 (bIEQ), one with a simple area-based estimate (aIEQ), and one with individual IEQs calculated for each islet (pIEQ; see Materials and Methods section for further details). A comparison of their values versus the SOP-calibrated IEQ for islet samples analyzed here is shown in Figure 8. Among them, pIEQ should be the most rigorous, as it estimates the mass of each individual islet without any grouping; the only assumption used is that islets are spherical. While aIEQ correlates the least and has different values, as it does not include a 3D correction, it still shows adequate correlation (r2 = 0.92). With an adequate calibration factor, aIEQ could become a useful descriptor, as it is a pixel-based approach well suited for a machine vision approach. It is also the only descriptor not affected by segmentation errors or size distributions. The slope obtained for the adjusted group contribution bIEQ here (0.937) agrees perfectly with our previous suggestion that use of the distribution-corrected group contributions leads to overall IEQ estimates that are corrected downward with an average of about 4–8% (i.e., corresponding to a slope of 0.92–0.96), as the standard group contributions used in the manual counting are somewhat overestimating the IEQ contribution of each size group 13 . This also supports the observation that, overall, the bIEQ values are in very good agreement with the individual particle-based pIEQ calculation (see overlapping trendlines with slopes of 0.937 vs. 0.929 in Fig. 8). The slope of pIEQ (0.929) also agrees well with a previous suggestion from a computer-assisted DIA method used to quantify islet cell preparations that found the IEQ number calculated using individual sphere volumes was 10% lower (p < 0.0001) when compared with that calculated using the standard group conversion factors 27 . It should be mentioned that even with individual IEQ summation, total islet volume might still be somewhat overestimated if (cultured) islets are less 3D (spherical) and more flat (disk-like and ellipsoidal) so that volume increases less abruptly with diameter than for true 3D sphere—a possibility that has been suggested by some observations31,32.

Correlation between the standard group contribution-based IEQ estimate calculated by the DIA-based ICC3 IEQ (x-axis) and alternative IEQ estimates that are calculated by the software for exploratory purposes (y-axis): bIEQ, which uses the same size group contribution approach just a set of slightly different group contributions 13 (orange); aIEQ, which uses a simple 2D area-based estimate (green; essentially, the total islet area in the picture); and pIEQ, which uses the sum of volumes calculated separately for each islet [blue; assuming spherical islets, V = 4πr3/3 = 4π(A/π)3/2/3] to obtain their individual contributions (IEQ = V/Vd=150). Data are for n = 32 counts of human islet cell samples.
In conclusion, the automated islet cell counter ICC3 tested here provides IEQ estimates in line with the average of those obtained by trained human operators using the current SOP manual method. Its DIA-based counts are not only easier and faster to perform than the current manual method, but are also less operator dependent, less variable, and more reproducible. It also provides full digital documentation that includes purity and size distribution data. Since ICC is a single laptop-controlled unit that includes all hardware and software needed and requires minimal operator training and input, it can be easily adapted at any center and could provide a convenient standard cGMP-compliant islet cell mass assessment.
Footnotes
Acknowledgments
Financial support by the Diabetes Research Institute Foundation (www.diabetesresearch.org) is gratefully acknowledged. We would also like to thank the personnel of the cGMP group at the DRI for their help in performing the manual islets counts. F.E. is an employee and A.B. is a consultant of Biorep, the company that is the developer and owner of the ICC3 machine used here. All other authors (P.B., A.T.-G., E.L., and C.R.) declare no conflicts of interest as defined according to the information for contributors. Biorep provided the counters used for the present study, but otherwise provided no financial support.