
Abstract
Rapid growth in the field of stem cell research has generated a lot of interest in their therapeutic use, especially in the treatment of neurodegenerative diseases. Specifically, human neural progenitor cells (hNPCs), unique in their capability to differentiate into cells of the neural lineage, have been widely investigated due to their ability to survive, thrive, and migrate toward injured tissues. Still, one of the major roadblocks for clinical applicability arises from the inability to monitor these cells following transplantation. Molecular imaging techniques, such as magnetic resonance imaging (MRI), have been explored to assess hNPC transplant location, migration, and survival. Here we investigated whether inducing hNPCs to overexpress ferritin (hNPCsFer), an iron storage protein, is sufficient to track these cells long term in the rat striatum using MRI. We found that increased hypointensity on MRI images could establish hNPCFer location. Unexpectedly, however, wild-type hNPC transplants were detected in a similar manner, which is likely due to increased iron accumulation following transplantation-induced damage. Hence, we labeled hNPCs with superparamagnetic iron oxide (SPIO) nanoparticles to further increase iron content in an attempt to enhance cell contrast in MRI. SPIO-labeling of hNPCs (hNPCs-SPIO) achieved increased hypointensity, with significantly greater area of decreased T2* compared to hNPCFer (p < 0.0001) and all other controls used. However, none of the techniques could be used to determine graft rejection in vivo, which is imperative for understanding cell behavior following transplantation. We conclude that in order for cell survival to be monitored in preclinical and clinical settings, another molecular imaging technique must be employed, including perhaps multimodal imaging, which would utilize MRI along with another imaging modality.
Keywords
Introduction
In recent years, the cell transplantation field has seen an increase in the use of human stem and progenitor cells (30,35,53). Neural progenitor cells, which differentiate only into cells of the neural lineage and have been shown to migrate and integrate into degenerating tissues, have been examined in several preclinical and clinical trials for various neurodegenerative disorders including stroke, Huntington's disease (HD), and amyotrophic lateral sclerosis (ALS) (4,23,30,34). In one study, human neural progenitor cells (hNPCs) were transplanted in the striatum of an HD rat model, where they demonstrated their potential for migration toward injury, neuronal and glial differentiation, and even initiation of recovery (37). Similarly, spinal cord-derived stem cells (59) and cortical-derived hNPCs (41) have been shown to ameliorate the symptoms of ALS in a transgenic rat model of the disease, while a recent phase I clinical trial validated the safety of spinal cord-derived human neural stem cell delivery to the spinal cord for treatment of ALS (45). These studies, along with a number of others, support the use of hNPCs for therapy of neurodegenerative disorders (2,4,29).
Despite a number of encouraging preclinical and clinical studies treating neurodegenerative diseases with hNPCs, the inability to visualize these cells following therapeutic grafting presents a major challenge in the field. Unfortunately, postmortem histology typically used to assess cell survival and migration in animal studies is not clinically applicable, as it does not permit reliable, longitudinal assessment of grafted cell survival, migration, and homing during the patient's life. The development of noninvasive methods for in vivo hNPC tracking would allow researchers and clinicians to better understand cell migration, homing, and graft rejection (36,43,44) and thus permit stem cell transplants to continue to move toward clinical use.
Successful stem cell tracking requires an imaging modality that provides high resolution, sensitivity, and contrast to distinguish cells of interest from endogenous tissues. Molecular imaging holds great potential for non-invasive cell tracking, although no single imaging modality appropriate for cell tracking boasts both excellent resolution and sensitivity. Magnetic resonance imaging (MRI), which relies on variations in water proton concentrations and relaxation properties in different tissues, provides excellent anatomical resolution and soft tissue contrast. Precise anatomical visualization of cell location and lack of ionizing radiation make this imaging modality appealing for cellular imaging, especially in humans. Direct cell labeling and genetic cell modification are two methods of cellular tagging that aim to distinguish cells from surrounding tissues during imaging. Direct labeling involves delivery of a nanoparticle or small molecule detectable with a corresponding imaging modality. Superparamagnetic iron oxide (SPIO) nanoparticles have been the gold standard for MRI-based cell tracking (7,14,16,40). However, this labeling technique is not always specific to the initially labeled cells as the molecule providing image contrast may be taken up by endogenous cells (8,12,28). Another labeling technique, cellular genetic modification, involves inducing expression of a protein of interest that can be subsequently used for cell detection. This method overcomes some of the disadvantages of direct labeling since reporter protein expression typically ceases upon cell death, thereby minimizing false-positive detection of transplanted cells.
Overexpression of iron-related proteins, such as transferrin receptor (TfR) and ferritin, has been explored for cell tracking (17,26). Ferritin is an intracellular iron storage protein that stores up to 4,500 iron ions per molecule (24). It consists of 24 light- and heavy-chain subunits that are encoded by different genes (11,57). Heavy-chain ferritin (H-ferritin) participates by converting the more toxic Fe2+ to Fe3+, while light-chain ferritin (L-ferritin) is primarily involved in long-term iron storage (31,54). It has been shown that intracellular iron concentrations regulate ferritin expression (54), and it is hypothesized that cells overexpressing ferritin would have the capacity to take up more iron compared to wild-type (WT) cells. This increase in intracellular iron loading would affect proton spin–spin interactions resulting in a greater signal hypointensity on T2*-weighted MR images. Indeed, transient expression of the ferritin protein has been utilized to demonstrate increased contrast in T2*-weighted MR images (17). This technique has been verified in vitro for labeling endogenous neuronal stem cells (eNSCs) (27) and monitoring their migration along the rostral migratory stream (RMS) (26,55).
In this study, we explored ferritin overexpression as a method of tracking hNPCs in the rat brain using MRI. We found that iron in ferritin-overexpressing hNPCs could be detected in vivo in the rat striatum with MRI. Unexpectedly, WT hNPCs (hNPCsWT) were also detected using MRI. Furthermore, we discovered that while cellular contrast could be increased using SPIO labeling, none of these cellular tracking techniques successfully revealed graft rejection in vivo. These findings are valuable for future cell tracking for preclinical and clinical purposes as they expose the need for approaching in vivo cellular tracking using alternate MRI-based strategies or perhaps multimodal imaging.
Materials and Methods
Cell Culture
Isolation of hNPCs was done at 8 weeks gestation by Dr. Guido Nikkhah (Germany) following the protocols set by the National Institutes of Health and the local ethics committees at the University of Freiburg, Germany, and the University of Wisconsin-Madison, where the resulting line was generated (47,52). The University of Wisconsin-Madison Institutional Review Board approved all of the work done in this study. The hNPC G010 line was prepared from the male fetal cortex and expanded using a previously described method (51). These cells have been characterized over several decades (42,52) and have shown to survive and have beneficial effects in multiple degenerative diseases (4,22,49). The cells were grown as free-floating cell clusters, termed neurospheres, in medium which contained Dulbecco's modified Eagle medium (DMEM; Sigma-Aldrich, St. Louis, MO, USA) and Ham's F12 (Sigma-Aldrich) (7:3), and penicillin/streptomycin/amphotericin B (PSA, 1% v/v; Life Technologies, Grand Island, NY, USA), supplemented with B27 (2% v/v; Life Technologies), epidermal growth factor (EGF, 100 ng/ml; Millipore Corp., Billerica, MA, USA), fibroblast growth factor-2 (FGF-2, 20 ng/ml; Millipore) and heparin (5 μg/ml; Sigma-Aldrich). After 10 passages, the cells were switched to maintenance medium, which had no B27 but included N2 (1% v/v; Life Technologies) and leukemia inhibitory factor (LIF, 10 ng/ml; Millipore). This maintenance medium increased the cell expansion rate and facilitated stable growth for another 20 to 30 passages (58). While early passage hNPCs (less than passage 15) demonstrate an increased rate of neurogenesis, cells around passage 15 switch toward glial differentiation (46). These later passage hNPCs (passage 20–35) were used for all experiments in this study. Neurosphere passaging was performed approximately every 14 days using a McIlwain automated tissue chopper (Mickle Engineering, Surrey, UK) (52).
Transient Ferritin Expression
Transient ferritin expression in hNPCs (hNPCsTrans-Fer) was achieved using the Lonza Nucleofection System (Lonza Group Ltd., Basel, Switzerland), per the manufacturer's protocol. Ferritin cDNA, pUMVO-Ferritin Chimera (gift from Celsense Inc., Pittsburgh, PA, USA), was under the control of the cytomegalovirus promoter and contained both L- and H-ferritin genes linked by a FLAG epitope tag. Briefly, hNPCs were dissociated using a trypsin solution (TrypLE; Life Technologies), and 5 × 10⁶ cells were resuspended in 100 μl Basic Nucleofection Solution Primary Neurons (Kit VPI-1003; Lonza) with 4 μg of pUMVO-Ferritin chimeric DNA. The cells were pulsed using the C-30 program and directly transferred into maintenance medium.
For in vitro analysis, 3.0 × 10⁴ hNPCsTrans-Fer were plated onto glass coverslips precoated with poly-ornathine (0.1 mg/ml; Sigma-Aldrich) and poly-l-laminin (50 μg/ml; Sigma-Aldrich) to promote adherence. In vitro ferritin expression was analyzed 24 to 48 h following cell plating by L-ferritin (mouse monoclonal, 1:500; Santa Cruz Biotechnology, Inc., Dallas, TX, USA) immunostaining or MRI (4.7 T small animal scanner; Agilent Technologies, Santa Clara, CA, USA). For in vivo use, 3 × 10⁶ hNPCsTrans-Fer were grown in suspension in a six-well plate precoated with polyhydroxyethylmethacrylate (p-HEMA, 12 mg/ml; Sigma-Aldrich) to reduce cell adherence for easier collection prior to transplantation. In vivo ferritin expression was analyzed 72 h and beyond following cell transplantation using MRI.
Stable Ferritin Expression
Ferritin genes were amplified by polymerase chain reaction using 10× High Fidelity buffer, 2.5 mM dNTP mix, 50 mM MgSO4, platinum Taq DNA polymerase High Fidelity (all Life Technologies), and a primer mix containing the 10-μM forward primer (5′-CAAGAGTGACGTAAGTAC CGCCTA-3′, contains BamHI restriction site) and 10 μM reverse primer (5′-AGATCTCTCGAGCTTATTAGCTTT C-3′, contains XhoI restriction site) from pUMVO-Ferritin Chimera. The cycle parameters were 95°C for 3 min once, 30 repetitions of 95°C for 30 s, 57°C for 30 s, and 72°C for 90 s, and 72°C for 10 min once. The ferritin genes were ligated into the self-activating lentiviral vector with posttranscriptional cis-acting regulatory element of woodchuck hepatitis virus and mouse phosphoglycerate kinase 1 promoter (SIN-W-PGK) shuttle vector (10). Subsequently, the lentivirus was produced using the Ferritin-SIN-W-PGK shuttle vector and then used to infect hNPC as described previously (10). Briefly, hNPCs were dissociated with TrypLE and incubated overnight with the ferritin lentivirus at a titer of 100 ng/24 million cells in half of the normal maintenance medium volume. The next day, the medium was doubled and half of it replaced twice per week thereafter, while the newly infected cells (hNPCsFer) reformed spheres. In addition, hNPCsWT were infected with a Luc2 lentivirus (gift from Promega Corp., Madison, WI, USA) to produce a control cell line stably expressing luciferase, termed hNPCLuc2.
Immunocytochemistry
Immunocytochemistry was used to confirm increased ferritin expression by hNPCsFer compared to hNPCsWT following transfection and lentiviral infection and to assess cell differentiation. Cells plated on coverslips were fixed using 4% paraformaldehyde (PFA; Electron Microscopy Sciences, Hatfield, PA, USA) for 20 min and rinsed in phosphate-buffered saline (PBS; Thermo Fisher Scientific, Inc., Waltham, MA, USA). Cells were blocked in PBS with 5% normal donkey serum (NDS; Chemicon International Inc., Billerica, MA, USA) and Triton X-100 (Sigma-Aldrich) for 30 min. The cells were stained using primary antibody against human L-ferritin (mouse or rat monoclonal, 1:500; Santa Cruz Biotechnology), βIII-tubulin (mouse monoclonal, 1:1,000; Sigma-Aldrich), or glial fibrillary acidic protein (GFAP; rabbit polyclonal, 1:1,000; Dako, Carpinteria, CA, USA) for 1 h at room temperature (RT). Subsequently, cells were washed in PBS, incubated for 30 min with the secondary antibody, donkey anti-mouse or donkey anti-rat Alexa Fluor 488 (AF-488)-conjugated (1:500; Jackson Laboratory, Bar Harbor, ME, USA) for L-ferritin staining, donkey anti-mouse and donkey anti-rabbit Cyanin-3 (Cy3)-conjugated (1:500; Jackson Lab) for βIII-tubulin and GFAP staining, respectively, washed in PBS and labeled for 3 min with the Hoechst 33258 nuclear stain (0.5 μg/ml; Sigma-Aldrich). Images were acquired with the Nikon Intensilight C-HGFI camera and Nikon Eclipse 80i fluorescent microscope (Tokyo, Japan). Fluorescence quantification was done using NIS Element D Software by counting the ratio of immuno stained cells to Hoescht-positive nuclei in three to six independent fields from at least three coverslips.
BrdU Labeling
Determining cell proliferation rates was done by pulse labeling hNPCsWT and hNPCsFer with bromodeoxyuridine (BrdU), as previously described (50,58). Briefly, the cells were incubated with BrdU (0.2 μM; Sigma-Aldrich) for 16 h, dissociated into single-cell suspensions using TrypLE, and plated as monolayers on glass coverslips coated with poly-ornathine and poly-l-laminin. The cells were allowed to attach for 2 h in maintenance medium and then fixed with 4% PFA for 20 min. Fixed cells were then immunostained by incubating with 2 N HCl (Thermo Fisher) in PBS for 20 min at 37°C, then quenched with 0.1 M sodium borate buffer (pH 8.5; Thermo Fisher) for 10 min at RT. Cells were blocked in PBS with 5% NDS and Triton X-100 for 30 min, incubated with primary antibody against BrdU (monocolonal rat, 1:500; Accurate Chemical, Westbury, NY, USA) for 1 h at RT and then overnight at 4°C, followed by PBS washes, a 30-min incubation with Cy3-conjugated donkey anti-rat secondary antibody (1:500) and a 3-min Hoechst 33258 nuclear labeling. For double labeling, L-ferritin antibody staining was completed prior to commencing the BrdU stain.
Western Blot
For Western blot, hNPCsFer, hNPCsWT, and hNPCsWT incubated with 200 μM ferric ammonium citrate (FAC; Sigma-Aldrich) overnight, were washed in PBS, resuspended in JLB buffer [50 mM Tris-HCl, pH 9 (Sigma-Aldrich), 150 mM NaCl (Sigma-Aldrich), 10% glycerol (Sigma Aldrich), 0.1% PIC (Roche, Basel, Switzerland), 20 mM NaH2(PO)4(Sigma-Aldrich), 25 mM NaF (Sigma-Aldrich), 2 mM EDTA (Bio-Rad Laboratories, Inc., Hercules, CA, USA), 1% Triton X-100 (Sigma-Aldrich)] and sonicated. Protein concentrations were determined using Bradford assay (Bio-Rad) according to manufacturer's directions. Protein (50 μg) was loaded into Mini-PROTEAN® TGX Precast gels (Bio-Rad), separated with 90 V for approximately 1.5 h, electrotransferred onto PVDF membrane (Bio-Rad Turbo transfer) in a semidry transfer system for 7 min at 1.3 A. The membrane was blocked in 6% dry nonfat milk (Kroger, Cincinnati, OH, USA) in Tris-buffered saline (Sigma-Aldrich) plus 0.1% Tween 20 (Sigma-Aldrich) for 1 h at RT and then exposed to primary antibody against human L-ferritin (1:1,000, mouse), human H-ferritin (1:1,000, rabbit monoclonal; Epitomics – an Abcam Company, Burlingame, CA, USA), and β-actin (1:500, rabbit; Sigma-Aldrich) to ensure equal protein loading in block for 1.5 h at RT. Anti-mouse and anti-rabbit secondary antibodies conjugated to peroxidase (1:10,000; Jackson Labs) were applied in block for 1 h at RT, followed by exposure with a chemiluminescence kit (Super Signal West Femto Maximum Sensitivity Substrate; Thermo Fisher).
In Vitro Imaging
Prior to in vitro imaging, ferritin-expressing hNPCs and hNPCsWT, as negative controls, were dissociated into single cells using TrypLE and incubated overnight with different concentrations of FAC (0, 2, 20, or 200 μM). Incubating hNPCs with FAC is needed as the maintenance medium does not contain sufficient amount of iron necessary for MR detection. As positive controls, hNPCs incubated overnight with 30 μg/ml of SPIO (FeREX; BioPAL, Inc., Worcester, MA, USA) were used and termed hNPCs-SPIO. The following day, all cells were thoroughly washed of the iron particle-containing medium, and 1 × 10⁶ cells were delivered as cell pellets in 10 ml of 1% agarose (Bio-Rad) in DMEM approximately at the 8-ml mark in 15-ml conical centrifuge tubes (Thermo Scientific). The cells were scanned in the MRI using a gradient echo sequence with the following parameters: repetition time (TR)/echo time (TE) = 500/12 ms, flip angle = 20°, matrix size = 128 × 128 or 256 × 256, field of view (FOV) = 40 × 40 mm, and 20–30 contiguous 0.5-mm slices. In order to generate R2* and T2* (T2* = 1/R2*) map data, images were collected at eight echo times with TE spacing = 3.93 ms (ranging from approximately 3 to 31 ms), while the rest of the imaging parameters remained constant.
Animals
Sprague–Dawley adult female rats, obtained from Taconic (Hudson, NY, USA), were housed under controlled temperature and illumination with unlimited access to laboratory chow and water. The National Institutes of Health and appropriate University of Wisconsin-Madison Institutional Animal Care and Use Committee guidelines were followed for all animal studies.
Animals received daily intraperitoneal (IP) cyclosporine injections (10 mg/kg, Sandimmune; Novartis, Basel, Switzerland) to reduce an immune response against the xenograft starting 1 day before transplantation. For one animal group assessing graft rejection, cyclosporine administration was stopped 3 weeks following transplantation.
After the final imaging time point, rats were anesthetized using isoflurane (Piramal Healthcare, Mumbai, India) and transcardially perfused with chilled 0.9% NaCl, followed by 4% PFA. Brains were removed, post-fixed overnight in 4% PFA, and cryopreserved in 30% sucrose (Thermo Fisher) for 48 h. A sliding microtome (Leica Microsystems, Bannockburn, IL, USA) was used to section brains at 30- to 40-μm-thick slices.
Striatal Transplantation
Isoflurane-anesthetized rats were injected bilaterally in two striatal sites (AP +0.5 mm and −0.1 mm; ML ±3.3 mm and ±2.8 mm; DV −4.5 mm) with approximately 3.0 × 10⁵ cells per injection using a 30-gauge sharp tip needle connected to a 10-μl Hamilton syringe (Hamilton Company, Reno, NV, USA) secured by a stereotaxic frame (David Kopf Instruments, Tujunga, CA, USA). Transplants were done by slowly lowering the needle, leaving it in place for 2 min before cell or medium injections at a rate of 1 μl/min for 2 min using a pump, leaving the needle in place for 2 min and slowly lifting it out. This process was repeated for the second transplantation site, and sometimes third for hNPCsLuc2, with the total transplanted number of cells ranging between 5.0 × 10⁵ and 9.0 × 10⁵. This order of magnitude cell numbers and this immunosuppression regimen has consistently provided good cell engraftment and survival (4,6,42,51). Following the surgical procedure, animals were monitored for recovery and returned to a clean home cage.
Cell Preparation
For striatal transplants, all protocols were performed in accordance with University of Wisconsin-Madison Institutional Review Board's guidelines (protocol G00623). hNPCs maintained as spheres were dissociated into single cells using TrypLE and resuspended at a density of 1.5 × 10⁵ cells/μl in Leibowitz transplantation medium (L 15 Leibowitz; Life Technologies)/0.6% glucose (D-(+)-Glucose; Sigma-Aldrich) in PBS (1:1) and B27 (2% v/v). hNPCsTrans-Fer were transplanted 2 days following transfections (N = 3), while stably expressing hNPCsFer were transplanted more than 4 months after lentiviral infection (N = 6). Along with ferritin-expressing cells, hNPCsWT incubated with low (N = 1), medium (N = 4), or high (N = 1) SPIO concentrations (3, 30, or 300 μg/ml) were transplanted as positive controls. Additionally, needle insertions (N = 3) or injections with transplantation medium (N = 3), hNPCsLuc2 (N = 3), hNPCsWT (N = 3), or dead hNPCs (including dead hNPCFer, hNPCLuc2, and hNPCs-SPIO, N = 3 for each group) were used as negative controls. Following at least 10 freeze–thaws, dead hNPCs were defined by less than 5% survival confirmed by trypan blue (Sigma-Aldrich) exclusion.
In Vivo MRI
Animals transplanted with hNPCsTrans-Fer and hNPCs-SPIO as controls were scanned using MRI 3 days following transplantation, while those used for sham injections or transplantation of stably expressing ferritin hNPCs or bilaterally with hNPCs-SPIO were imaged for the first time 7 days following transplantation. Animals imaged long term were scanned every other week thereafter for up to 13 weeks. For imaging, rats were anesthetized in a holding chamber with 4% isoflurane in compressed air then moved into the scanner where they were maintained on 1.5–3.0% isoflurane. Animal respiration and temperature were continually monitored during imaging (Small Animal Instruments, Inc., Stony Brook, NY, USA). In the 4.7-T scanner, a gradient echo sequence with the following parameters was used to image all of the animals at all of the imaging time points: TR/TE = 500/12 ms, flip angle = 20°, matrix size = 256 × 256 or 128 × 128, FOV = 40 × 40 mm and 10–15 contiguous slices between 0.36 and 0.5 mm thickness. In order to generate T2* map data, images were acquired using eight echo times with TE spacing = 3.93 ms (ranging from approximately 3 to 31 ms), while the rest of the imaging parameters remained constant.
In Vivo Bioluminescence Imaging
To monitor cell survival in vivo, animals transplanted with hNPCsLuc2 were imaged using In Vivo Imaging System (IVIS). Imaging was done 1, 3, 5, and 9 weeks posttransplantation using previously described methods (6). Briefly, animals were anesthetized in a holding chamber using 4% isoflurane in compressed air before being injected with luciferin (VivoGlo™, 150 mg/kg, IP). After 15 min, the animals were placed in the scanner, maintained on 2–3.5% isoflurane, and scanned using bioluminescence protocol with open emission, 60-s exposure and 3.0-cm camera height.
Immunohistochemistry
Brain sections were fluorescently stained against human nuclear marker against Ku80 antigen (hNuc, mouse, 1:200; Stem Cells Inc., Newark, CA, USA) to detect transplanted hNPCs. The sections were blocked with 3% NDS, 0.3% Triton X-100 in PBS for 1 h, then incubated with the primary antibody overnight at RT. Following washes, sections were incubated in AF-488 conjugated-donkey anti-mouse secondary antibody (1:500) for 1 h. The sections were then washed, mounted, and covered by glass slides using DAPI mounting medium (Vectashield Hard Set, Mounting Medium with DAPI; Vector Labs, Burlingame, CA, USA).
In addition, hNuc, human cytoplasmic marker (hCyto, mouse, 1:200; Stem Cells Inc.), L-ferritin (mouse, 1:500; Santa Cruz Biotechnology), and H-ferritin (1:500, rabbit; Epitomics – an Abcam Company, with premounted sections) staining was done by rinsing the brain sections with Tris-HCl, followed by incubation in 2 N HCl for 30 min at 37°C and a quench in 10% methanol (Thermo Fisher) and 3% H2O2 (Thermo Fisher). The sections were then blocked in 10% normal horse serum (Thermo Fisher) for 1 h prior to an overnight incubation with primary antibody at RT. Biotinylated mouse or rabbit secondary antibody (1:200; Vector Labs and Promega, Madison, WI, USA, respectively) was used for 1 h at RT, prior to 1 h avidin–biotin complex (ABC, Vectastain kit; Vector Labs) exposure at RT, and 3,3′-diaminobenzidine (DAB; Sigma-Aldrich) development and mounting on slides.
Prussian blue, or modified Perls' DAB protocol, was done by incubating the brain sections in 4% K4Fe(CN)6 (Sigma-Aldrich) and 4% HCl (1:1) for 1 h at RT and then washing. This was followed by a 20-min incubation in unactivated DAB consisting of 20 mg/ml DAB and NiCl2 (Sigma-Aldrich) in PBS and a 20-min incubation in activated DAB (unactivated DAB solution along with 30% H2O2) prior to mounting on slides. Prussian blue images were taken with a black and white camera (Nikon Intensilight C-HGFI camera, previously mentioned), and thus the Prussian blue staining appears black.
Using hCyto staining, a histology schematic was generated to evaluate graft locations in the brain. Furthermore, graft sizes were assessed on the scale of 0 to 4 in order to compare with MRI-based regions of interest (ROIs). Instances of no histologically detectable cell signal was termed “0,” any area between 0 and 0.19 mm2 was termed “1,” histological areas between 0.2 and 0.69 mm2 were termed “2,” areas between 0.7 and 1 mm2 were termed “3,” and finally areas greater than 1 mm2 were termed “4.”
Magnetic Resonance Image Analysis
In order to determine the relative differences in contrast between various conditions in vitro and in vivo, such as hNPCsFer, hNPCsLuc2, hNPCs-SPIO, a semiquantitative analysis was performed comparing total areas with decreased T2*. Multiple gradient echo images at different echo times were used to generate T2* maps by linear fitting of the logarithm of each voxel's signal versus echo time. The T2* value was given as the one divided by the negative of the slope. Voxels with signal less than five times the background standard deviation were excluded from fitting. ROIs were drawn surrounding the areas of obvious T2* decrease in the striatum only. The cortex was excluded from this analysis as most of the T2* inconsistencies in this region were a result of surgical artifacts and did not correlate with histological cell signal. In each case, the ROI areas were summed throughout the 10 slices (0.5-mm thick) to calculate the total volume of decreased T2*. At least three animals in each group were analyzed in this way to reach statistical significance. For in vitro images, ROIs were drawn surrounding regions with decreased T2* in each slice, and the areas were summed throughout all of the slices (0.5 mm thick).
Using brain magnitude images, a hypointense MR signal schematic was generated to compare with histologically determined graft locations. Furthermore, hypo-intense ROIs produced by hNPCFer were assessed on a scale of 0 to 4 in order to compare with histologically established graft sizes. Instances of no detectable ROI were termed “0,” any ROI greater than 0 and less than 0.19 mm2 was termed “1,” ROIs with area between 0.2 and 0.39 mm2 were termed “2,” ROIs with area between 0.4 and 0.99 mm2 were termed “3,” and finally, any ROI with area greater than 1 mm2 was termed “4.”
Statistical Analysis
An unpaired two-tailed Student's t-test with Bonferroni correction was used to compare ferritin expression data following nucleofection and lentiviral infection between various time points. Additionally, an unpaired two-tailed Student's t-test was used to compare the rates of proliferation and differentiation between hNPCsWT and hNPCsFer. One-way analysis of variance (ANOVA) with Bonferroni correction was used to compare areas of regions with decreased T2* values in animals as a response to cell or sham injections. Pearson product-moment correlation analysis (Pearson's r) was used to establish a relationship between relative hNPCsFer graft sizes and respective MRI hypointense ROI. Data are shown as mean ± standard error of the mean (SEM). Values of p < 0.05 were considered statistically significant.
Results
hNPCs can Transiently Express Ferritin for In Vitro Detection by MRI
Using nucleofection, which employs both electroporation and lipofection to achieve the highest cDNA uptake with minimal cell death, we transiently overexpressed ferritin in hNPCs in an attempt to provide MRI-based cell detection. Immunocytochemical analysis with L-ferritin antibody showed robust levels of ferritin expression in hNPCs 2 days following transfection (Fig. 1A). Next, hNPCsTrans-Fer cultures were incubated overnight with FAC at 0, 2, 20, and 200 μM (medium does not contain significant amounts of iron), and hNPCs treated with SPIO were used as a positive control. The FAC concentrations were chosen as the lower end of this range was found to be physiologically relevant in the striatum (39). T2* map semiquantitative analysis showed that hNPCs-SPIO gave rise to the largest area of decreased T2* indicating the highest iron concentrations, followed by hNPCsTrans-Fer and then WT controls (Fig. 1B). To check whether this method of transfection would be sufficient for long-term in vivo tracking, ferritin expression was monitored for 10 days following transient transfection. This assessment revealed that episomal expression of ferritin gradually reduced over time, presumably due to cell division (Fig. 1C). Therefore, while transient transfection yields robust ferritin expression by hNPCs that can be detected in vitro, an alternative method is required for long-term gene expression.

Transient ferritin expression in human neural progenitor cells (hNPCsTrans-Fer). (A) Immunostained hNPCsTrans-Fer showing robust transient expression of ferritin. (B) In vitro R2* maps of hNPCsTrans-Fer incubated with 0, 2, 20, and 200 μM ferric ammonium citrate (FAC), compared with wild-type hNPCs (hNPCsWT) incubated with 2, 20, and 200 μM FAC and hNPCs incubated with superparamagnetic iron oxide nanoparticles (hNPCs-SPIO). R2* instead of T2* maps shown for easier visualization. (C) Quantification of immunocytochemical analysis determines the percent of hNPCsTrans-Fer (between days 1 and 10, p < 0.0001).
Lentiviral Infection Provides hNPCs with Long-Term Ferritin Expression
Lentiviral infection has been used by our group to stably express a variety of proteins at high levels for prolonged periods of time (4–6,10,49). Thus, we used this method to establish an hNPC line stably expressing ferritin (hNPCsFer) (Fig. 2). Lentiviral constructs were generated by cloning the ferritin cDNA (gift from Celsense Inc.) into the shuttle vector under the control of a mouse PGK promoter (Fig. 2A). hNPCsWT were then infected with the ferritin lentivirus to produce either the hNPCFer cell line or with a luciferase lentivirus to produce the hNPCLuc2 cell line as an additional negative control. Immunostaining done more than 3 months after infection confirmed stable ferritin expression in the hNPCFer line, but not in the hNPCWT and hNPCLuc2 lines. Quantification of ferritin immunostaining over 10 days initially suggested that approximately 20% of total hNPCsFer stably expressed ferritin (Fig. 2B); however, later infections of hNPCsWT revealed higher protein expression with 56% ± 1.7 (mean ± SEM) of total hNPCsFer stably expressing ferritin (data not shown). Western blot analysis performed more than 4 months following infection confirmed stable L- and H-ferritin expression by hNPCsFer, but not by hNPCsWT, while hNPCsWT incubated with 200 μM FAC demonstrated expression of H-ferritin only (Fig. 2C). Together these results show that hNPCs can be genetically modified to stably express the ferritin reporter protein for several months of expansion.

Stable ferritin expression in hNPCs (hNPCsFer). (A) Schematic of lentiviral construct consisting of the following: long terminal repeat (LTR), the central polypurine tract (cPPT), the mouse phosphoglycerate kinase 1 promoter (PGK), light (L-) ferritin gene, FLAG epitope tag, heavy (H-) ferritin gene, the posttranscriptional regulatory element of woodchuck hepatitis virus (WPRE), and self-inactivating (SIN). (B) Percentage of hNPCs stably expressing ferritin more than 7 months postinfection. (C) Western blot of hNPCsFer, hNPCsWT, and hNPCsWT incubated with 200 μM FAC lysates stained against H- and L-ferritin. (D) Comparison of hNPCsFer and hNPCsWT in their capacity to proliferate (BrdU marker) and differentiate (GFAP and βIII tubulin markers). (E) In vitro R2* maps of hNPCsFer incubated with 0, 2, 20, and 200 μM FAC, compared with hNPCsWT incubated with 2, 20, and 200 μM FAC and hNPCs-SPIO. R2* instead of T2* maps shown for easier visualization. (F) In vivo detection of luciferase-expressing hNPCs (hNPCsLuc2, green box) and hNPCsFer (red box) in the rat striatum 1 week following transplantation. (G) Human cytoplasmic (hCyto) marker and (H) Prussian blue staining in the region of hNPCsLuc2 transplantation. (I) hCyto staining and (J) Prussian blue staining in the region of hNPCFer transplantation. Data are given as mean ± SEM. MRI scale bars: 1 mm. Histological scale bars: 50 μm.
We have previously shown that hNPCs can stably overexpress reporter proteins without affecting their proliferation rates and differentiation capabilities (6). To establish whether ferritin overexpression changed cell proliferation rates compared to hNPCsWT, both cell groups were labeled by pulsing with BrdU, a synthetic nucleotide that incorporates into the DNA of replicating cells, plated as single cells and subsequently immunostained against BrdU to detect newly dividing cells. Both hNPCFer and hNPCWT cell lines showed approximately 10% positive staining for BrdU, indicating that stable ferritin expression does not significantly alter hNPC proliferation (Fig. 2D). Our previous studies have shown that hNPCs differentiate mainly into astrocytes (approximately 40%) and some neurons (approximately 10%) (52). To compare differentiation capacity following stable ferritin expression, dissociated hNPCsFer and hNPCsWT were plated for 14 days without growth factor supplementation, to promote differentiation. Immunostaining results showed that both hNPCFer and hNPCWT cell lines differentiated into approximately 60% GFAP-expressing astrocytes and less than 10% βIII tubulin-expressing neurons, with the remaining cells presumably continuing to be undifferentiated progenitors (Fig. 2D). Upon confirming that lentiviral infection and stable reporter protein expression did not overtly affect cellular biology we next initiated in vivo analysis of hNPCsFer.
hNPCsFer can be Detected by MRI In Vitro and In Vivo
To show that hNPCs stably expressing ferritin can be successfully visualized in vitro, a similar method was used as described for transiently expressing cells, in which hNPCsFer and hNPCsWT, as a negative control, were incubated with FAC, while hNPCs-SPIO served as a positive control. T2* maps for hNPCsFer and hNPCs-SPIO cells showed a clear T2* decrease, suggesting iron uptake (Fig. 2E). For in vivo validation of ferritin-induced cellular contrast, hNPCsFer were injected into the rat striatum, and hNPCsLuc2 were injected contralaterally as a negative control. Imaging using gradient echo MR sequence showed a clear contrast corresponding to hNPCFer transplant. An unexpected contrast associated with the hNPCLuc2 transplant was also seen (Fig. 2F), which is further described below. Postmortem histology using hCyto marker confirmed the presence of both hNPCsLuc2 (Fig. 2G) and hNPCsFer (Fig. 2I). Furthermore, Prussian blue staining revealed iron accumulation surrounding the grafted hNPCsLuc2 (Fig. 2H) and hNPCsFer (Fig. 2J). Overall, these data suggested that hNPCsFer could be observed in vitro and in vivo.
Needle Insertions, Media, and hNPCLuc2 Transplants Induce Hypointense MRI Signal In Vivo
It appeared that hNPCsFer induced increased MRI-detected hypointensity following transplantation; however, it was puzzling that this also occurred with hNPCLuc2 transplants. To address this, we assessed whether media injection, needle insertion, and hNPCsLuc2, transplanted as negative controls, resulted in hypointense MRI signal. Animals received a unilateral striatal injection of media and a contralateral needle insertion. While both of these control injections resulted in hypointensity from the needle tracks (vertical lines), they appeared qualitatively different from cell injections as there were no cell-specific, circular hypointense regions below the needle tracks (Fig. 3A, B). Next, animals received unilateral striatal transplants of hNPCsLuc2 and contralateral transplants of the same number of hNPCsFer. The results again showed that hNPCsLuc2 produced hypointense signal that could not be distinguished from hNPCsFer signal (Fig. 3C). Following in vivo imaging, histology verified iron accumulation surrounding the graft (Prussian blue staining), cell survival (hNuc expression), and expression of both L- and H-chain ferritin on the side transplanted with hNPCsFer (Fig. 3D–G) and the side transplanted with hNPCsLuc2 (Fig. 3H). L- and H-chain ferritin immunostaining was also positive with antibodies targeted to human-specific ferritin, suggesting that hNPCsLuc2 were also overexpressing the protein (Fig. 3I–K). Altogether, these studies demonstrate that hNPCsFer, hNPCsLuc2, and sham controls all induced hypointense signal following transplantation, although hypointense signal in sham controls qualitatively differed from that induced by hNPCs.

Analysis of ferritin-based hNPC tracking using MRI. (A) In vivo detection of needle insertion-induced hypointense signal in the right cortex and striatum at 1 week after treatment (yellow arrowhead). (B) In vivo detection of media injection-induced hypointense signal in the left cortex and striatum at 1 week following transplantation (yellow arrowhead). (C) In vivo detection of hNPCsFer (red box) and hNPCsLuc2 (green box) induced hypointense signal at end point (11 weeks after transplantation). (D) Prussian blue, (E) human nuclear (hNuc) marker, (F) L-ferritin, and (G) H-ferritin staining from chronological sections within the hNPCFer transplant region. (H) Prussian blue, (I) hNuc, (J) L-ferritin, and (K) H-ferritin staining from chronological sections within the hNPCLuc2 transplant region. (L) Schematics comparing hCyto-based histologically stained cell locations (left) and corresponding MRI hypointense signal (right). The same outline color depicts the histological and MRI hypointense signal in the same animal. MRI acquired at end point (week 11). hNPCFer signal shown in the left hemisphere of each schematic and hNPCLuc2 signal shown in the right hemisphere of each schematic. All fluorescence immunostaining images were acquired with the same exposure times. MRI scale bars: 1 mm. Histological scale bars: 50 μm.
After determining that both hNPCsFer and hNPCsLuc2 produced similar contrast in vivo, we asked whether hypointense ROIs seen with live imaging corresponded to cellular location determined with postmortem histology. To determine this, we generated a schematic for each animal's hypointense MR-based ROI signal and histologically assessed graft location. Both hNPCFer and hNPCLuc2 MR signals matched closely with their histological locations, suggesting that MRI could indicate cellular location in vivo regardless of whether cells were genetically modified to overexpress ferritin (Fig. 3L). However, in most instances, MR ROIs were notably smaller compared to histological grafts, suggesting that partial volume effects contributed to decreased sensitivity at the edges of the transplant where cell density drops off. Overall, these results indicated that while hNPCsFer did not seem to provide an increased hypointensity compared to hNPCsLuc2, both cell types were capable of inducing specific MRI contrast that was significantly different from noncellular negative controls, needle injections, or media transplants.
SPIO Incubation Enhances hNPC Visualization In Vivo
As MR signal appeared smaller than actual cellular grafts, we next explored whether SPIO cell labeling could increase cell-induced MR contrast. hNPCs incubated with different concentrations of SPIO (3, 30, and 300 μg/ml) were transplanted in the rat striatum, and nonincubated hNPCs were transplanted contralaterally. Results showed that even at low concentrations, SPIO incubation provided increased hypointensity, with increased ROI size at higher concentrations of the contrast agent, likely due to increased effect of blooming (Fig. 4A–C). The fact that SPIO incubation of hNPCs showed increased contrast compared to other methods provides opportunities to detect low cell numbers.

Analysis of iron-based hNPC tracking using MRI. In vivo detection of hNPCs incubated with (A) low (3 μg/ml), (B) medium (30 μg/ml), and (C) high (300 μg/ml) concentrations of SPIO at 1 week posttransplantation (yellow arrowheads). (D) Semiquantitative assessment of total areas of decreased T2* induced by various transplants 1 week following transplantation. Areas of decreased T2* and the number of animals for each condition: needle insertion (decreased T2*area = 85.33 ± 97.08; N = 3), media injection (decreased T2*area = 37.67 ± 7.64; N = 3), hNPCsWT (decreased T2*area = 134.33 ± 25.50; N = 3), hNPCsLuc2 (decreased T2*area = 168.67 ± 55.65; N = 3), hNPCsFer (decreased T2*area = 79.17 ± 77.46; N = 6), and hNPCs-SPIO (decreased T2*area = 1,091.67 ± 277.71; N = 3). Asterisk indicates significant difference compared to the rest of the conditions calculated using one-way ANOVA with Bonferroni correction. Individual p values comparing areas of decreased T2* between hNPCs-SPIO and the rest of the conditions are as follows: needle insertion (p = 0.0041), media injection (p = 0.0028), hNPCsWT (p = 0.0040), hNPCsLuc2 (p = 0.0049), and hNPCsFer (p < 0.0001). There was no significant difference between any of the other conditions. (E) Semiquantitative analysis of hNPCFer graft size and corresponding MR hypointensity ROI sizes in 14 animals through Pearson correlation (Pearson's r = 0.1782). Data are given as mean ± SEM. MRI scale bars: 1 mm.
To build upon these qualitative findings, we analyzed the grafts in two semiquantitative ways. First, we compared the areas of hypointense MRI signal following various transplantation conditions (needle insertion, transplantation media, hNPCWT, hNPCLuc2, hNPCFer, and hNPC-SPIO transplants). The results revealed that the total area of decreased T2* signal was significantly greater with hNPC-SPIO transplants compared to all other conditions. The T2* signal difference was not significantly different between the rest of the conditions (Fig. 4D). It is important to note, however, that while the total area of decreased T2* did not vary significantly between cellular and sham transplants, sham injections appeared as needle tracks or straight lines through the cortex and striatum, whereas cell injections resulted in circular ROIs in the striatum. Second, we compared the histological hNPCFer graft sizes with the same animals' MRI hypointense ROIs to establish whether MR images were suggestive of graft sizes. Analysis of 14 animals revealed that there was no significance in the correlation (Pearson r = 0.1782) between the sizes of MR hypointense ROI and histologically assessed hNPCFer graft sizes, which corresponded to surviving cells (Fig. 4E). Altogether, only hNPCs-SPIO significantly increased the ROI areas with semiquantitative analysis, although some of the other conditions may still be qualitatively distinguished. Furthermore, MRI hypointensity areas are not suggestive of graft sizes.
Signal Hypointensity Is Similar for Live and Dead Cells
While our data indicated that it may be possible to track hNPCs without genetic manipulation using MRI, it was still undetermined whether this contrast disappeared following cell death—an important consideration for long-term monitoring of graft survival. We performed two experiments to determine whether cell death caused a signal change that could be used to reliably assess in vivo cell viability with these MR-based methods. In the first study (Fig. 5), we transplanted hNPCsFer to be detected using MRI and contralaterally transplanted hNPCs expressing luciferase (hNPCLuc2) to be detected using bioluminescence imaging. Bioluminescence signal was used as a marker of cell survival, as we have previously shown that luciferase-expressing-hNPC death can be reliably identified by the loss of bioluminescence signal in vivo (6,36). Three weeks following transplantation, animals were withdrawn from the immunosuppression used to prevent host tissue rejection of xenograft hNPCs (4,9,49). hNPC death following immunosuppression withdrawal was reflected by bioluminescence signal loss at week 5 (2 weeks following immunosuppression withdrawal). This bioluminescence signal loss remained for the duration of the 9-week study (Fig. 5A). In stark contrast, hypointense MRI signal corresponding to both hNPCFer and hNPCLuc2 graft locations remained and actually increased from week 5 to week 9 (Fig. 5B). Graft rejection of both hNPCsFer and hNPCsLuc2 was confirmed by histological analysis showing loss of hNuc (Fig. 5C, F) and L-ferritin staining (Fig. 5D, G). Importantly, positive Prussian blue staining demonstrated ongoing iron accumulation, which would explain the MR signal remaining after cell death (Fig. 5E, H). As expected, control animals that remained on immunosuppression for the study duration had hypointense MR signal and showed positive immunostaining for hNuc, L-ferritin, and Prussian blue. This study revealed that MR signal corresponding to hNPCsFer and hNPCsLuc2 could not reliably identify cell death following graft rejection.
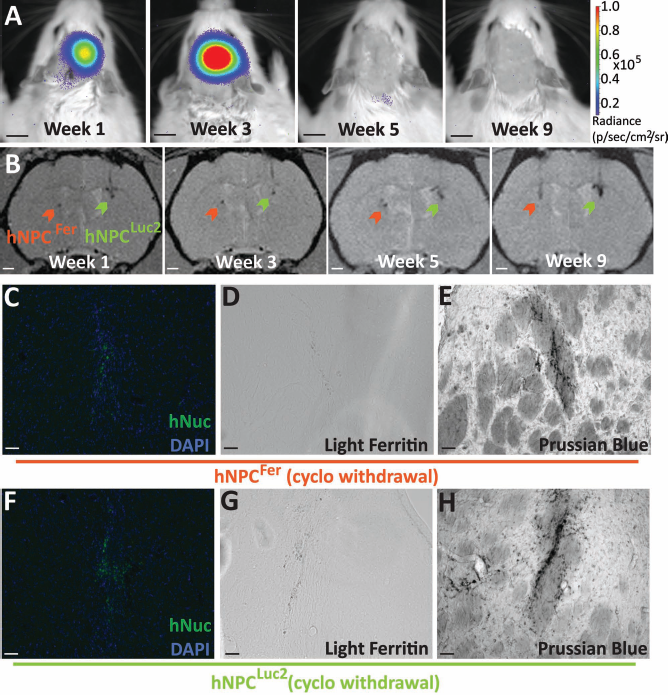
Detection of dead hNPCsFer. (A) In vivo imaging of hNPCsLuc2 using bioluminescence imager, In Vivo Imaging System (IVIS), 1, 3, 5, and 9 weeks following transplantation. Cyclosporine (cyclo) was withdrawn at week 3 and presumed cell death occurred at week 5. (B) In vivo MR imaging of hNPCsFer (red arrowhead) and hNPCsLuc2 (green arrowhead) in the same animal as in (A) 1, 3, 5, and 9 weeks after transplantation. Staining in the region of hNPCFer transplantation for (C) hNuc, (D) L-ferritin, and (E) Prussian blue. Staining in the region of hNPCLuc2 transplantation for (F) hNuc, (G) L-ferritin, and (H) Prussian blue. All fluorescence immunostaining images were acquired with the same exposure times. IVIS scale bars: 1 cm. MRI scale bars: 1 mm. Histological scale bars: 50 μm.
We next tested whether MRI detected SPIO-loaded dead cells (Fig. 6). For this experiment, we prelabeled hNPCsWT with SPIO followed by several freeze–thaws to reduce cell survival below 5% before transplantation into the rat striatum. Controls were live hNPCs-SPIO, hNPCsWT, and SPIO-incubated transplant media injections. MR images showed that dead hNPCs-SPIO produced a high signal contrast that could not be distinguished from that of live hNPCs-SPIO (Fig. 6A, D). Conversely, SPIO media did not induce hypointense contrast (Fig. 6D). Visible hNuc staining showed the survival of control hNPCs-SPIO, while a lack of hNuc staining suggested that freeze–thawed hNPCs-SPIO did not survive (Fig. 6B, E, respectively). It should be noted that one animal receiving freeze–thawed cells showed a slight accumulation of nonspecific hNuc antibody staining that was presumably due to some remaining human protein (Fig. 6E). Finally, positive Prussian blue staining demonstrated ongoing iron accumulation surrounding both live and dead SPIO-loaded grafts, which would explain the MR signal remaining after cell death (Fig. 4C, F). Overall, these data confirm that SPIO loading for cellular detection does not distinguish between live and dead hNPCs and, hence, cannot be used for verification of cell survival.

Detection of dead hNPCs-SPIO. (A) In vivo detection of live hNPCs-SPIO 1 week posttransplantation (green box). Staining in the region of live hNPCs-SPIO for (B) hNuc and (C) Prussian blue. (D) In vivo detection of SPIO-media (white arrowhead) and dead hNPCs-SPIO (red box) 1 week following transplantation. Staining in the region of dead hNPCs-SPIO for (E) hNuc and (F) Prussian blue. All fluorescence immunostaining images were acquired with the same exposure times. MRI scale bars: 1 mm. Histological scale bars: 50 μm.
Discussion
This study postulated that cells overexpressing ferritin would have the capacity to take up more iron compared to WT cells in order to provide better in vivo cell tracking using MRI. Our investigation showed that hNPCs can be induced to express ferritin transiently or stably, with no overt changes in cell proliferation or differentiation. While we found that hNPCs overexpressing ferritin could be detected in vivo in the rat striatum with MRI, we unexpectedly demonstrated that hNPCsWT without ferritin overexpression and hNPCs overexpressing a luciferase reporter protein showed similar in vivo detection. All three cell types showed circular hypointense regions, and this signal reliably matched the cell locations determined by histology with human-specific antibodies. In contrast, sham injections (needle insertion and media transplantation) induced a different hypointense signal that resembled needle tracks without the circular regions. SPIO incubation generated larger contrast areas compared to all non-SPIO cell types. Following cell death in vivo none of these cellular tracking techniques showed a decrease in hypointense signal, and hence these current cell tracking methods cannot be used to reveal graft rejection. These findings expose the need for approaching in vivo cellular tracking using alternate MRI-based strategies or perhaps multimodal imaging for future preclinical and clinical transplant studies that require longitudinal information on both cell location and survival.
Inducing Stable Expression of Ferritin
Our initial studies utilizing transient transfection confirmed that hNPCs could overexpress ferritin, which led to increased iron uptake used to demonstrate cell visualization in vitro using MRI. However, immunostaining showed that following transient transfection there was a significant decrease in ferritin overexpression to less than 5% by day 10 (Fig. 1C). As such, a method providing stable ferritin protein overexpression was necessary. Using lentiviral transduction, we generated a stable cell line with approximately 56% of hNPCs overexpressing ferritin for months (hNPCsFer). Certain techniques used to generate cells stably expressing a protein of interest, such as retroviral infection, may activate proto-oncogenes during gene insertion (48). Importantly, we showed that the proliferation rate and differentiation potential of lentiviral-infected hNPCFer was unchanged compared to WT counterparts (Fig. 2D). This cell line stably overexpressing ferritin was used for long-term MRI cell tracking studies.
In Vitro MR Imaging of Ferritin Overexpressing hNPC
It was important to ensure that ferritin overexpressing hNPC could be detected in vitro using MRI before performing in vivo studies. Following incubation of ferritin overexpressing cells with various concentrations of FAC, qualitative assessment suggested an increased uptake of iron by hNPCs transiently and stably overexpressing ferritin compared to hNPCsWT (Figs. 1B and 2E, respectively). Further semiquantitative analysis showed that in some cases 20 μM FAC induced the highest total area of hypointense signal compared to 0, 2, or 200 μM FAC. We speculate that cell survival was compromised at 200 μM FAC, resulting in some iron-mediated cellular damage and subsequent cell death, accounting for the slight decrease in total hypointense areas compared to the 20 μM FAC condition (Fig. 1B) (25).
It is important to note that FAC-incubated hNPCsWT also demonstrated iron uptake based on the analysis of hypointense signal, especially when exposed to 20 and 200 μM FAC. This was confirmed through Western blot analysis where hNPCsWT not exposed to FAC demonstrated no upregulation of either L- or H-ferritin, while FAC-incubated hNPCsWT showed overexpression of H-ferritin. H-ferritin is known for its feroxidase function in which the more toxic Fe2+ is converted to Fe3+, prohibiting the Fe2+ from participating in generation of dangerous hydroxyl radicals through the Fenton reaction (Fe2+ + H2O2 → Fe3+ + OH- + OH) (20,54). An intracellular iron concentration-dependent mechanism drives ferritin expression in vivo. In the conditions of low iron, the iron-responsive element (IRE) located in the 5′ untranslated region of H- and L-ferritin mRNA is bound by the iron regulatory proteins (IRPs) suppressing translation of Hand L-ferritin proteins. On the other hand, in conditions of iron abundance, such as following hNPCWT incubation with FAC, IRPs are degraded or converted to a form of the protein that cannot bind IRE, thus permitting translation of ferritin (54). Therefore, while in vitro MRI studies confirmed both qualitatively and semiquantitatively that there was an increase in FAC uptake by hNPCs overexpressing ferritin compared to hNPCsWT, there is still a degree of ferritin overexpression detected in hNPCsWT following iron incubation.
In Vivo MR Imaging of hNPCFer and Negative Controls
After stable ferritin overexpression and successful in vitro imaging were confirmed, hNPCFer was assessed for in vivo detection. MR imaging successfully detected ferritin-overexpressing hNPCs by a hypointense signal (Fig. 2F, right side) while unexpectedly detecting hNPCLuc2 transplants through a similar signal drop out as hNPCsFer (Fig. 2F, left side). Postmortem histological analysis with human-specific antibodies revealed survival of both hNPCsLuc2 and hNPCsFer (Fig. 2G, I) and Prussian blue-positive staining suggested iron accumulation (Fig. 2H, J). Hemorrhagic events due to surgical trauma are likely the cause of this iron accumulation seen with hNPCsLuc2. Capillary damage during surgery releases iron-rich blood that can infiltrate the needle tracks and enter the area of cellular accumulation (18). Subsequent sham control experiments confirmed this hypothesis, as needle insertion or transplantation media injections revealed hypointense MR signal corresponding to the needle tracks (Fig. 3A, B). Interestingly, the shape of these ROIs was linear through the cortex, corpus callosum, and into the striatum and looked different from cellular injections appearing as circular ROIs in the striatum. It is worth noting that in some instances cellular injections also resulted in hypointense needle tracks, although circular ROIs were always present in the striatum, differentiating these cellular signals from sham. In general, hNPCFer, hNPCLuc2, and sham injections all produced hypointense signal with in vivo imaging, although cellular transplants appeared qualitatively different.
Correlation of Histology and MR Signal
MR imaging was performed longitudinally in live animals with a final scan on the day of sacrifice, at which time postmortem histological analysis was performed. Cell survival, ferritin overexpression, and iron accumulation were confirmed by positive staining for hNuc, L- and H-ferritin, and Prussian blue (Fig. 3D–K). hNuc immunostaining consistently correlated to the ROI for MRI hypointense signal in the striatum (Fig. 3E, I, corresponding to Fig. 3C MRI). While cell signal and immunostaining colocalized, graft size consistently appeared smaller in MRI compared to histology (Fig. 3L). Furthermore, positive histological staining with human-derived L- and H-ferritin of both hNPCsFer and hNPCsLuc2 confirmed that ferritin became overexpressed due to iron exposure even in hNPCsLuc2 (Fig. 3F, G, J, and K). While only H-ferritin was slightly overexpressed as a result of in vitro FAC accumulation, both H- and L-ferritin were overexpressed in vivo posttransplantation. This discrepancy is likely explained by the time frame of iron exposure, where H-ferritin is overexpressed sooner in order to convert Fe3+ to Fe2+. On the other hand, L-ferritin, encoded by a separate gene on a different chromosome, is responsible for long-term storage of iron and thus becomes overexpressed later (54,57). FAC incubation in vitro lasted no longer than 24 h, which may not be long enough for a notable increase in L-ferritin expression. Conversely, the final MRI and corresponding histological analysis were generated 11 weeks following transplantation (Fig. 3C–K). This difference in exposure to iron is suspected as the cause of increase in both H- and L-ferritin expression in transplanted hNPCsLuc2. Altogether, our histological studies confirmed graft survival corresponding to the MRI signal for both hNPCsFer and hNPCsLuc2. Moreover, overexpression of both H- and L-ferritin was detected in all cell types, likely as a response to the iron accumulation confirmed through Prussian Blue staining.
In Vivo MR Imaging of hNPC-SPIO and Image Analysis
Transplanted hNPCs could be detected using MRI due to iron accumulation, but in order to explore whether SPIO labeling enhanced the hypointense signal, we next SPIO labeled hNPCs before transplantation into the rat striatum (13,56). Subsequent in vivo imaging revealed that SPIO labeling, even at low doses, could enhance hypointense contrast and thus may be applicable in instances requiring increased sensitivity (Fig. 4A–C). To graphically represent the qualitative assessments, a semiquantitative analysis was developed that compared total areas of decreased T2* in animals where total volume (10 slices, 0.5-mm thick) and imaging time point (day 7) were consistent. Of the conditions considered (needle insertion, media injection, hNPCWT, hNPCLuc2, hNPCFer, and hNPC-SPIO transplantation) only hNPC-SPIO transplantation resulted in significantly larger areas of T2* decrease compared to other conditions. The area of decreased T2* did not differ significantly between the remaining conditions. However, it is important to note that all images must also be qualitatively assessed and account for geometric differences in ROIs between cell and sham injections. Altogether, hNPC-SPIO transplants resulted in the largest total areas of hypointense signal and hence the most robust detection compared to the other conditions.
In Vivo MR Imaging of Dead hNPCs
While results demonstrate that hNPCs can be localized through MRI regardless of genetic modification to over-express ferritin or SPIO labeling, it was still unknown whether iron-based MRI techniques could be used to predict cell survival. We therefore assessed hNPCFer and hNPCLuc2 profiles following graft rejection and showed that MR contrast signal and Prussian blue staining revealing iron accumulation; both remained despite hNPC death (Fig. 5E, H). This result matches clinical data demonstrating persistent iron accumulation around surgery sites that elicited hypointense MR signal for months after surgery (19,32). This suggests that iron-based imaging of hNPCs cannot reliably distinguish live versus dead cells in vivo.
To determine if SPIO labeling can detect dead cells in vivo, we assessed striatal transplants of SPIO-labeled live and dead hNPCs. hNPCs-SPIO could be detected following transplantation, regardless of whether cells were alive or dead (Fig. 6A, D). This suggests that SPIO particles remain in the tissue even after cell death, and thus this method cannot reliably predict cell survival, as has been suggested (28). Interestingly, SPIO-loaded transplantation media did not result in increased hypointensity compared to other sham injections (Fig. 4D, left side), suggesting that SPIO nanoparticles can only induce sufficient contrast when incubated with hNPCs prior to transplantation (Fig. 4E). Overall, these studies provide evidence that iron-based MRI cannot be reliably used to determine cell survival since hypointense iron-based signal remains in vivo following cell death.
Novel Aspects of Current Study and Future Prospects
Throughout this study we have explored the utilization of iron-based MRI for tracking hNPCs. Until now, SPIO labeling has been the gold standard for tracking hNPCs in vivo (7,13,15,16,40). However, drawbacks with this technique include SPIO nanoparticle uptake by macrophages following cell death and biodegradation over time, prohibiting reliable long-term cell detection (1,28). To avoid some of these problems, we induced overexpression of ferritin, an iron storage protein, hypothesizing that increased capacity for iron storage would indeed increase the concentration of iron in the cells and thereby lead to increased MR hypointensity. A few studies have employed this platform for tracking eNSC migration through the RMS in vivo (26,55). While these studies tracked fewer cells, as approximately 5 × 10⁴ to 1 × 10⁵ eNSCs are located in the RMS at any given time, their signal was not confounded by surgery-induced hemorrhage. However, our study demonstrated that genetic modification of hNPCs to overexpress ferritin did not result in increased hypointense contrast compared to nonoverexpressing hNPCs, likely due to surgery-related hemorrhage. While hNPCLuc2 transplants resulted in increased hypointensity, which indeed revealed true cellular location, cell death could not be reliably determined from MRI. Furthermore, while detection of hNPCsLuc2 appeared dependent on hemorrhagic events, developing methods that are not iron based would be advantageous as iron accumulation remains in vivo for prolonged periods of time following hemorrhage. One such technique employs overexpression of divalent metal transporter 1 protein (DMT1), which facilitates the transport of metals such as iron and manganese into the cell (21). For cellular tracking, MnCl2 is delivered through intraperitoneal injections, transported into the cell by DMT1, and can be recognized using T1-weighted manganese-enhanced MRI (MEMRI) (3,33,60). The main advantage of this approach is the positive contrast of T1-weighted imaging, which is less sensitive to iron and thus hemorrhagic events. Another method that utilizes T1-weighted imaging involves cell tracking using gadolinium [Gd(III)] contrast agents. Generally, this approach involves prelabeling cells with Gd(III), carrying with it the drawbacks of direct labeling techniques previously discussed (38). Finally, iron-based MRI could be used for tracking stem cells if utilized in concert with another imaging modality, such as bioluminescence imaging in preclinical studies. As we have previously shown, hNPCLuc2 death can be estimated from bioluminescence imaging and thus could serve as a complementary technique to iron-based MRI, which provides information on cell anatomical location (6). Altogether, utilizing alternative methods, such as T1-weighted contrast agents for MRI detection or luciferase-based bioluminescence imaging, together with iron-based MRI is advantageous for tracking hNPCs since their signal is not confounded by iron accumulation posthemorrhage and thus could provide additional information regarding cell survival in vivo.
Conclusions
In conclusion, this study explored MRI-based hNPC tracking by ferritin overexpression. We found that while hNPCsFer can be detected in vivo following transplantation, they cannot be distinguished from hNPCsWT or hNPCsLuc2. Furthermore, hNPC survival could not be estimated using any of the iron-based MRI methods tested, ferritin overexpression, or SPIO loading. Thus, we propose that alternative methods be explored in order to allow for iron-independent cell detection.
Footnotes
Acknowledgments
We gratefully acknowledge Dr. Bernard Schneider (École Polytechnique Fédérale de Lausanne) for packaging the lentiviral construct. We would like to thank Debra Horng and Dr. Diego Hernando (University of Wisconsin-Madison) for their help with T2* relaxation analysis, as well as Dr. Soshana Svendsen and Dr. Genevieve Gowing (Board of Governors Regenerative Medicine Institute, Cedars-Sinai Medical Center, Los Angeles, CA, USA), for the help in preparing this manuscript. We would also like to thank Promega Corp., specifically Chad Zimprich, for providing the luciferase-containing plasmid. This work was supported by Celsense Inc. and grants from the University of Wisconsin-Madison Institute for Clinical and Translational Research and Stem Cell and Regenerative Medicine Center (M.S.), and the National Institutes of Health (T32GM08349, C.L.).