
Abstract
The ultimate therapy for ischemic stroke is restoration of blood supply in the ischemic region and regeneration of lost neural cells. This might be achieved by transplanting cells that differentiate into vascular or neuronal cell types, or secrete trophic factors that enhance self-renewal, recruitment, long-term survival, and functional integration of endogenous stem/progenitor cells. Experimental stroke models have been developed to determine potential beneficial effect of stem/progenitor cell-based therapies. To follow the fate of grafted cells in vivo, a number of noninvasive imaging approaches have been developed. Magnetic resonance imaging (MRI) is a high-resolution, clinically relevant method allowing in vivo monitoring of cells labeled with contrast agents. In this study, labeling efficiency of three different stem cell populations [mouse embryonic stem cells (mESC), rat multipotent adult progenitor cells (rMAPC), and mouse mesenchymal stem cells (mMSC)] with three different (ultra)small superparamagnetic iron oxide [(U)SPIO] particles (Resovist®, Endorem®, Sinerem®) was compared. Labeling efficiency with Resovist® and Endorem® differed significantly between the different stem cells. Labeling with (U)SPIOs in the range that allows detection of cells by in vivo MRI did not affect differentiation of stem cells when labeled with concentrations of particles needed for MRI-based visualization. Finally, we demonstrated that labeled rMAPC could be detected in vivo and that labeling did not interfere with their migration. We conclude that successful use of (U)SPIOs for MRI-based visualization will require assessment of the optimal (U)SPIO for each individual (stem) cell population to ensure the most sensitive detection without associated toxicity.
Keywords
Introduction
Neurological disorders such as stroke result in irreversible brain tissue damage for which there is no available curative treatment. An increasing number of investigators are exploring cell replacement approaches to treat neurological disorders, by grafting stem/progenitor cells in animal models (6,18,27,29,40,41,43,47,53). Clinically suitable methods are needed to follow the fate of the grafted cells in vivo to understand in a temporal manner mechanisms of stem cell survival and functional integration (22).
Due to its noninvasive nature, high contrast in soft tissue, and high spatial resolution, magnetic resonance imaging (MRI) is one of the most powerful clinical diagnostic tools available today. For biomedical applications like cell tracking, grafted cells must be visualized against the background of host tissue. Therefore, cells have to be labeled with contrast agents [for review see (7,16,17,30)]. One can use positive contrast agents in T1-weighted MRI such as lanthanoide-chelates (12) or Mn-containing compounds (51,52). Alternatively, negative contrast agents, such as superparamagnetic iron oxide (SPIO) (4,7,24,31,37,54), ultrasmall SPIO [(U)SPIO] particles (4,18,24,31), or micron-sized iron oxide particles (39,46) are highly sensitive and have a dominant effect on the T2/T2∗ relaxation times, causing negative contrast enhancement in the regions of interest. Multiple attributes of these particles determine the labeling efficacy of the agents, including the size of the iron oxide particles, the charge, and the nature of the coating [for review see (17,30)]. These physicochemical characteristics not only affect the efficacy of the particles for MRI, but also their stability, biodistribution, metabolism, and their clearance from the vascular system (11). The internalization of (U)SPIOs can be enhanced through pre-treatment of these particles with transfection agents. The latter are highly charged macromolecules that have been used to transfect DNA into cells via electrostatic interaction resulting in endosome formation (2,4,18,24).
Although labeling of cells has shown to be successful for many applications, very few studies have evaluated its effects on cell function (1,23,42,44). The goal of this study was to determine whether different stem cell populations being considered for the therapy of neurological disorders, including murine mesenchymal stem cells (mMSC), murine embryonic stem cells (mESC), and rat multipotent adult progenitor cells (rMAPC) could be labeled with similar efficiency using different nanoparticles. The stability of the labeling after prolonged culture in vitro was also evaluated. In addition, potential toxic effects of the labeling on the three stem cell populations were examined. Finally, the possibility of in vivo detection of labeled rMAPC was assessed, as well as the effect of the labeling on cell distribution when grafted in the setting of photothrombotic lesions.
Materials and Methods
Cell Populations
mMSC from C57Bl/6 mice were obtained from Dr. D Prockop, Tulane University, USA, where they were isolated and shown to differentiate into adipocytes and osteoblasts (33). Isolation and characteristics of rMAPC from Fisher rats has been described elsewhere (5). mESC from 129 mice (R1 line) were received from the Vesalius Research Institute (K.U. Leuven, Belgium). All cell lines were maintained as described previously (48). Prior to use in our studies, mESC were replated feeder free on 0.1% gelatin (Chemicon, Billerica, USA)-coated plates.
Cell Labeling
The following magnetic resonance iron-based contrast agents were used: Resovist® (particle diameter 60 nm; Shering, Munchen, Germany), Sinerem® (particle diameter 20–40 nm), and Endorem® (particle diameter 80–150 nm) (both Guerbet, Roissy, France). Cell labeling was performed by coculture of the cells with (U)SPIOs with and without transfection agents [23 or 388 kDa poly-l-lysine (PLL)] for 4–24 h. The concentration of (U)SPIOs was tested in a range of 20–500 μg total iron per milliliter of culture medium. Final concentrations used were Resovist® (50 μg/ml); Endorem® (348 μg/ml); Sinerem® (500 μg/ml).
Iron Quantification
Cell pellets of labeled and unlabeled cells were collected 24, 48, and 72 h after labeling and mineralized “au bain marie” prior to Induced Coupled Plasma-Mass Spectroscopy (ICp-MS) (Perkin Elmer, MA, USA). Values per tube were calculated as follows: total iron content per pellet = μg total iron per liter x (mass mineralized BM/density mineralized BM) x dilution (according to Guerbet protocol).
Dextran Staining
Cells were fixed with 10% NBF (60% PBS and 40% formaldehyde; Sigma, St. Louis, MO, USA) for 15 min, washed, and incubated for 15 min with PBS (Sigma) + 0.1% Triton (Sigma). Next, cells were rinsed and stained with mouse anti-dextran-FITC (1:1000, Stem Cell Technologies, Vancouver, Canada) overnight. The next day, cells were rinsed and staining was detected using fluorescent microscope (AxioImager, Zeiss, Gottingen, Germany).
Cell Proliferation
Labeled cells were cultured in their specific expansion medium under standard conditions (48). Cells were counted each day using a nucleocounter. Population doubling time (PDT) was calculated as follows: T x ln2/ln(A/A0), with T = time between two cell counts, A = the number of cells at end, and A0 = the initial number of cells. We followed the PDT of the labeled cell populations for 7 days.
Cell Differentiation Assays
Differentiation of mMSC to the osteogenic and adipogenic lineage was performed according to standardized methods (13,14,35). Differentiation of rMAPC to the endothelial, neuroectodermal, and hepatic lineage was performed as described previously (48).
In Vitro Osteogenic Assays
Unlabeled and (U)SPIO-labeled mMSC were seeded at 104 cells/cm2 in 24-well plates. After 2 days in culture, the medium was replaced by osteogenic medium [expansion medium supplemented with 100 nM dexamethasone, 10 mM β-glycerophosphate, and 50 μM ascorbic acid 2-sulfate (Sigma)] for 3 weeks (25). The cells were lysed in 150 μl PBS containing 0.05% Triton X-100 (Sigma). Alkaline phosphatase activity was measured using a commercially available kit (Kirkegaard & Perry, Guildford, UK), according to the manufacturer's instructions. DNA content was determined with the Quant-iT™ dsDNA HS Assay (Invitrogen). Parallel samples were processed for RNA extraction at 6 and 14 days. After 3 weeks of treatment with osteogenic medium, calcium deposits were stained with alizarin red. After taking pictures with a Nikon Coolpix 995 camera through an inverted microscope (Telaval 31, Zeiss), alizarin red was extracted as described previously and absorbance was measured at 492 nm. Unlabeled bone marrow-derived cells (hBMDCs) were used as positive control.
In Vitro Adipogenesis
Unlabeled and (U)SPIO-labeled mMSC were seeded in 24-well plates at a cell density of 104 cells/cm2. Cells were allowed to become confluent in expansion medium. Adipogenic induction medium was then added, consisting of expansion medium supplemented with 1 μM dexamethasone, 0.5 mM methylisobutylxanthine, 10 μg/ml insulin, and 100 mM indomethacin (all from Sigma). After 72 h, the medium was changed to adipogenic maintenance medium (10 μg/ml insulin in culture medium) for 24 h. Cells were treated four times with induction medium. The cells were then maintained in adipogenic maintenance medium for 1 week before fixation. After 21 days cells were washed twice with PBS, fixed with 0.2% glutaraldehyde (Sigma) for 5 min, washed with PBS, rinsed in 60% isopropanol, and covered with Oil Red O solution [0.1% Oil Red O (Sigma) in 60% isopropanol]. After 10 min, cultures were briefly rinsed in 60% isopropanol, washed thoroughly in distilled water, and counterstained with hematoxylin.
Differentiation of MAPC to the endothelial, neuroectodermal, and hepatic lineage was performed as described in Ulloa-Montoya et al. (48).
Endothelial Differentiation
Briefly, for endothelial differentiation, rMAPC were plated in fibronectin-coated wells. On day 1, medium was switched to a differentiation medium [low glucose DMEM/MCDB-201 (60:40) containing 10 ng/ml hVEFG-A (R&D Systems), 1x ITS, 1x LA-BSA, 10−8 M dexamethasone, 10−4 M ascorbic acid 3-phosphate, 100 units of penicillin, 1,000 units of streptomycin, and 55 μM 2-mercaptoethanol (Cellgro)]. RNA samples were collected on day 9 for analysis.
Hepatic Differentiation
For hepatic differentiation, rMAPC were plated in Matrigel-coated wells in low-glucose DMEM/MCDB-201 (60:40) containing 2% FBS, 0.25x ITS, 0.5x LA-BSA, 0.1 × 10⁻⁶ M dexamethasone, 10−4 M ascorbic acid 3-phosphate, 100 units of penicillin, 1,000 units of streptomycin, and 55 μM 2-mercaptoethanol. The following cytokines were added sequentially: 100 ng/ml Activin-A and 50 ng/ml BMP4; 10 ng/ml FGF-2 and 25 ng/ml FGF8b; and 20 ng/m HGF and 10 ng/ml Oncostatin-M (all from R&D systems). RNA samples were collected on day 20 for analysis.
Neuroectoderm Differentiaton
For neuroectoderm differentiation, MAPC were plated on gelatin-coated T75 flasks in N2B27 medium [DMEM-F12/Neuroba-salA medium (Invitrogen) 1:1 supplemented with N2 supplement (1x, R&D) and B27 (1x, Invitrogen), 100 units of penicillin, 1,000 units of streptomycin, 55 μM 2-mercaptoethanol, and 200 nM l-glutamine (Invitrogen)]. After 2 days medium was changed to NSE medium [Euromed medium (Euroclone) supplemented with N2 supplement (1x, R&D), 200 nM l-glutamine (Invitrogen), 100 units of penicillin, 1,000 units of streptomycin, and bFGF (10 ng/ml, R&D) and EGF (10 ng/ml, R&D)]. RNA samples were collected on day 6 for analysis.
RT-qPCR
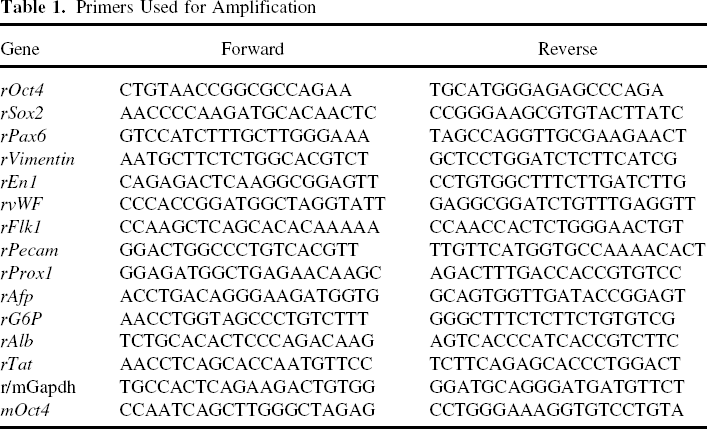
Experiments were conducted as described (48). For rMAPC and mESC, total RNA from undifferentiated and differentiated cells was extracted using the RNAeasy microkit (Qiagen, Valencia, CA, USA). cDNA was generated by reverse transcription using Superscript III Reverse Transcriptase (Invitrogen, Carlsbad, CA, USA). To test the expression of gene(s) of interest a real-time PCR was performed as follows: 40 cycles of a two-step PCR (95°C for 15 s, 60°C for 45 s) after initial denaturation (95°C for 10 min) with 2 μl of cDNA solution, 2&x SYBR Green Universal Mix PCR reaction buffer (Invitrogen). Expression of target genes was normalized to Gadph. Gene expression level represented as ACT: ΔCT(CTgene of interest – CTGAPDH). Primers used for amplification are shown in Table 1.
Primers Used for Amplification
For osteogenic and adipogenic differentiation studies, cells and cell pellets obtained in the in vitro differentiation experiments were homogenized in a cell lysis buffer from the RNA extraction kit (Nucleospin, BD Biosciences). RNA extraction was performed according to manufacturer's recommendations. Complementary DNA (cDNA) was obtained by reverse transcription of 1 μg of total RNA with oligo(dT)20 as primer (RevertAid™ H Minus First Strand cDNA Synthesis Kit; Fermentas Life Sciences). To evaluate gene expression, taqman PCR was performed on Corbett 6000 Rotorgene system (Westburg) using the assay-on-demand probes from Applied Biosystems (assay numbers: GAPDH: 4352339E, ALP: Mm01187117_m1, iBSP: Mm00492555_m1) cDNA obtained from expanded mBMCs before labeling and treatment was used as a reference sample. Gene expression levels are listed as ACT: ACT(CTgene of interest – CTGAPDH).
Electron Microscopy
Cells were fixed with 3.5% glutaraldehyde (Electron Microscopy Science, Hatfield, USA) for 1 h at 37°C. Cells were postfixed with 1% osmiumtetroxide (Sigma), rinsed, dehydrated, and embedded in araldite (Durcupan, Sigma). Semithin sections (1.5 μm) were cut with a diamond knife and stained lightly with 1% toluidine blue (Panreac, Barcelona, Spain). Semithin sections were re-embedded in an araldite block and detached from the glass slide by repeated freezing (liquid nitrogen) and thawing. The block with semithin sections was cut in ultrathin (0.05 μm) sections with a diamond knife, stained with lead citrate, and examined under a Tecnai spirit electron microscopy (FEI). Photographic images were taken with a Morada camera (Soft Image System, Munster, Germany). For (U)SPIO particle quantifications an average of five ultrathin sections corresponding to different locations were analyzed for every time point and the quantification was carried out by three independent scientists.
Fluorescence-Activated Cell Sorting (FACS)
FACS staining was performed as described previously (48). Unlabeled and (U)SPIO-labeled cells were collected by trypsinization, washed with PBS (Invitrogen) containing 3% FBS, and blocked for 10 min with 5% rat serum (Jackson ImmunoResearch, West Grove, USA) and 10 μl anti-CD16/CD32 (2.4G2) antibody (BD Bioscience). After washing, cells were incubated for 30 min at 4°C in 3% FBS containing conjugated antibodies. Cells were washed once and resuspended in PBS 3% FBS and analyzed by flow cytometry on FACSCanto (BDPharmingen, San Jose, USA). Antibodies used to characterize rMAPC were anti-CD44-FITC (OX-49) and antiCD31-PE (TLD-3A12). Mouse IgG2a,κ (G155–178) and mouse IgG1,κ (MOPC-31C) are respectively used as isotype controls. For mMSC anti-CD44-APC (IM7) and anti-ckit-PE (2B8) were used and rat IgG2b,κ (A95–1) was used as isotype control (all antibodies were from BDPharmingen, San Diego, CA).
Cytogenetics
Evaluation of cell ploidy was performed as described (48). Demecolcine (10 μg/ml in HBSS; Invitrogen) was added to the media until 50% of the cells were detached. Media was removed and the remaining attached cells were collected following rinsing. Cells were centrifuged at 1000 RPM for 5 min, and the pellet transferred to a conical tube with PBS. 0.0075 M KCl was added, pre-warmed to 37°C. After 10 min, cells were centrifuged and the pellet mixed with fixative. Cell suspensions were dropped on the slide and allowed to dry. Slides were stained with 1:5 diluted Wright-Giemsa stain (0.4% w/v in MeOH) in Gurr Buffer (Gibco). The number of chromosomes per cell was enumerated for at least 40 cells under a light microscope (Zeiss).
Photothrombotic Animal Model and Cell Injections
Animal experiments were approved by the bioethics committee of K.U. Leuven (P06098, Leuven, Belgium). Male and female NOD-SCID/gamma c-/- mice were obtained from the breeding colony in the SPF facility at K.U. Leuven. Male Fisher 344 rats were purchased from Charles River (Wilmington, USA). All animals were housed with access to food and water. For surgery, 3-week-old mice or 8-week-old rats were anesthetized intraperitoneally with ketamine (Ketamine 1000, 75 mg/kg;CEVA Santé Animale, Libourne, France) and mede-tomidin (Domitor, 1 mg/kg; Orion Pharma, Espoo, Finland).
Cortical photothrombosis was induced in eight mice and eight rats. A vertical incision was made between the right orbit and the external auditory canal. The upper part of the temporalis muscle was cauterized so that the muscle could be displaced. Photoillumination with green light (wave length, 540 nm; bandwith, 80 nm) was achieved using a Xenon lamp (model L-4887; Hamamatsu Photonics, Hamamatsu City, Japan) with heat-absorbing and green filters. The irradiation at intensity of 0.68 W/cm2 was directed with a 3-mm optic fiber, which was placed on the exposed skin above the middle cerebral artery. Photoillumination was performed for 20 min after intravenous injection of the photosensitizer Rose Bengal (20 mg/kg, Sigma-Aldrich) in a tail vein. Control experiments were performed without injection of the photosensitizer. No photothrombotic injury was detected in control animals.
Injection of GFP+ MAPC was performed in eight control mice to establish detectability thresholds and also in eight rats 2 days after photothrombosis. The head of the animals was positioned in a stereotactic head frame (Stoelting, Wood Dale, IL) for stereotactic injection into the striatum. The skull was exposed by a small midline incision and a hole was drilled into the skull in the appropriate location, using bregma as the reference point. Stereotactic coordinates starting from the dura were as follows: lateral +0.20 cm for left injection, −0.20 cm for right injection; anterior-posterior +0.05 cm; depth 3 mm to 2 mm (mice); lateral +0.28 cm for left injection, −0.28 cm for right injection; anterior-posterior 0.11 cm; depth 4 mm (rat). Using a 30-gauge Hamilton syringe (VWR International, Haasrode, Belgium), 10,000 or 50,000 labeled cells were injected in mice or 10,000 or 1,000,000 cells were injected in rat at a rate of 0.25 μl/min into left or right striatum, respectively. After injection, the needle was left in place for an additional 5 min before slowly withdrawn. Anesthesia was reversed with atipamezol (Antisedan, 0.5 mg/kg; Orion Pharma), administered intraperitoneally.
In Vitro MRI Experiments of Labeled Cells
For the assessment of the in vitro visualization of (U)SPIO-labeled cells by MRI, phantoms were built using culture dishes (3.5 cm diameter) filled with agar (Sigma-Aldrich, 0.8% in saline). Drill holes (4 mm diameter of a defined depth) were filled with cell suspensions of known concentration. After solidification of the cell-agar suspensions, drill holes were closed with additional agar. All MR images were acquired using a Bruker Biospec 9.4 Tesla small animal MR scanner (Bruker Biospin, Ettlingen, Germany; horizontal bore, 20 cm) equipped with actively shielded gradients (600 mT m−1). A purpose-built radiofrequency solenoid transmit–receive coil with a length of 6 cm and an inner diameter of 4 cm was used for all phantom experiments. 2D multislice–multiecho (MSME) experiments were acquired for the calculation of T2 maps (TR = 6,000 ms and 10-TE increments of 10 ms, 2562 matrix, 156 × 156 μm in plane resolution, 0.8mm slice thickness). T2∗ maps were acquired similarly to MSME experiments using a gradient echo pulse sequence and 10-TE increments of 4.5 ms. Three-dimensional (3D), high-resolution T2∗-weighted MR images were acquired using a gradient echo sequence (FLASH, TR = 200 ms, TE = 15 ms, flip angle 30°). The field-of-view was 3.8 × 3.8 × 0.75 cm. The resolution was usually 74 × 74 × 59 μm.
In Vivo MRI Experiments
MR images from animals were usually acquired within 12 h after photothrombosis. Subsequent images were acquired within 12 h after cell engraftment and were repeated for up to 10 days after implantation. MR images were acquired using an actively decoupled linear polarized RF resonator as transmitter (inner diameter 7 cm, Bruker Biospin) with respective mouse and rat brain surface coils (Bruker Biospin) as receiver. After acquisition of 2D multislice localizer images, 2D MSME experiments were acquired for the calculation of T2 maps (TR = 6,000 ms and 10-TE increments of 10 ms, 2562 matrix, 156 × 156 μm in plane resolution, 0.8 mm slice thickness). High resolution 3D FLASH images were acquired for the visualization of labeled cells thereafter, resulting in an isotropic spatial resolution of 100 μm3. Other acquisition parameters were TR = 100 ms, TE = 12 ms, flip angle 30°. Diffusion-weighted MR images (spin echo) were acquired for the first two time points after the photothrombotic injury for assessment of injury. Acquisition parameters were: TR = 1500 ms, TE = 27 ms, B = 1500, in plane isotropic resolution 156 μm2, 1 mm slice thickness.
MRI Data Processing
Images were processed using Paravision 4 (Bruker Biospin) and NIH ImageJ. Relaxation rates (r2) were determined as mean values of homogeneous sections of the cell-loaded areas in the agar phantoms. Values were compared to those of unlabeled cells in the same phantom. Relative quantification was also performed using 3D T2∗-weighted MR images. The relative mean signal intensity of the respective drill holes was determined relative to unlabeled cells (SI = 100%). Data were expressed as mean ± SD.
Immunohistochemistry
Animals were sacrificed at 1.5 or 3 weeks after injection with an intraperitoneal overdose (300 μl/20 g) of pentobarbital (Nembutal; CEVA Santé Animale) and transcardially perfused with 4% (w/v) paraformaldehyde (PFA, Sigma) in PBS. Brains were removed and postfixed overnight in 4% PFA. Serial 50-μm coronal sections were made with a microtome (Vibratome, St. Louis, MO). Hematoxylin and eosin staining was performed for all brains to assess injury. GFP staining was performed for visualization of transplanted cells (1:30, Clonetech, CA, USA).
Statistical Analysis
For in vitro experiments Student's paired two-tailed t-test was used for comparison of two experimental groups. Changes were identified as significant if p < 0.05. When multiple groups were compared, Bonferroni correction was applied. Data are shown as mean ± SD.
Results
Labeling Efficiency of mMSC, rMAPC, and mESC with Resovist®, Sinerem®, and Endorem®
In initial experiments, we tested the optimal time for labeling and whether addition of transfection agents was needed for labeling with Resovist®, Sinerem®, and Endorem®. Greater amounts of (U)SPIOs were taken up by cells incubated for 24 h with either Resovist®, Sinerem®, or Endorem® compared to incubation for 4 h (microscopy after Prussian blue staining). Hence, all subsequent studies were done by incubating cells 24 h. Particle clustering was observed when 23 kDa PLL instead of 388 kDa PLL was used as transfection agent together with Resovist®. Hence, all further experiments were performed using 388 kDa PLL. Comparison of (U)SPIOs uptake with and without the transfection agent (PLL) showed that Resovist® and Sinerem® were taken up (more efficiently) in the presence of PLL compared with uptake experiments without the transfection agent. However, uptake of Endorem® was not affected by the presence or absence of PLL (data not shown). Optimal labeling was defined as being able to detect the lowest cell density (15 cells/μl) for one of the three stem cell populations by MRI of phantoms containing labeled cells. After testing various (U)SPIO concentrations and incubation times, this was achieved using the following conditions: 50 μg/ml Resovist® combined with 0.75 μg/ml PLL (388 kDa), 500 μg/ml Sinerem® combined with 0.75 μg/ml PLL (388 kDa), and 348 μg/ml Endorem® without transfection agent for 24 h (data not shown).
The size, amount, density, and localization of (U)SPIO inclusions in the cells was evaluated by transmission electron microscopy (TEM). As shown in Table 2, the number of inclusions per rMAPC was significantly higher for Sinerem® compared to Endorem® and Resovist®. The average size of inclusions, representing clustered (U)SPIOs, was significantly higher for Resovist® and Sinerem® when compared to Endorem®. The density of inclusions was significantly higher for Endorem® and Resovist® compared with Sinerem®. The quantity of internalized iron per cell was evaluated by ICP-MS as shown for time points day 1, day 2, and day 3 after labeling for 24 h (Fig. 1A–C). When different particles were compared within one cell population, higher concentrations of iron were detected in rMAPC and mMSC labeled with Resovist® (2.51 and 11.58 pg/cell, respectively) at day 1, while in mESC the highest concentration of iron was found following labeling with Endorem® (4.14 pg/cell) at day 1. In general, the most iron was in average detected in mMSC, most likely due to their larger size (surface area measured by TEM: mMSC 363.61 ± 267.76 μm2; rMAPC 157.81 ± 89.93 μm2, and mESC 114.54 ± 61.48 μm2).

Determination of iron content in rMAPC, mESC, and mMSC. (A–C) Iron quantification was performed by ICP-MS. Stem cells were cultured for 24 h with Resovist®, Endorem®, or Sinerem®, washed with PBS twice, and cultured for 1, 2, or 3 days without (U)SPIOs before iron quantification. (A) rMAPC, (B) mESC, (C) mMSC (n = 3); ∗p < 0.016. (D–F) Number of endosomal inclusions over time determined by TEM. mMSC, rMAPC, and mESC were labeled with Resovist®. The amount of inclusions per cell type was measured at time points day 1, day 3, and day 5 after labeling (n = 5).
Statistical Analysis of Number, Size, and Density of Inclusions in rMAPC

Cells were fixed and evaluated under TEM; n = number of samples. Density was measured by visual quantification giving number 0 (as control for unlabeled cells) until 5 (big inclusions). Data are presented as mean ± SE.
p < 0.05.
The quantity of iron per rMAPC decreased significantly at day 3 (fold decrease of 3.9 for Resovist®, 5.3 for Endorem®, and 4.25 for Sinerem®). In mESC there was significant decrease of iron for Resovist® by day 3 (fold decrease 2.1) and for Sinerem® by day 2 (fold decrease 1.4). In contrast, no reduction could be observed in mMSC (see Fig. 1). The number of inclusions over time was also evaluated. As expected, in all three stem cell types, the number of inclusions decreased over time (Fig. 1D–F).
In Vitro Evaluation of Cell Labeling by MRI
Visualization of stem cells by MRI is only successful if the amount of (U)SPIOs taken up is sufficient to alter contrast in MRI. To determine if sufficient particles were present in cells to be visualized by MRI, we made agar phantoms containing different numbers of labeled cells to determine the minimum detectable cell number. To assess the effect of dilution of intracellular (U)SPIOs due to cell proliferation and its influence on cell detectability, phantoms containing cells were scanned 24, 48, and 72 h after labeling. Figure 2 shows 3D T2∗-weighted MRI as well as T2 and T2∗ maps of cell phantoms. Cell densities as low as 5 cells/μl were detectable for cells labeled with Endorem® (mESC, rMAPC, mMSC) or Resovist® (rMAPC, mMSC). Labeling with Sinerem® showed less contrast, resulting in a detectability limit in the order of 75 cells/μl. The MRI contrast strongly depended on the combination of stem cell type and contrast agent. Resovist® was superior over Endorem® for rMAPC and for mMSC labeling. However, labeling of mESC was most efficient using Endorem® compared to Resovist® (Fig. 2A). Moreover, contrast in T2∗-weighted MRI was more pronounced in the larger mMSC for all particles compared to mESC and rMAPC. Absolute quantification of cell numbers was not possible due to large magnetic susceptibility effects of the labeled cells at high densities. Fitting for T2 and T2∗ maps was not possible due to signal quench even for the lowest echo times. Counting of erased pixel clusters in 3D T2∗-weighted MR images of cell suspensions of low density [as described by Kustermann et al. (24)] did not yield a correlation with cell numbers due to cell clustering.

In vitro visualization of cells by MRI. Agar phantoms were filled with 250, 75, 15, and 5 rMAPC, mMSC and mESC per microliter, following labeling of the cells with Endorem®, Resovist®, or Sinerem®. (A) 3D T2∗-weighted gradient-echo MRI of phantoms loaded with cells labeled for 24 h, followed by 24-h culture in (U)SPIO-free medium. The presence of contrast agent is illustrated by hypointense (dark) contrast. (B) T2 map (left) and T2∗-weighted MRI (right) of Endorem®-labeled mESC. The phantom was loaded with labeled cells at concentration of 75 cells/μl cultured for an additional (1) 1 h, (2) 24 h, (3) 48 h, (4) 72 h, and (5) 120 h in Endorem®-free medium.
When cells were cultured for 48 h in iron-free medium prior to MRI, decreased detectability of labeled cells was observed (Fig. 2B). Consistent with experiments immediately after cell labeling (Fig. 2A), sensitivity of MRI detection strongly depended on the combination of stem cell type and (U)SPIO. In line with the results of iron uptake (Fig. 1), Endorem® was more efficient for mESC labeling whereas Resovist® resulted in better detectability of rMAPC and mMSC. The lower proliferation rates of mMSC compared to rMAPC and mESC resulted in less dilution of the contrast agents with time and similar detectability thresholds after additional 72-h incubation in iron-free medium (data not shown).
Effect of Labeling on Stem Cell Proliferation, Phenotype, and Genetic Integrity
We evaluated whether labeling of mMSC, rMAPC, and mESC with either (U)SPIO affects cell proliferation over a period of 7 days. Results are shown in Figure 3. Labeling of mMSC with Sinerem® resulted in an increased PDT on day 5, compared with unlabeled cells or cells labeled with Endorem® and Resovist®. However by day 7, no significant differences were noted between mMSC labeled with any of the contrast agents compared with unlabeled mMSC (Fig. 3A). Labeling with any of the contrast agents did not affect mESC PDT over the 7-day period (Fig. 3B). By contrast, labeling of rMAPC with either Sinerem® or Endorem® resulted in a lengthening of the PDT on day 5, which was statistically significant compared to cells labeled with Resovist® or unlabeled cells (Fig. 3C). The phenotype of mMSC, rMAPC, and mESC was validated following labeling with the different (U)SPIOs. mESC represent pluripotent stem cells (21), characterized by the expression of key transcription factors that maintain the pluripotent state. Among these is the Pou5f1 transcription factor, also known as Oct4 (32). We determined the transcript levels of Oct4 in mESC 2 days after labeling with the (U)SPIOs. In Resovist®-labeled mESC, the level of Oct4 transcripts was 2.77-fold higher compared to control, although this was not statistically significant (Fig. 4A). We have previously shown that, similar to mESC but in contrast to mMSC, rMAPC also express Oct4, and that presence of Oct4 is associated with the significantly broader differentiation potential of rMAPC (48). Therefore, the expression of Oct4 was also evaluated in rMAPC 2 days after labeling with (U)SPIOs and in unlabeled controls. As for mESC, we could not detect a statistically significant difference in Oct4 transcript levels in rMAPC labeled with any of the (U)SPIOs compared to unlabeled rMAPC (Fig. 4B).
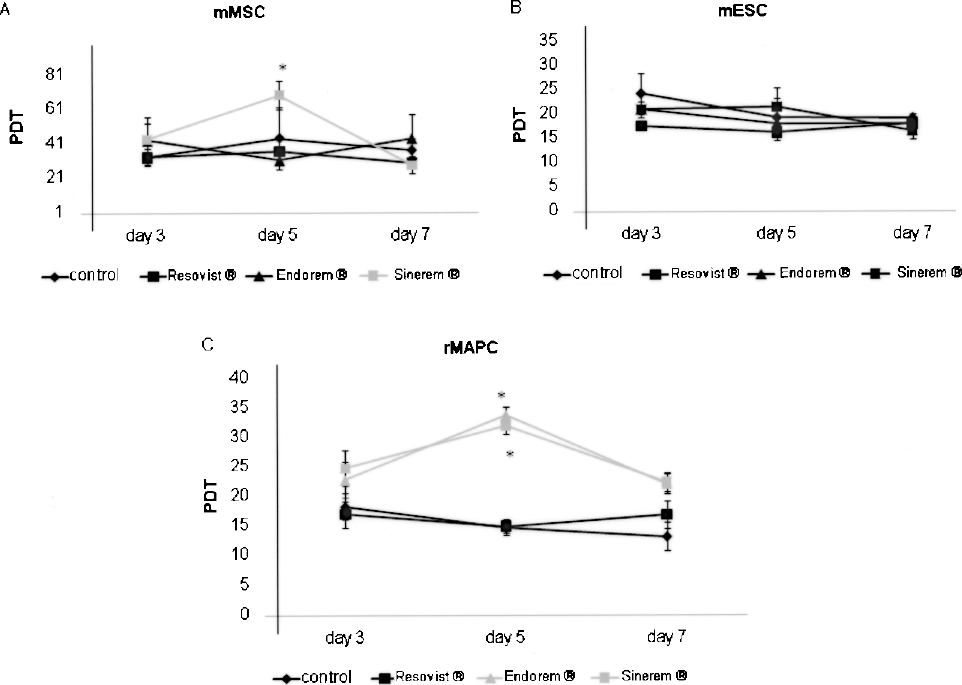
Population doubling time of rMAPC, mESC, and mMSC labeled with different (U)SPIOs. Population doubling time (PDT = T x ln2/ln(A/A0), with T= time between two cell counts, A = the number of cells at end, A0 = the initial number of cells) of cells calculated from day 0 until day 7 after (U)SPIO labeling for the following conditions: control, Resovist®, Sinerem®, Endorem®. (A) mMSC, (B) mESC, and (C) rMAPC (n = 3); ∗p < 0.016.
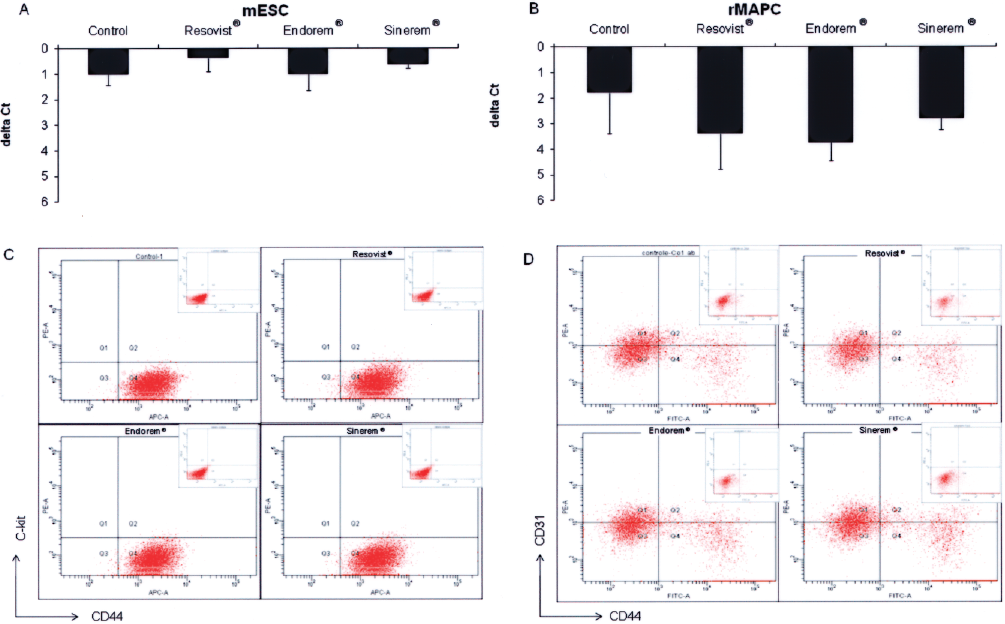
Comparison of phenotype of labeled and unlabeled stem cells. mMSC, rMAPC, and mESC were labeled with Endorem®, Resovist®, or Sinerem®. (A, B) Two days after culture in (U)SPIO-free medium, RNA was extracted from rMAPC and mESC and levels of Oct4 transcripts were determined by RT-qPCR. Data are shown as ΔCt (n=3) compared with the housekeeping gene Gadph for (A) mESC and (B) rMAPC. (C, D) Three days after culture in (U)SPIO-free medium, the phenotype of mMSC and rMAPC was evaluated by FACS of cells labeled with antibodies against CD44 and c-kit (mMSC) and CD44 and CD31 (rMAPC). Isotype controls are shown in frame. FACS analysis plot for one of three representative experiments. (C) mMSC, (D) rMAPC.
We and others have shown that mMSC, used in the present study, express among others the cell surface anitgen CD44 at high levels, but not c-kit (33,47). rMAPC are CD44dim/CD31+ (5,48). To ascertain that labeling with (U)SPIOs did not affect the mMSC and rMAPC cell identity, we evaluated cells 3 days after labeling with the three contrast agents by FACS. No obvious changes in cell surface phenotype were identified following labeling (Fig. 4C, D).
We also assessed whether labeling with any of the (U)SPIOs would cause increased aneuploidy of mMSC, rMAPC, or mESC. It should be noted that previous published studies have shown that mMSC become aneuploid very quickly after isolation, including the mMSC population used here (19). Compared to unlabeled control cells, the ploidy of labeled cells was not decreased for up to 5 days after labeling (rMAPC: 72.17 ± 3.50%; mESC: 50.9 ± 8.82%; mMSC: 3.3 ± 0.01%).
Effect of Labeling on Stem Cell Differentiation
Previous reports suggested that labeling of stem cells, such as mMSC, with (U)SPIOs may affect their differentiation ability (23). We therefore tested the effect of (U)SPIO labeling on the differentiation ability of mMSC and rMAPC (Fig. 5).

Differentiation capacity of mMSC and rMAPC labeled with (U)SPIOs in comparison to unlabeled cells. (A–C) mMSC labeled with Endorem®, Resovist®, or Sinerem® were allowed to differentiate towards osteoblasts (A, B) or adipocytes (C). (A) Osteoblast differentiation was induced using osteogenic medium and progeny of labeled and unlabeled cells evaluated by immunohistochemistry for alkaline phosphatase staining at day 6, and calcium measurement at day 14 (n = 2). (B) Specific transcripts measured by RT-qPCR. ΔCt values of Bsp and Alp are shown. ∗p < 0.05. (C) To induce adipogenic differentiation, labeled and unlabeled cells were cultured with insulin, and progeny evaluated on day 21 by Oil Red O staining. Left: control, right: adipogenic stimulation. Fat vacuoles are formed in the cells. (D–F) rMAPC labeled with Endorem®, Resovist®, or Sinerem® were allowed to differentiate to hepatocyte-like (D), endothelium-like (E), and neuroprogenitor-like (F) cells as described in Materials and Methods. Cells were harvested and on day 21, 9, and 6, respectively, and expression of hepatic, endothelial, and neuroprogenitor transcripts evaluated by RT-qPCR (n = 9). ΔCt values are shown. (G–N) Evaluation of iron inclusions in differentiated rMAPC and mMSC by TEM. rMAPC labeled with Endorem®, Resovist®, or Sinerem® were differentiated towards hepatocyte-like, endothelium-like, and neuroprogenitor-like cells. On day 21, 9, and 6, respectively, cells were evaluated for presence of iron inclusion using TEM. Labeled mMSC were differentiated towards osteoblasts. On day 14 cells were evaluated for presence of iron inclusions using TEM. (G) rMAPC liver Resovist®, (H) rMAPC liver Endorem®, (I) rMAPC endothelium Resovist®, (J) rMAPC endothelium Endorem®, (K) rMAPC endothelium Sinerem®, (L) mMSC osteoblast Endorem®, (M) mMSC osteoblast Resovist®, (N) mMSC osteoblast Sinerem®. Iron particles are seen as black cluster or indicated by arrows.
mMSC differentiate towards osteoblasts and adipocytes (33,35,36). Treatment with dexamethasone, β-glycerophosphate, and l-ascorbic acid, to induce osteogenic differentiation, resulted in a similar increase in alkaline phosphatase (Fig. 5A), and calcium deposition by day 14 when labeled and unlabeled mMSC were compared. Statistically significant increases in transcripts for the osteogenic markers, Alp (26) and Bsp (15), were similar in labeled and unlabeled cells on day 14 of osteogenic differentiation (Fig. 5B). Adipogenic differentiation was induced using insulin and assessed by Oil Red O staining (Fig. 5C). Cells stained with Oil Red O were similar in labeled or unlabeled cells; for Sinerem®-labeled cells a modest decrease in staining is seen based on visual observations. Hence, labeling of mMSC with Resovist®, Sinerem®, or Endorem® did not affect the differentiation ability of mMSC towards osteoblasts and adipocytes. As shown in Figure 5I-N, TEM demonstrated persistent presence of the different (U)SPIOs in the differentiated mMSC progeny over the whole time period of the experiment.
In comparison with mMSC, rMAPC have significantly broader differentiation ability, and can generate progeny of the three germ layers (48). To assess the effect of (U)SPIO labeling on rMAPC differentiation, differentiation to hepatocyte-, endothelium-, and neuroectodermal progenitor-like cells was induced using methods described previously (48). Lineage differentiation was assessed by RT-qPCR for lineage-specific gene transcripts (Fig. 5D–F). Differentiation towards hepatocyte-like cells was induced using a multistep protocol as described previously (48). For labeled or unlabeled cell populations, a similar increase in transcripts for α-fetoprotein (Afp) (9), albumin (Alb) as well as the mature hepatocyte gene Tat (8) was seen by day 21 (Fig. 5D). Differentiation to endothelium of rMAPC labeled with (U)SPIOs and unlabeled controls was induced with VEGF-A. A similar induction of Flk1, Prox1, and Pecam (20) was observed (Fig. 5E). Differentiation of rMAPC towards neuroectodermal progenitor cells was achieved using a protocol based on studies by Conti et al. (10) and described in Ulloa et al. (48). A similar increased expression of transcripts for Sox2 and Pax6 (50) was found in labeled and unlabeled cells (Fig. 5F).
Samples from differentiated rMAPC progeny were fixed and analyzed under TEM. rMAPC-derived hepatocytic and endothelial progeny continued to contain (U)SPIOs in, respectively, 20% and 100% of the cells (Fig. 5G, H).
In Vivo Tracking of Labeled Cells in the Brain
As proof of principle for in vivo cell visualization, rMAPC labeled with Resovist® were stereotactically engrafted into the striatum of NOD-SCID γc-/- mice; 10,000 and 50,000 rMAPC suspended in 2 μl PBS were injected in the left and right hemisphere, respectively. Animals were monitored repeatedly by MRI for 3 weeks. As shown in Figure 6A, B, 10,000 cells could be visualized in 3D T2∗ MR images. The contrast and the hypointense volume of the implanted cells in MRI remained constant over the observation period (data not shown). Control injections with PBS or unlabeled cells did not change contrast apart from injuries due to the surgical procedure (needle track). Location of cells in the MRI was confirmed by histology (Fig. 6C).

Determination of in vivo detectability by MR imaging. Different concentrations of rMAPC were labeled with Resovist®, suspended in 2 μl medium and were injected in the striatum of NOD-SCID γc-/- mice. 3D T2∗-weighted MR images are shown for (A) control animal [coronal and corresponding (dotted lines) axial view with (1) 10,000 labeled MAPC, (2) 10,000 unlabeled MAPC, (3) saline injection, and (4) 2 μl medium + Resovist®] and (B) control animal injected with labeled MAPC [coronal and axial view; (1) left 10,000 cells and (2) right 50,000 cells]. (C, D) GFP staining of cells. (C) Striatum and (D) cells engrafting along the corpus callosum. CC, corpus callosum; Cor, cortex; Str, striatum; ML, midline; SR, stroke region.
As also confirmed by MRI, rMAPC were injected 1–3 mm from a photothrombotic lesion. Cells were found along the corpus callosum towards the infarct region within 24 h. However, no infiltration of rMAPC into the lesion area was seen (Fig. 6D).
Experiments were repeated in 8-week-old Fisher rats with a phototrombotic injury (Fig. 7). Resovist®-labeled rMAPC were injected close to the lesion 24 h after photothrombosis. Combinations of 100,000 labeled (Resovist®) GFP+ rMAPC with or without 900,000 unlabeled rMAPC were injected in the brain 2–8 mm from the photothrombotic injury localized in the cortex of male Fisher rats (n = 8). Cell relocation into less dense brain tissue such as the corpus callosum and the stroke region or along the needle tract was visualized by MRI (Fig. 7C). Localization of the cells was confirmed with GFP staining and hematoxylin and eosin staining (Fig. 7D, E). Unlabeled control cells showed a similar distribution pattern suggesting that labeling does not appear to affect the redistribution of rMAPC in vivo (Fig. 7B and data not shown). When mMSC were implanted, no redistribution of the cells along the corpus callosum was found (Fig. 7A).

In vivo tracking of labeled cells in the rat brain. Cells (100,000) were injected in the brain of rats with photothrombotic lesions (left hemisphere) in the contralateral hemisphere (left). The panels show (left) a diffusion weighted MRI to illustrate the extent of the lesion (acquired immediately after photothrombosis and 24 h before cell engraftment); (middle) 3D T2∗-weighted MRI acquired 24 h after cell engraftment (coronal view); (right) the corresponding axial view. The arrows indicate the injection sites. Images were acquired from (A) an animal with engraftment of 100,000 Resovist®-labeled mMSC (left and right hemisphere; no migration was observed); (B) an animal with engraftment of 100,000 unlabeled rMAPC (left and right); (C) an animal with engraftment of 100,000 Resovist®-labeled rMAPC (left and right; note the migration of cells from the injection site towards the site of photothrombotic injury); (D) GFP staining of tissue slices from animal (C) and (E) hematoxylin and eosin staining of tissue slices from animal (C). (D) and (E) CC, corpus callosum; SR, stroke region; Str, striatum.
Discussion
Noninvasive imaging plays an important role in stem cell research because it allows following an individual animal over time and studying the temporal behavior of endogenous or transplanted stem cells. One of the most clinically relevant imaging modality is MRI, because of its high spacial resolution in comparison with for instance PET, and the possibility to label cells without the need for genetic manipulation that is needed to introduce other markers such as fluorochromes in cells.
For many applications, contrast agents like highly sensitive (U)SPIOs are used for negative contrast enhancement (4,7,18,31,39,46,54). Due to their physicochemical characteristics, label uptake and stability of the particles in cells differ between different types of (U)SPIOs (2,4,18). In addition, some reports have suggested that (U)SPIO labeling may affect certain biological properties of cells (24,28,38,45). However, only limited data exist on the comparison of labeling efficiency and possible toxicity of the particles on different stem/progenitor cell populations. In this study, cell labeling efficiency of three stem cell populations (mMSC, rMAPC, and mESC) with three (U)SPIOs (Resovist®, Endorem®, and Sinerem®) was compared, and potential adverse effects of different labeling procedures on the biology of the cells were examined.
Two of the three particles tested, Resovist® and Sinerem®, were taken up better by the stem/progenitor cells when PLL 388 kDa was added, whereas uptake of Endorem® was not further enhanced when a transfection agent was added to the particle. Our study also demonstrates that different amounts of iron in the culture medium are necessary for the three (U)SPIO to visualize the cells by MRI. Also, the labeling efficiency with three different (U)SPIOs varied significantly when different stem cell populations were compared. This was shown by a combination of techniques, including dextran staining (for Endorem® and Sinerem®), measurement of intracellular iron by ICP-MS, electronmicroscopy, which also demonstrated that the number and distribution of iron particle inclusions within cells differed for the various (U)SPIOs. These findings were also confirmed by in vitro MRI, which reflected the data from ICP-MS. Comparison of electron microscopy with iron quantification (ICP-MS) and MRI indicated that the size and density of occlusions but not the number of occlusions correlated with the internalized amount of iron and MRI contrast. The small size of Sinerem® resulted in a larger number of small inclusions that were less dense and therefore contained less iron compared to Endorem® and Resovist®. These results demonstrate that labeling methods will likely need to be optimized for every cell type that is used. Over time, we saw a decrease of iron in the cells. This is mainly due to dilution of (U)SPIOs with cell division but might also occur due to exocytosis of the particles (24). The PDT of mESC and rMAPC was 12 h, whereas the PDT for mMSC was 48 h, which explains the significant reduction of iron in rMAPC. However, as this was not observed in mESC, further studies on exocytosis are needed to evaluate the loss of iron. In this study, two cell populations were from murine origin and one from rat. Whether the species origin plays a role in the efficiency of stem cell labeling is not known. Also not known is the mechanism(s) underlying the differences in labeling efficiency between cell types.
The second major goal of this study was to evaluate whether (U)SPIO labeling affects the biology of cells, as at least some studies suggested that labeling of mMSC affects differentiation potential (24,37). No significant alterations were observed in the cell phenotype of mMSC, rMAPC, and mESC following labeling, whereas differentiation ability of mMSC or rMAPC remained unchanged. For rMAPC progeny committed to an endothelial and hepatocytic phenotype, the labeling persisted until final differentiation of these cells, demonstrating that the label does not significantly affect stem cell differentiation. However, neural progeny contained few remaining SPIOs, likely due to extensive proliferation occurring during the generation of NSC-like cells from rMAPC. Hence, no images are shown from this experiment. Similarly, labeling persisted in mMSC differentiated to the adipocyte and osteocyte lineage, without influencing the differentiation process. It should be noted, however, that Sinerem® decreased proliferation of mMSC, and both Sinerem® and Endorem® affected the proliferation of rMAPC, even though prolonged culture (until 7 days) resulted in restoration of the proliferation rate. Large numbers of endosomal inclusions might thus affect the proliferation capacity of mMSC and rMAPC. This may particularly be true for rMAPC as the number of inclusions was significantly higher during the initial days of culture, but decreased substantially when rMAPC were maintained in culture, which correlated with a restoration of the proliferation rate. One should also note that higher concentrations of Sinerem® and Endorem® were neccessary for cell labeling to achieve a similar MRI detectability. Although the ploidy of cells was evaluated, and no effect of cell labeling was found, more detailed genotoxicity studies still need to be performed. As no spectral karyotyping or comparative genomic hybridization was performed, we cannot fully ascertain that labeling with (U)SPIO was not genotoxic. Because TEM demonstrated that the (U)SPIOs are located nearly exclusively in the cell cytoplasm, genotoxicity is unlikely.
Finally, we evaluated for rMAPC whether cells labeled with Resovist®, which was taken up the best in rMAPC and provided the most sensitive labeling in phantoms in vitro, can also be monitored by MRI following transplantation in vivo. When grafted in either mouse or rat brain, with or without stroke, labeled rMAPC were visualized until 15 days after transplantation. In the absence of brain injury, no clear migration of the particles was observed. When grafted in animals that previously underwent photothrombotic stroke, some migration of cells was seen. However, whether this was spontaneous migration along the less dense brain tissue in the corpus callosum or directed migration towards the stroke region is still being examined. That the labeled rMAPC did not migrate into the lesion may be due to the creation of scar tissue around the photothrombotic ischemic lesion (3). As unlabeled cells showed the same pattern, these studies demonstrate that cell labeling does not affect the ability of stem/progenitor cells to migrate in vivo.
In conclusion, our study highlights that it is necessary to evaluate the efficiency of cell labeling for every new cell-contrast agent combination whose fate is being followed in vivo. Secondly, the effect on biological behavior of cells should be examined. We here found an effect of labeling on the cell proliferation, but not differentiation, consistent with the fact that other investigators have demonstrated, for instance, effects of labeling on the in vivo distribution of MSC (34,37).
Although labeling of stem cells with MRI is promising, there are some limitations. First, more optimal particles are needed, which can be taken up by cells without need for potentially toxic transfection agents such as magnetoliposomes (44). A second problem is the dilution of the particle over time when cells divide. If the grafted cells continue to proliferate, this will lead to loss of signal in the majority of the graft. This problem is not seen in animal models with BLI, as labeling is due to stable transduction of a plasmid or vector in cells (49).
Footnotes
Acknowledgments
We would like to thank Tine Decuypera, Nathalie Feyaertsa, Sarah Mertensa, and Manja Muijtjensa for excellent technical assistance with cell cultures, cytogenetics and RT-qPCR. We are thankful to Guerbet, Roissy, France for the generous gift of Sinerem® and Endorem®. Annelies Crabbe is a research assistant of the Flemish Fund for Scientific Research (FWO Vlaanderen). Caroline Vandeputte is funded by a grant from the Institute for the Pro-motion of Innovation through Science and Technology in Flanders (IWT Vlaanderen). Angel Ayuso Sacido is supported by RETICS. We gratefully acknowledge the financial support by the European Commission for EC-FP6 network DiMI (LSHB-CT-2005-512146), EC-FP6-STREP-STROKEMAP, EC-FP7 network ENCITE (2008-201842), IWT (IWT-60838-BRAINS-TIM), and the K.U. Leuven Centers of Excellence “MoSAIC” and “SCIL.’ We thank Aneta Schaap-Oziemlak for her critical review of the manuscript.