
Abstract
Rapid loss of stemness capacity in purified prototype neural stem cells (NSCs) remains a serious challenge to basic and clinical studies aiming to repair the central nervous system. Based on the essential role of mesodermal guidance in the process of neurulation, we hypothesized that coculture of human NSCs (hNSCs) with human bone marrow-derived mesenchymal stromal stem cells (hMSCs) could enhance the stemness of hNSCs through Notch-1 signaling. We have now tested the hypothesis by assessing behaviors of hNSCs and hMSCs under systematically designed coculture conditions relative to monocultures, with or without Notch-1 manipulation in vitro. Our data demonstrate that expression levels of Notch-1 and Hes-1 as determined by immunocytochemistry are significantly higher in hNSCs cocultured with hMSCs than those of controls. Furthermore, coculturing significantly increases immunoreactivity of CD15, a neural stemness marker, but decreases CD24, a marker of neural/neuronal commitment in hNSCs. The effect is independent from the physical status of cell growth since coculture and notch signaling actually promotes hNSC adhesion. Importantly, coculture with hMSCs markedly augments hNSC proliferation rate (e.g., higher yield in G2/M phase subpopulation in a notch-dependent manner detected by flow cytometry) without diminishing their lineage differentiation capabilities. The results suggest that coculture of hNSCs with hMSCs enhances stemness biology of hNSCs partially via activation of Notch-1 signal transduction. Our finding sheds new light on mesoderm-ectoderm cell fate determination via contact-based hMSC-hNSC interactions and provides mechanistic leads for devising effective regimens to sustain and augment stemness of in vitro established hNSC and hMSC lines for basic science, translational and clinical applications.
Keywords
Introduction
Buoyed by biologic benefits of multipotency, neural stem cells (NSCs) and bone marrow-derived mesenchymal stromal stem cells (MSCs) have been established as plausible therapeutic agents to treat various neuropathological conditions such as spinal cord injury, ischemic stroke, Parkinson's disease, and amyotrophic lateral sclerosis (ALS) (22, 30, 36, 39-42, 49). However, lack of effective epigenetic approach to maintaining stemness has been an imposing barrier for translational research and application of human NSCs (hNSCs). Notch-mediated signaling was suggested to play essential roles in mesoderm guidance to the neurulation process by mediating the effect of mesoderm-derived MSCs on neural phenotypic commitment of ectodermal NSCs (10, 21, 43). Earlier coculture studies found a discernible influence of rodent MSCs (rMSCs) on rNSC fate via a contact-dependent mechanism that could strengthen lineage specification (20, 32). In addition, rMSCs preinduced to express neural antigens were shown to boost neurogenic destiny of cocultured rNSCs (6, 7). Also reported was that initiation of notch signaling promoted radial glial/neural stem identity in the embryonic murine brain (12), indicating Notch-1 and its ligands as key contact-dependent mediators in the central nervous system (CNS) development (11). We therefore hypothesized that the Notch-1 pathway might be a major mechanism through which hNSCs and hMSCs communicate to modulate their stemness biology through direct physical interactions, offering a potential epigenetic strategy for hNSC stemness enhancement. To test this hypothesis, we first established coculture models of human brain NSCs and adult human bone marrow-derived MSCs in vitro and systematically assessed the influence of cell-cell contact and notch signaling on hNSC stemness biology.
Materials and Methods
Propagation Cultures of hNSCs and hMSCs
Per methods we previously described (30, 39), primary hNSCs were dissociated mainly from the periventricular region of a cadaver telencephalon through a serial growth factor selection procedure to derive hNSCs that responded to both epidermal growth factor (EGF) and fibroblast growth factor (FGF) (Gibco/Life Technologies, Carlsbad, CA, USA) and reenter the cell cycle. This well-established line of hNSCs (i.e., HFB2050) was grown under 5% CO2/37°C in NB-B27 medium: neurobasal 96%, B27 supplement 2% (without vitamin A), penicillin/streptomycin 1%, l-glutamine 1%, heparin 8 μg/ml, basic fibroblast growth factor (bFGF; 10-20 ng/ml), leukemia inhibitory factor (LIF; 10 ng/ml), and EGF (20 ng/ml; Gibco/Life Technologies) (30, 39). The cells were regularly dissociated using Accutase (Invitrogen/Gibco) and propagated. The hMSCs provided by the Texas A&M Health Science Center College of Medicine Institute for Regenerative Medicine at Scott & White Hospital through a grant from NCRR of the NIH, Grant #P40RR017447 (27), were originally collected from a healthy 24-year-old male donor and grown in HG-DMEM (Gibco/Life Technologies) supplemented with 10% fetal bovine serum of MSC grade (Gibco/Life Technologies) and (100 U/ml) penicillin/streptomycin (Invitrogen) under 5%CO2/37°C. The cells were regularly dissociated using 0.25% trypsin/1 M EDTA (Gibco/Life Technologies) for passaging.
Stem Cell Coculture Settings
The coculture medium did not contain 10% FBS since serum factors could exert unpredictable effects on the stemness of both lines of cells. Instead, the cell viability of MSCs and NSCs was maintained by the components of a-MEM (Invitrogen/Gibco) plus bFGF, LIF, and EGF in the aforementioned concentrations. The low glucose level (5 mM) of α-modified MEM only pertained to the limited time periods and cell scales of the coculture study (e.g., relatively low cell numbers in coverslips, flask cultures fully terminated after each experiment, etc.) and not to the cell lines that were sustained by corresponding propagation medium detailed above. Importantly, the same coculture medium preparation was also used for monocultures of MSCs and NSCs plated on coverslips (Warner Instruments, Hamden, CT, USA) in 12-well plates (Corning Inc., Corning, NY, USA) or grown in experimental flasks. Thus, the medium formulation remained the same for coculture and the monocultures in all studies to avoid artifacts arising from differences in medium preparations.
The cells were plated on poly-d-lysine and fibronectin-coated coverslips in coculture. Coseeding was done 12-24 h after hMSCs or hNSCs were plated on coverslips in the presence of α-MEM (Invitrogen) with all three aforecited trophic factors. Plating density for hMSCs was ~1 × 10⁴/cm2 and that for hNSCs was ~2 × 10⁴/cm2 in cocultures. They were incubated under 37°C and 5% CO2 for 5 days before cell collection for the final data analyses. Alternatively, cocultures were carried out in T25 flasks (Corning Inc.) with the same cell densities for hMSCs and hNSCs, respectively. We used BD Biosciences 12-well plates (Franklin Lakes, NJ, USA) with each well having 1 ml medium (i.e., final volume) and T25 flasks that had 8 ml medium per unit.
Pharmacological Inhibition of Notch-1 Signaling
We used DAPT (Sigma-Aldrich, St. Louis, MO, USA), a γ-secretase inhibitor to inhibit Notch-1 signaling by blocking the γ-secretase complex responsible for the S3 cleavage to release the NICD domain (8). N- [N- (3,5-difluorophenacetyl)-1-alanyl]-S-phenylglycine t-butyl ester (DAPT) prepared in dimethyl sulfoxide (DMSO; Sigma-Aldrich) was added following 24 h of coculture to reach the working concentration of either 2 μM or 10 μM. Equal volumes of DMSO were added to control cultures (14). Briefly, 0.2 μl and 1 μl of 10 mM DAPT stock in DMSO was added to reach 2 μM and 10 μM DAPT dose per well of 1 ml total medium volume, respectively. The controls accordingly received 0.2 μl or 1 μl of DMSO per well, within the 0.1% (v/v) DMSO tolerance limit for common cell cultures.
Cell Differentiation Assay
hNSCs and hMSCs were cultured separately or cocultured together in either directly mixed culture (direct contact study) or on separate sides of porous culture inserts (transwell study) as detailed below. We used hMSC/ hNSC = 1:1 in coculture (hanging well insert, pore size 8 μm for six-well plates to allow direct contact between cell processes; Millipore, Billerica, MA, USA) and plated cells in density of 1 × 10⁴/cm2 in 12-well plates with hMSCs seeded on the top side of the culture inserts for 3 h in hMSC medium, followed with insert inversion and hNSC seeding. Cocultured cells and monoculture controls in parallel were incubated for 3 weeks with medium replenishment every 3 days before being digested using 0.25% trypsin (Invitrogen) and collected for differentiation studies using specific lineage induction medium (see details below). Transwell cocultures were carefully done to avoid cross-contamination. Collected cells were then plated on coated coverslips in 12-well plates in the same aforementioned density for all groups. hMSCs were grown in modified serum-free Corning® stemgro® hMSC medium (1:1 of neurobasal/stemgro medium). Cells were cultured for 3-4 weeks in each differentiation condition. Briefly, hNSCs were differentiated in neuronal differentiation medium (Neurobasal/B27/Glutamax=97:2:1, without FGF2 and EGF), oligodendrocyte differentiation medium (Neurobasal/B27/Glutamax/T-3=97:2:1:0.1), and astroglial differentiation medium (hNSC culture medium supplemented with D-MEM with N-2, GlutaMAX″-I, and FBS) (44). See details in http://www.lifetechnologies.com/us/en/home/references/protocols/neurobiology/neurobiology-protocols/differentiating-neural-stem-cells-into-neurons-and-glial-cells.html.
hMSC differentiation was performed by using the following assay kits purchased from Life Technologies: (1) Stempro adipogenesis kit, (2) Stempro osteogenesis kit, and (3) Stempro chondrogenesis kit (see details in http://www.lifetechnologies.com/us/en/home/life-science/stem-cell-research/stem-cell-culture/stem-cell-research-misc/msc-differentiation-kits.html)). We stained cells with Oil Red O for adipogenesis, Alizarin Red S for osteogenesis, and Alcian blue for chondrogenesis (all dyes were purchased from Sigma-Aldrich, St. Louis, MO, USA).
Immunocytochemical (ICC) Staining
Fixed cells were stained with primary antibody against nestin (1:250 anti-nestin IgG for NSC marker) and CD90 (1:250 anti-CD90 IgG for MSC marker) (both from Santa Cruz Biotechnologies, Santa Cruz, CA, USA) at 4°C overnight. The triplicate cell suspensions or coverslips from cocultures, and hNSC or hMSC monoculture control were incubated separately for 2 h with a mixture of FITC-conjugated anti-CD90 antibody (1:200-250, MSC marker; Santa Cruz Biotechnologies) and Alexa 617-conjugated anti-CD24 antibody (1:200, neural/neuronal differenitation commitment marker; Invitrogen) or a mixture of FITC-conjugated anti-CD105 antibody (1:200, MSC marker; Abcam, Cambridge, MA, USA) and PE-645-conjugated anti-CD15 antibody (1:200, neural stemness marker; Santa Cruz Biotechnologies). For immunoreactivity validation, a combinatorial mixture of both paired antibodies was used. The cells were washed with phenol-free, Ca2+-free, Mg2+-free 0.2% Tween (Sigma-Aldrich) in phosphate-buffered saline (PBS; Gibco/Life Technologies). The control suspensions were incubated with 0.2% Tween in PBS for 2 h. The cells were transferred to 5-ml polystyrene test tubes (BD Falcon; BD Biosciences, San Jose, CA, USA) at a density of 1 × 10⁶/ml.
To assess the effect of DAPT inhibition of notch signaling (3), cells were stained with rabbit anti-human Notch-1 (1:250; Santa Cruz Biotechnology) and rabbit anti-human or mouse Hes-1 (1:250; Millipore). The following antibodies were used for neural differentiation assays: hNestin (rabbit or mouse, 1:200; Millipore) for hNSCs; TUJ1 (rabbit, 1:200; Millipore) and NeuN (mouse, 1:100; Millipore) for immature and mature neurons, respectively; CNPase (mouse, 1:1,000; Sigma) and GALC (rabbit, 1:200; Millipore) for immature and more mature oligodendrocytes, respectively, and glial fibrillary acidic protein (GFAP) (rabbit, 1:2,000; DakoCytomation, Carpinteria, CA, USA) for astrocytes.
Population Doubling Time (PDT) Estimation
The images of the cells were systematically processed using Photoshop CS4. Cell numbers were quantified using ImageJ (version 1.44; NIH, Bethesda, MD, USA) combined with a cell counter plug-in. The hNSC/ hMSC ratios were determined as an average of the ratios from four sets of images for each coverslip/well in a row. PDT was estimated using an established formula for the “exponential growth ” model since we optimized the condition and time for hNSC and hMSC growth (i.e., for the given study observation period, resources were theoretically unlimited): Nt=Noert and t2=0.693/r where Nt=population size at time t; No=original population size, r = intrinsic rate constant for the exponential phase of the cell division, t=cell incubation time, and t2=PDT estimate (see details in http://web.mit.edu/7.01x/7.014/pdfs/Lecture13-slides.pdf).
Analysis of Physical Condition of Cell Growth
Since growth and differentiation of stem cells often demand physical adhesion of the cells to surrounding extracellular matrix molecules (41), cell spreading/attaching was analyzed using ImageJ. The hNSCs and hMSCs assigned for cell process spreading measurement were randomly chosen to avoid sampling bias. The cell adhesion and attachment scale was computed based on total areas occupied by the targeted type of cells (i.e., total number of pixels of the area under 10× magnification). The monocultures were used as baseline morphology references to determine the cell types in cocultures and vice versa.
Confocal Imaging
After ICC staining and 3× washing, the coverslips were mounted on slides with 4′,6-diamidino-2-phenylinodole (DAPI) (Vectashield; Vector Labs, Burlingame, CA, USA) and observed under a Carl-Zeiss camera (Axiovert 200; Zeiss US, Peabody, MA, USA) at proper magnification, fluorescent z-stack images of the ICC outcome were captured via the Zeiss LSM1 confocal microscope and Zen software (Carl Zeiss Microimaging). ImageJ (NIH) and Photoshop (Adobe) were used to process the images and quantify the percentage of each labeled markers (n=3-5 wells/group) in the total cell population. The percentage of each cell lineage marker in the total cell population was used as the index of differentiation level for each hNSC differentiation lineage. For hMSC differentiation, the levels of adipogenic lineage differentiation were represented as the percentage of cell population with positive staining outcome versus the total cell population. For chondrogenic and osteogenic lineage differentiation, the positive staining area was measured by Photoshop CS4 after signal intensity and view field calibrations. For morphometric analysis, the cells were stained with Toluidine blue (Sigma-Aldrich).
For suspension preparations, an aliquot of cells was taken from cocultures stained with antibody combinations for CD24-CD90 (1:200-250) or CD15-CD105 (1:200) or both. The cells were gently smeared onto the slides and coverslipped. The cells were observed under a 40× water immersion C-apochromat objective lens (1.2 NA) under a confocal laser microscope (Axiovert S 100 inverted LSM; Carl Zeiss Inc.) stationed on an antivibration table. The stained cells were visualized in red (DsRed: 633 nm) and green (GFP channel: 543 nm) channels under excitation by 514 nm and 488 nm argon lasers, respectively. The images were acquired using Zen software of Carl Zeiss Inc.
Semiquantification of Relative Fluorescence Intensity for Cell ICC Images
The ICC fluorescent images were first processed in ImageJ to remove background contamination of each individual image by standardizing the brightness and contrast values of positive stain pixel inclusion for all representative images of each study group in standardized size. The relative fluorescence intensity values were then calculated as percentages of the saturation fluorescence intensity using the histogram program of ImageJ where the saturation intensity value was set numerically at 255. The one-way ANOVA and Tukey's post hoc test or Student's t-test were used for comparing data among multiple groups and between two groups, respectively. Group values are expressed in mean ± SD and statistical significance was set at p < 0.05.
Propidium Iodide (PI) Staining and Analysis
The fixed cells were washed with 1× PBS twice and subsequently permeabilized with Na2HPO4 (Sigma-Aldrich) in Triton X-100 (Sigma-Aldrich) at pH 7.8. The DNA was stained with PI (Gibco/Life Technologies) in DNAse-free RNAse. The cells were washed twice with 1× PBS and resuspended at a density of 4 × 10⁵ cells/ml. The stained cells were then analyzed using BD FACSCalibur at 288 V, FL-2H voltage at 2,000 counts/s flow rate (medium flow rate). The gates were set based on the unlabeled control cell suspensions and ICC of cell samples (31).
Flow Cytometry
The surface antigen-stained cells were systematically examined using a flow cytometer, FACSCalibur (BD Biosciences), and analyzed using FACStation software (BD Biosciences) as described previously (29). The fluorochromes were excited with 488-nm and 635-nm lasers; green fluorescence was detected by 560SP and 530/30 filters in the green channel and red fluorescence by 640LP and 661/16 filters in the red channel. Fluorescence was determined by analyzing and gating against unstained controls at identical passage. hNSC control populations were gated to count a minimum of 250 events/s; hMSC control populations were set to a gating of 15-20 events/s; and the cocultures were gated to count 2,500 events/s and processed to obtain comparable reading measures. Please see Results section for details about the SSC and FSC scales used. The fluorescence detector voltage gain was initially set at 500 V with a threshold voltage of 50 V, which was gradually decreased to 200-300 V until the cell populations were placed within the linear dynamic range in order to optimally measure the brightness of the chromogen used for immunolabeling the target cells. All flow cytometer analyses were repeated three times for consistency check in the scatter plot obtained. Gating sensitivity was defined at the level that probability of false-positive detection <0.5% when running negative control samples. The flow rates were set between 20 and 35 μl/min with a sheath fluid pressure of 4.5 PSI.
Results
Identification and Proliferation Rate of Cocultured hNSCs and hMSCs
To set up tangible coculture systems, we first established cell markers and morphological criteria that could be applied to specifically identify hNSCs and hMSCs. The postfixed cells were stained with anti-nestin (NSC marker) and anti-CD90 (MSC marker) after 24 h or 5 days of coculturing. Confocal microscopic analysis confirmed that antibodies we used for ICC of specific markers did not cross-react between the two well-characterized and widely used stem cell types (Fig. 1A-E). For further morphological verification, the cocultured cells were stained with Toluidine blue and counted in three sampled regions per coverslip, which showed distinct morphologic differences between the hNSCs (i.e., more spindle-like bipolar or multipolar cells with larger ratio of cell process length/cell body) and hMSCs (i.e., larger, multipolar, and squamous-appearing cells) (Fig. 1F-J). The data confirm that it is proper to use nestin and CD90 as primary markers and cell size difference for ICC identification and cell sorting of hNSCs and hMSCs, respectively, for the study.

Immunocytochemical detection and PDT of hNSCs and hMSCs. ICC of nestin (NSC marker, red) and CD90 (MSC marker, green) shows high specificity. (A) Coculture of hNSCs over preplated hMSCs (note: hMSCs grow in lower density and more patched manner than hNSCs; also see C); (B) coculture of hNSCs mixed with hMSCs; (C) coculture of hMSCs over preplated hNSCs; (D) hMSC monoculture; (E) hNSC monoculture (scale bar: 20 μm in A-E). (F-J) Toluidine blue stain shows distinct morphologies of hNSCs and hMSCs, respectively. (F) hNSCs seeded over hMSCs; (G) hNSCs coseeded with hMSCs; (H) hMSCs seeded over hNSCs; (I) hMSC monoculture; (J) hNSC monoculture (red arrows: hNSCs; green arrows: hMSCs; brown box: hNSCs and MSCs in close contact; scale bar: 60 μm in F-J). (K) PDT estimates were calculated from the beginning and end cell numbers using formula specified in Materials and Methods (mean ± SD). Coculture of hNSCs and hMSCs markedly increased hNSC proliferation rate: the average PDT of cocultured hNSCs is ~3.8 (NoM: hNSCs plated over hMSCs) and ~4.5 days (MoN: hMSCs over hNSCs), significantly shorter than ~6.3 days of monocultured hNSCs (*p < 0.05, one-way ANOVA with Tukey's post hoc test; n = 4/group). By contrast, the mean PDT of hMSCs did not change significantly under different culture settings, only manifesting a trend of reduction in coculture versus monoculture (M).
We next examined whether altered sequential orders of cell plating could affect cell proliferation outcomes of the hNSC-hMSC cocultures. There were no statistically significant differences in the hNSC/hMSC ratio changes between the coculture settings where hNSCs or hMSCs were plated onto the coverslips in different orders (i.e., hNSCs plated over hMSCs, hNSCs coseeded with hMSCs, or hMSCs plated over hNSCs; p > 0.05, one-way ANOVA; data not shown). However, coculture in either order of cell seeding (hNSCs over hMSCs or vice versa) significantly reduced the PDT estimates of the cocultured hNSCs compared with monocultured hNSCs, suggesting an augmented proliferation rate of cocultured hNSCs, an important feature of stemness biology (41). By contrast, the same processes did not significantly change PDT values of hMSCs (p < 0.05, one-way ANOVA with Tukey's post hoc test) (Fig. 1K).
The Effect of Notch-1 Blockade by DAPT on Cocultured hNSCs and hMSCs
To test whether the coculture-increased hNSC proliferation rate (Fig. 1K) was dependent on cell-cell contact and Notch-1 signaling, phase contrast imaging was used to analyze live cell cultures under the effect of DAPT, a prototypic inhibitor of Notch-1 signaling pathway (see Materials and Methods for details) (8). We observed that DAPT exposure triggered a statistically significant surge of cell process retraction (Fig. 2A) with subsequent loss of cell adhesion (Fig. 2B) and abolished the augmenting effect of coculturing on cell proliferation rate of hNSCs (n=4) (i.e., PDT=6.5 ± 0.9 days, similar to that of hNSC monoculture shown in Fig. 1K). The cell detachment outcomes (i.e., the average number of floating cells per field of view) were significantly dependent on DAPT concentrations in the culture medium (Fig. 2C) and consistent with previous reports on the effect of DAPT on initiating vascular endothelial cell dissociation (18). ICC assays showed that DAPT treatments significantly reduced the expression levels of Notch-1 and its downstream factor Hes-1 in hNSCs (Fig. 3A, B), relative to the DAPT-free coculture controls (Fig. 3A), which confirms blockade of Notch-1 signaling by DAPT exposure. To examine if DMSO in DAPT preparation contributed to the observed effect of DAPT on expression levels of Notch-1 and Hes-1, we treated hNSC and hMSC monocultures with the same volume of DMSO and found that the DMSO exposure actually resulted in a slight upregulation of Notch-1 and Hes-1 immunoreactivity in the monocultured hNSCs only (Fig. 3C), suggesting that the inhibitory effect of DAPT on hNSC proliferation rate, a parameter of stemness, is realized through diminishing Notch-1 signaling and Notch-1 receptor expression, and not via triggering physical detachment since “floating cell spheres ” are considered as a more favored status for maintaining stemness (41). The outcome is consistent with studies published earlier that showed that DAPT treatment blocked Notch-1 signaling by preventing activation of other downstream events such as Hes-1 and by direct mitigation of Notch-1 receptor expression in neurons (3). Taken together, the pilot results show that there is an elevation in Notch-1 receptor levels and, consequently, of that of Hes-1 expression, in hNSCs cocultured with hMSCs rather than in monocultures. Future studies should further verify the effect of DAPT by using molecular assays including RT-PCR and Western blot.

Treating hNSC and hMSC cocultures or monocultures with DAPT, a Notch-1 inhibitor. (A) Red circles mark floating/detached cells (scale bar: 60 μm). (B and C) graphs (mean ± SD) show a DAPT dose-dependent effect on triggering reduction in cell attachment and increase in numbers of floating cells per view field, respectively, compared with equivolume DMSO-treated cells as controls. hNSCs-hMSCs: hNSCs coplated with hMSCs in the coculture. Horizontal bars above the histogram data sets in B and C indicate that p < 0.05 (one-way ANOVA; n = 3/group; note: due to the focus on the general effect of DAPT, no further post hoc analyses were performed), which demonstrates that there is an overall significant impact of DAPT on cell process retraction and cell detachment.
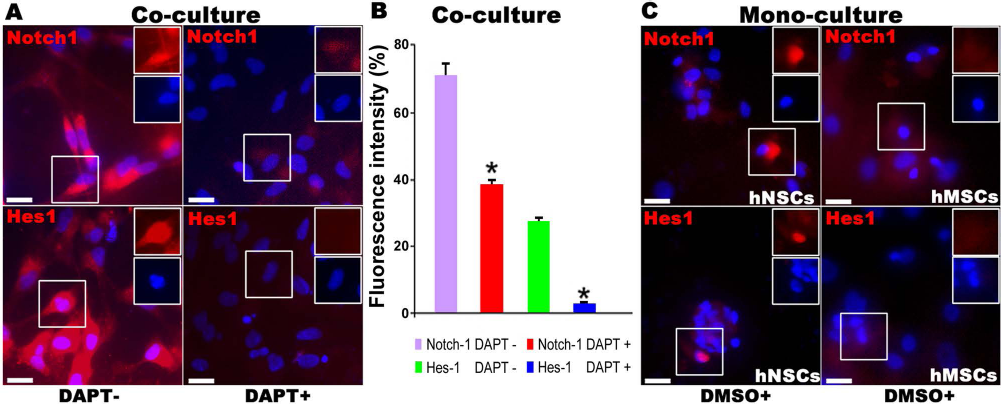
Effect of DAPT treatment on levels of Notch-1 and Hes-1 expressions. (A) DAPT treatment (10 μM) results in significantly reduced Notch-1 and Hes-1 levels in hNSC-hMSC cocultures, compared with DAPT-free control cultures. (B) Relative fluorescent intensity profiles (unit: % of saturation intensity; mean ± SD) of Notch-1 and Hes-1 immunoreactivities in the confocal images of the cocultured cells. There are significantly reduced levels of Notch-1 (red) and Hes-1 (red) ICC intensities following DAPT treatment (*p < 0.05, Student's t-test; n=4/group). (C) Images of hNSC (left) or hMSC (right) monoculture show expression levels of Notch-1 and Hes-1 with DMSO exposure. ICC image verification (C: hNSCs in left column vs. hMSCs in right column) suggests that Notch-1 and Ness-1 are mainly expressed by hNSCs; DMSO treatment slightly increased expressions of Notch-1 and Hes-1 in hNSCs. Scale bars: 20 μm. Note: the Hes-1 expression is detected in either cytoplasm (insets in A) or nucleus (insets in C; nuclear stain with DAPI in blue), an outcome that is consistent with what reported before, suggesting that Hes-1 expression has a pattern of oscillatory dynamics depending on the developmental status and/or specific signaling received by the cells (17, 25, 38).
The Effect of Coculture on Expression of Stemness Markers in hNSCs
For determination of expression changes of stemness markers (i.e., cell developmental phase-specific cluster of differentiation antigen) in hNSCs set in motion by coculturing with hMSCs, confocal images of NSC-specific markers of CD15 (i.e., a marker of early stemlike NSCs) and CD24 (i.e., a marker of neural/neuronal lineage-committed neural progenitor cells) and MSC stemness markers (CD90 and CD105) were performed to determine the developmental status of the two cell types (Fig. 4A, B). We first confirmed that there were highly selective expressions of CD15 and CD24 in hNSCs and CD90 and CD105 in hMSCs, offering a reliable approach to specifically identifying the two cell types via confocal imaging. Subsequent analyses determined that there were significantly increased levels of CD15 expression in hNSCs cocultured with hMSCs (Fig. 4C, upper left), compared with monocultured hNSCs post-same duration of incubation (Fig. 4C, lower left); by contrast, CD24 expression levels were found much lower in cocultured hNSCs (Fig. 4C, upper right) relative to monocultured hNSCs (Fig. 4C, lower right); the differences were statistically significant (p < 0.05, paired Student's t-test) (Fig. 4D). Therefore, the results suggest that coculture with hMSCs enhanced sustainability of hNSC stemness marker expression, rendering them multipotent (i.e., less committed for neural and neuronal differentiations).

Confocal images of stem cell marker expression in hNSC and hMSC adhesion cultures. Confocal z-stack images of ICC stains of CD15 (red) and CD105 (green; A), or CD24 (red) and CD90 (green; B) show selective expressions of CD15 (a neural stemness marker) and CD24 (a neural/neuronal lineage commitment marker) in hNSCs and selective expressions of CD90 and CD105 (MSC stemness markers) in hMSCs (scale bar: 20 μm; sporadic yellow color is caused by overlap of much more flat green hMSCs and red hNSCs). (C) Expressions of CD15 and CD24 (both shown in red) in cocultured and monocultured hNSCs, respectively. Whereas higher CD15 and lower CD24 levels are observed in the cocultured hNSCs, a reversed order of expression levels of CD15 and CD24 is demonstrated in the monocultured hNSCs (scale bars: 60 μm). (D) Semiquantified immunoreactivity levels measured by relative ICC fluorescence intensities in the hNSCs (mean ± SD). There are significant differences between CD15 (^) and CD24 (*) expression levels in the hNSCs under monoculture versus coculture with hMSCs (p < 0.01, Student's t-test; unit: % of saturation intensity; n = 10/ group; see more details in Materials and Methods).
Cell Cycle Profiles Assessed by Flow Cytometry
We next assessed whether hNSCs cocultured with hMSCs would demonstrate an increased subpopulation of G2/M phase cells in a large sample study using cell culture suspensions, to further confirm the aforedescribed coculture impacts on enhancing hNSC stemness biology (Fig. 1). Indeed, flow cytometry data showed a discernible increase in the G2/M phase population of the cocultured hNSCs stained with PI for measuring DNA content, as their fluorescence counts (i.e., the altitude of the second wave in Fig. 5A) reached levels close to those of the G1/G0 phase cells (i.e., the first wave in Fig. 5A), much higher than that observed in monocultured hNSCs (Fig. 5C) after the same culturing period. The data, consistent with the PDT data in Figure 1K, suggest that cells in cocultures have a higher proportion in proliferation phases than monoculture controls. Importantly, Notch-1 signaling inhibition with 10 μM DAPT triggered a drastic decrease in G2/M phase population in the cocultured hNSCs and in monocultured hNSCs as well (Fig. 5B and D). Similar impacts were not observed in cocultured or monocultured hMSCs (data not shown). The outcomes summarized in Figure 5A-D in combination with those in Figure 3 support our hypothesis that hNSC and hMSC coculture enhances hNSC stemness biology partially through Notch-1 signal transduction pathway. However, because peaks of cell cycle distribution detected are rather wide, future studies should include additional methods (e.g., BrdU or EdU incorporation assay) to more precisely measure cell cycle entry.
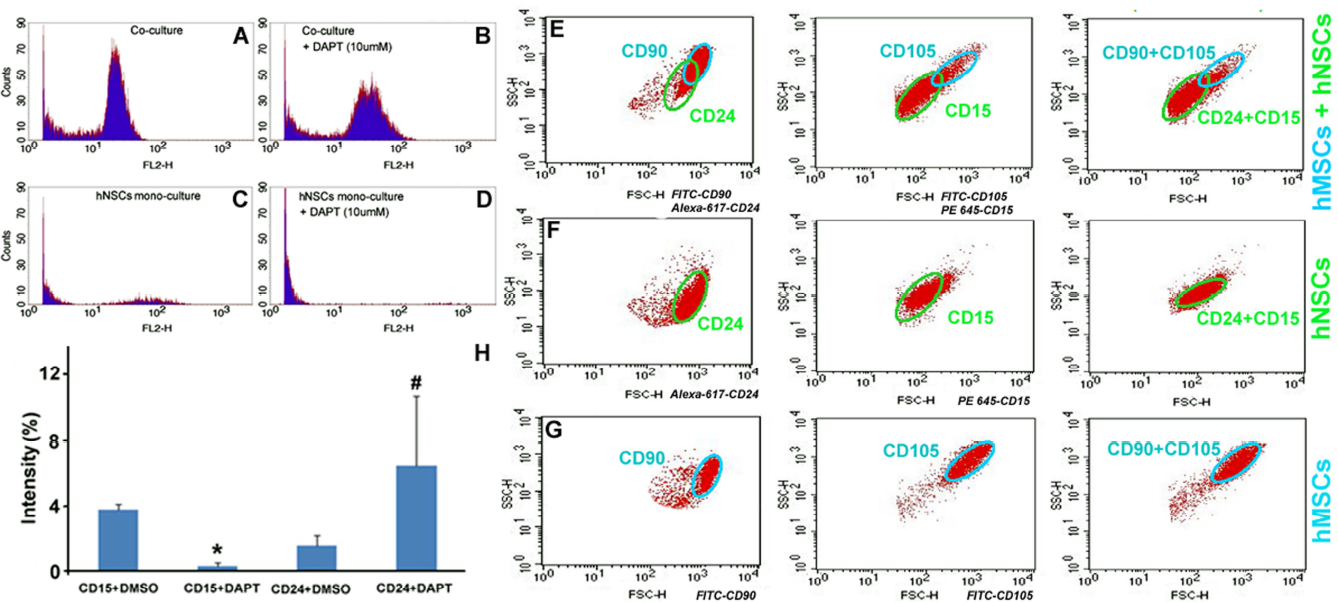
Flow cytometry analyses of cell cycle, stemness, and notch-dependent development of hNSCs and hMSCs in suspension preparations. Counts represent the number of fluorescent sources for a particular intensity of red fluorescence labeled along the x-axis (FL2-H is the designated channel for red fluorescence in BDFACS). There is a marked increase in the G2/M phase population for the cocultured cells, as their fluorescence counts (i.e., the altitude of the second wave in A) reached levels close to those of the G1/G0 phase (i.e., the first wave in A), much higher than those observed in monocultured hNSCs (C). Notch signaling inhibition with 10 μM DAPT treatment results in a dramatic decrease in G2/M phase population of cocultured cells and monocultured hNSCs as well (B and D). Since hMSCs after 5 days monoculture only showed negligible levels of G2/M population relative to hNSCs (data not shown), the altitudes of the second waves in A and B are likely formed mainly by hNSC counts. (E-G) The coculture and monoculture suspensions were treated with anti-CD24 (a neural/neuronal differentiation marker) and anti-CD90 (a MSC stemness marker) antibody mixture, anti-CD15 (a neural stemness marker) and anti-CD105 (a tripotency-committed MSC marker) mixture or all in combination. The graphs depict the different profiles for cocultures (E) and monocultures (F: hNSCs; G: hMSCs), and differentiate cell types and stemness profiles by validated attributes across representative ICC markers in combination with characteristic size differences between the two cell types (green circle: hNSCs; blue circle: hMSCs). Compared with monocultures, there is gain in CD15 levels combined with reduction in CD24 expression in cocultured hNSCs; coculturing also reduces CD105 expressions in hMSCs with CD90 immunoreactivity remaining largely unchanged. (H) Cocultured hNSCs and hMSCs in flasks were treated with 10 uM DAPT or DMSO following the standardized protocols (see Materials and Methods). The cell suspensions were then stained and imaged separately for quantifying CD15 and CD24 immunoreactivity levels. The fluorescent intensities (%; mean ± SD) are obtained by using ImageJ histogram program. DAPT treatment significantly decreases and increases expression level of CD15 (*) and CD24 (#) in cocultured hNSCs, respectively (p<0.05, paired Student's t-test; n = 4/group). Please see Materials and Methods for the excitation and detection setting details of the antibody fluorochromes used.
Flow Cytometry Assessment of Stemness Marker Expression in hNSCs Cocultured with hMSCs
To further validate ICC observations made in Figure 4, we determined and set the flow cytometer gates for specifically identifying hNSC and hMSC subpopulations expressing stemness markers of different developmental stages (i.e., CD14 vs. CD24 and CD90 vs. CD105, respectively) in the cocultures using cell suspensions. All cocultured stem cells were harvested from T25 flasks and washed, fixed, and ICC stained for CD15 and CD24 in combination with CD90 and CD105 (see above and Materials and Methods for cell marker specifics) in order to specifically evaluate the stemness profile of hNSCs in the cocultures versus monocultures in large cell quantities (Fig. 5E-G).
This approach was newly devised since no established formula was available for directly using a flow cytometer to separate hNSCs from hMSCs under different developmental stages for coculture settings like ours. Based on ICC and morphologic profiles we established for the two types of stem cells (Figs. 1 and 4), hMSCs (defined by the ICC detection of CD90) (Fig. 1A) were larger and more squamous/spread out than hNSCs (defined in Fig. 1). We marked the population with bigger cell sizes as hMSCs, typically between 102 and 104 in both side scatter (SSC) and forward scatter (FSC) scales, and those of smaller cell sizes as hNSCs, typically between 101 and 103 in SSC and 102 and 104 in FSC scales (please see Materials and Methods for details regarding the detector's voltage settings). Subsequent microscopic examination of cells collected from each size section validated our formula (data not shown). We found that cocultured hNSCs in suspensions also exhibited an expression profile that was high in CD15 and low in CD24 immunoreactivity (Fig. 5E vs. F), whereas cocultured hMSCs had reduced expression of CD105 (Fig. 5G) compared with monoculture controls. The results suggest that hMSCs cocultured with hNSCs might have also delayed their tripotent (osteo-chondro-adipoblast) mesenchymal progenitor commitment. Published work showed that osteo-chondro-adipogenesis committed mesenchymal stromal progenitor cells expressed CD105 and CD166 markers (47). Future studies should investigate this possibility by adopting longer experiment durations. The statistically significant differences between the two culturing conditions suggest that hNSCs (and to a lesser degree, hMSCs) had enhanced stemness capacity as determined by expression of developmental stage-specific markers under coculture compared with monoculture. Importantly, the CD15 expression level was also abrogated in cocultured hNSC suspension preparations following DAPT treatment that again markedly increased CD24 expression and the differences were statistically significant (Fig. 5H). Overall, these results collected from flask-housed cells demonstrate that coculturing hNSCs and hMSCs strengthens stemness biology of hNSCs and DAPT-triggered disruption of Notch-1 signaling mitigates stemness capacity of the cocultured hNSCs, pushing them further toward commitment of neural/neuronal differentiations (4, 29).
The Effect of Coculture on Lineage Differentiations of hNSCs and hMSCs
We lastly investigated lineage differentiation potential of cocultured hNSCs and hMSCs to determine whether the Notch-1-mediated impact truly augmented stemness biology of hNSCs not only by boosting self-renewal capability (i.e., reducing PDT and increasing G2/M subpopulation) but also by enhancing phenotypic differentiation capacity, a key feature of stem cells via a conventional ICC approach due to sample size limit (41). Per assay specifics detailed in Materials and Methods plus cell density justification for the quantification process, we observed that hNSCs demonstrated largely comparable levels of neural differentiation under mono- and coculture conditions, with a small, but significant, increase in early neural differentiation for post-coculture hNSCs (TUJ1+; p=0.0014, Student's t-test; n=5/group). There was no discernible change in mature neuronal marker expression (NeuN+; p=0.3141, Student's t-test; n=5/group), suggesting a slightly, but definitively faster onset of neuronal differentiation under coculture conditions. hNSCs showed a similar trend of change in oligodendroglial differentiation, in which coculture led to a significantly faster onset for immature oligodendrocyte marker expression (i.e., CNPase+, p = 0.0346; n = 5/group) with more mature oligodendrocyte marker GALC expression remaining similar between the two conditions (p=0.5172; n=5/group). However, levels of astrocyte differentiation as assessed by expression of mature astrocytic marker GFAP were statistically indiscernible between coculture and monoculture hNSCs (p = 0.1179; n = 5/group) (Fig. 6A, B).

Effect of coculture on lineage differentiation capacity of hNSCs and hMSCs. (A) Confocal z-stack images assembled at the most informative plane level of each stain show immunocytochemistry data of representative lineage differentiation markers expressed by hNSCs under either mono- or coculture condition (green: hNestin for hNSCs; red: TUJ1 for immature neurons, CNPase for immature oligodendrocytes, GALC for more mature oligodendrocytes, and GFAP for astrocytes, respectively; and yellow: partial overlap of red and green cells and/or differentiating cells expressing both specific phenotypic markers and residual hNestin). Monocultured hMSCs serve as controls. Except for few cells with hNestin and/or TUJ1 expressions, hMSCs are negative for CNPase, GALC, or GFAP (9). (B) Histogram semiquantitative results (mean ± SD; see Materials and Methods) demonstrate that coculture with hMSCs maintains lineage differentiation capacity of hNSCs with a further enhancement of neuronal and oligodendroglial differentiations (i.e., a significantly increased immunoreactivity of TUJ1 and CNPase, respectively; *p < 0.05; paired Student's t-test). About 4-7% of monocultured hMSCs are hNestin positive and 9-12% of them expressed TUJ1 with negligible detection of any CNPase, GALC, or GFAP (C/G/G) signal, an outcome that is consistent with what has been reported (9). (C) After coculture with hNSCs, hMSCs show reduced rates in differentiating into adipocytes (i.e., fewer cells with Oil Red O-stained lipid vacuoles; upper panel) and osteocytes (i.e., reduced extent of Alizarin Red S staining; middle panel). By contrast, coculture increases hMSC differentiation into chondrocytes (i.e., more chondrogenic matrix formation stained by Alcian blue; lower panel). See right column for statistics (mean ± SD; *p < 0.01; paired Student's t-test). Scale bars: 20 μm (A) or 80μm (C); n = 5/group.
Interestingly, following coculture with hNSCs, hMSCs showed significantly decreased capability of adipogenesis compared with monoculture hMSCs, as determined by Oil Red O staining (i.e., 6.70 ± 3.90% vs. 46.20 ± 5.16; Student's t-test, p < 0.01, n=5/group). Capacity of osteocyte lineage differentiation was also reduced, which was indicated by mitigated group mean of calcium deposition (optical density of Alizarin Red S: 0.183 ± 0.015 mm2 vs. 0.346 ± 0.027 mm2, p < 0.01, n = 5/group). By contrast, Alcian blue staining demonstrated more chondrogenic matrix formation in cocultured hMSCs compared with the monoculture control group (0.031 ± 0.002 mm2 vs. 0.010 ± 0.002 mm2, p < 0.01, n = 5/group) (Fig. 6C). Together, the data suggest that coculture with hMSCs under our regimens does not significantly alter neural lineage differentiation capacity of hNSCs besides a discernible enhancement. Conversely, after coculture with hNSCs, hMSCs showed differentiation profile changes with an augmented differentiation preference toward chondrogenic development that should be systematically studied in the future.
Discussion
Our data demonstrate that coculture with hMSCs significantly increases the expression level of CD15, a neural stemness marker, but decreases CD24, a marker of neural/neuronal differentiation commitment of hNSCs. Cocultured hNSCs show definitive augmentation in their proliferation capability as shown by significantly reduced PDT; flow cytometry analysis of cell cycles reveals that cocultured hNSCs have much higher yield of G2/M phase subpopulation in a Notch-1-dependent manner, compared with monocultured hNSCs. Moreover, the Notch-1 and Hes-1 expression levels are significantly higher in hNSCs cocultured with hMSCs than monoculture controls. Importantly, coculture with hMSCs maintains and further boosts lineage differentiation capacity of hNSCs. The results derived from both adhesion and suspension cell assays of our pilot study suggest that coculture of hNSCs with hMSCs enhances stemness biology of hNSCs partially through Notch-1 signaling.
Earlier work using rodent stem cells showed that rNSC-rMSC coculture could influence proliferation and differentiation of both cell types (20, 46). Similar to what we observed, the PDT analysis depicted a noticeable increase in proliferation rates of both rNSCs and rMSCs, and there was a large increase in the G2/M phase cell population in cocultures than in monocultures. The reports concluded that the interaction between rMSCs and rNSCs exerted mutual impact on each other. Interestingly, the reported cell proliferating rate measured by PDT estimates appeared to be affected by different regimens of cell seeding orders, with shortest PDT for rMSCs exhibited in settings where hNSCs were seeded 24 h post the initial rMSCs plating and with shortest PDT for rNSCs observed in cocultures where rMSCs were seeded 24 h after rNSCs seeding. However, in our study, either seeding order for cocultures significantly affected PDT of hNSCs only, not hMSCs (Figs. 1-3). This difference may be explained by the unique cell biology of hMSCs that unlike rMSCs, adult human bone marrow-derived MSCs primarily produce notch ligands, not Notch-1 receptor, and they consequently do not manifest Hes-1 upregulation when cocultured with either human hematopoietic stem cells or rNSCs and may require longer time to express Notch-1 in vitro (1, 33, 37). Conversely, it is not immediately clear what caused delay of tripotency commitment and boosted chondrogenesis of hMSCs cocultured with hNSCs (Figs. 5 and 6). In addition to possible influence of cell density (i.e., hMSC monocultures had much less final densities relative to cocultures), another plausible mechanism could be the regulatory ability of hNSC microRNAs on TGF-β1 signaling (34) that can affect both hMSC stemness (5) and chondrogenic differentiation (51).
In the present study, the augmenting impact of coculture on cell proliferation indicates stemness biology enhancement for hNSCs. Previous flow cytometric data based on human embryonic cell experiments demonstrated that CD15 was a marker of neural stemness and CD24 expression could be an indication for neural/neuronal differentiation commitment, particularly when used in combination in a screen regimen of CD15/CD29/CD24 (29). Since we used two well-validated cell lines of hNSCs (39) and hMSCs (27), it was deemed more efficient to initially adopt CD15 and CD24 as a pair of markers to help determine developmental stages of NSCs, although future studies need to expand numbers of cell developmental markers included to further determine hNSC developmental status for collecting more detailed information (29). Indeed, the mean immunoreactivity level of CD15 was increased, and CD24 expression was downregulated in hNSCs under our coculture settings, when compared with monocultured hNSCs (Fig. 4). The results suggest that coculturing hNSCs with hMSCs enhanced stemness capacity of hNSCs by better maintaining stemness stage biological characteristics. Our finding is consistent with a previous article (12) in which the notch pathway involvement was confirmed in promoting neurogenesis in murine forebrain development and with the report that inhibition of a Notch-1 downstream target, Hes-1 in NSCs could stop hNSC proliferation and induce neuronal differentiation (17).
It was shown that Notch-1 inhibition disrupted substrate attachment of the cells (18). Earlier flow cytometry studies also demonstrated a decrease in G2/M phase subpopulation in cells following treatment with DAPT, a prototypic notch signaling inhibitor (45). Together these data additionally validate that the Notch-1 pathway is actively involved in cell adhesion and proliferation. We have now established that DAPT treatment, via Notch-1 inhibition, dose-dependently mitigates cell surface spreading and cell-cell contact interaction between cocultured hNSCs and hMSCs (Fig. 2). Furthermore, we found that coculturing enhanced hNSC stemness (i.e., cell proliferation: Figs. 1 and 5; stemness marker CD15 upregulation and CD24 downregulation: Figs. 4 and 5; and enhanced differentiation capacity: Fig. 6) partially through Notch-1 dependent signaling, as DAPT exposure could abolish such outcomes (Figs. 2, 3, and 5). Interestingly, it was suggested that the trophic factors secreted by stem cells could also play a vital role in regulating stemness capacity of the cells (2, 20, 41). We are keen to investigate this perspective in our upcoming projects as another mechanism underlying functional multipotency of stem cells (41).
Recent studies revealed presence of gap junctions between donor or endogenous stem cells (e.g., NSCs and MSCs) and surrounding postdevelopment cells; such direct cell-to-cell communication carries crucial functions, including homeostasis conservation and cell cycle regulation through gap junction-transferred microRNAs (16, 19). We first reported that implanted hNSCs interact with host cells via functional gap junctions (16). Therefore, it is very valuable for future studies to examine whether gap junctions are involved in the contact-dependent modulation of stemness for hNSCs and hMSCs in vitro and in vivo. On the other hand, exosome-channeled mRNA and miRNA exchange between cells has been proposed as a probable trigger for paracrine regulation of cell differentiation (48). As an example, the Epstein-Barr virus latent membrane protein 1 is expressed in multiple types of human tumor cells and has been detected in exosomes to affect cell growth (23). Since we used the field's well-certified hNSC and hMSC lines that are free of virus and other pathogens (27, 33, 39), it is very unlikely that the aforecited exosome mechanism played any role in our coculture assays. Future studies, however, should further examine possible effects of exosome-channeled mRNA and/or miRNA exchange between hNSCs and hMSCs on stemness biology, in addition to the Notch-1 signaling impact described in the current report (48).
One of the challenging issues for prototype NSC-based implantation studies is poor donor survival, proliferation and differentiation in vivo, especially in the adult mammalian CNS (35, 50). We postulate that a primary factor for the very limited posttransplantation fate of nongenetically modified stem cells in the spinal cord or brain is, besides a mostly hostile host environment, the highly nonphysiologic conditions they experienced during the propagation and preparation processes in vitro. Basic research conventionally requires that the cells be maintained in an utterly purified status that is drastically different from their developmental niches where they interact with other types of cells constantly (1, 10). Therefore, restoring the microenvironment to partially emulate developmental niches may fundamentally strengthen donor viability and differentiability (35); our hNSC and hMSC coculture regimens may provide a powerful strategy to enhance donor hNSC (and hMSC) sustainability posttransplantation via boosting their stemness biology. It is conceivable that Notch-1 activation can induce proliferation of the hNSCs and simultaneously promote radial glial cell (i.e., a type of NSCs) identity of other developing CNS cells to increase NSC lineage restrictive population for neural repair (11, 12, 28). Furthermore, the coculture approach could be synergistically augmented by pharmacological curbing of host pathophysiologic insults to donor cells in postneurotrauma and neurodegeneration cases (50). Future translational studies aiming to enhance stemness capacity of NSCs must carefully strike a delicate balance among proliferation induction, stemness enhancement, and lineage commitment (13, 15, 24, 28, 35, 41, 50). In summary, our finding sheds new light on mesoderm-ectoderm cell fate impact (e.g., neural crest cell specifications) (26) via contact-based hMSC-hNSC interactions and provides mechanistic leads for devising effective regimens to sustain and augment stemness of in vitro established hNSC and hMSC lines for basic science, translational, and clinical applications.
Footnotes
Acknowledgments
The work was supported by merit grants provided by VA RR&D, CIMIT-DoD, and the HeadNorth Foundation to Dr. Teng. Mr. H. Haragopal was partially sponsored by CICD, BWH, and Sastra University, India, for his senior thesis project completed under Dr. Teng's mentorship. Dr. I.B. Han was partially supported by a training grant from Department of Neurosurgery, Cha University, Korea. The authors declare no conflict of interest. H.H, D.Y, X.Z, S.W.K, I.B.H, A.E.R, J.E.A, and Y.D.T performed the experiments; H.H, D.Y, X.Z, S.W.K, and Y.D.T analyzed results, plotted the data, and participated in experimental design modifications; H.H and Y.D.T drafted the manuscript; Y.D.T initiated, designed, funded, and supervised the study, and wrote and finalized the paper and figures.