
Abstract
As assuring cell quality is an essential parameter for the success of stem cell therapy, the impact of various senescence-inducing stress signals, and strategies to circumvent them, has been an important area of focus in stem cell research. The aim of this study was to demonstrate the capacity of trans-cinnamaldehyde (TC) in reversing stress-induced senescence and maintaining the quality of stem cells in a chemically (H2O2)-induced cell senescence model. Because of the availability and the promising application potential in regenerative medicine, adipose-derived stem cells (ADSCs) were chosen for the study. We found that H2O2 treatment resulted in the expression of senescence characteristics in the ADSCs, including decreased proliferation rate, increased senescence-associated β-galactosidase (SA-β-gal) activity, decreased silent mating type information regulation 2 homolog (SIRT1) expression, and decreased telomerase activity. However, TC treatment was sufficient to rescue or reduce the effects of H2O2 induction, ultimately leading to an increased proliferation rate, a decrease in the percentage of SA-β-gal-positive cells, upregulation of SIRT1 expression, and increased telomerase activity of the senescent ADSCs at the cellular level. Moreover, a chemically induced liver fibrosis animal model was used to evaluate the functionality of these rescued cells in vivo. Liver dysfunction was established by injecting 200 mg/kg thioacetamide (TAA) intraperitoneally into Wistar rats every third day for 60 days. The experimental rats were separated into groups: normal group (rats without TAA induction), sham group (without ADSC transplantation), positive control group (transplanted with normal ADSCs), H2O2 group (transplanted with H2O2-induced senescent ADSCs), and H2O2 + TC group (transplanted with ADSCs pretreated with H2O2 and then further treated with TC). In the transplantation group, 1 × 10⁶ human ADSCs were introduced into each rat via direct liver injection. Based on the biochemical analysis and immunohistochemical staining results, it was determined that the therapeutic effects on liver fibrosis by the induced senescent ADSCs (H2O2 group) were not as significant as those exerted by the normal ADSCs (the positive control group). However, the H2O2 + TC group showed significant reversal of liver damage when compared to the H2O2 group 1 week posttransplantation. These data confirmed that the TC treatment had the potential to reduce the effects of H2O2-induced senescence and to restore in vivo functionality of the induced senescent ADSCs. It is therefore suggested that TC has potential applications in maintaining the quality of stem cells and could aid in treating senescence-related disorders.
Introduction
During long-term culture, stem cells undergo numerous changes, many of which could affect their functionality in applications such as cellular therapy (31). Cellular senescence occurs in most kinds of cells except embryonic stem cells. Further senescence can lead to the cell cycle arrest (27,35). This lack of active proliferation may lead to a loss of stem cells or progenitor cells, which are essential for tissue repair and regeneration, and the compensation of normal cell turnover (9). This could become a tremendous hindrance in maintaining tissue structure and function (27). Along with the loss of active proliferation, senescent cells also increase senescence-associated β-galactosidase (SA-β-gal) activity. This increase alters lysosomal function in senescent cells, which can be detected at suboptimal pH through the increase in SA-β-gal activity (7). Previous studies have reported that increased SA-β-gal activity can be found in cultured cells, such as retinal epithelial cells (14), neuronal cells (11), aging skin cells (8), and hepatocytes under various stress conditions (33).
Yeast silent information regulator 2 is a nicotinamide adenine dinucleotide-dependent deacetylase that closely resembles the mammalian SIRT1, which is a member of the sirtuin-silent mating type information regulation 2 homolog (SIRT) family. This group of deacetylases is known to play a vital role in cell cycle and senescence (15). SIRT1 regulates the function of many signaling factors in cardiocytes, including forkhead box O, nuclear factor κ-light-chain-enhancer of activated B-cells, and mammalian target of rapamycin, thereby contributing to age-related cardiovascular disease (22). Few other changes that have been identified and understood by various researchers are actually useful and important markers for senescence. The p53 and Rb pathways are also chief contributors of senescence, and they coordinate the cyclin-dependent kinase inhibitor 2A (p16) and cyclin-dependent kinase inhibitor 1 (p21). This coordination in turn further mitigates the E2F transcription factor (28).
Many somatic cells undergo a limited number of doublings, and ultimately senesce, due to telomere shortening (2,12,18). Telomerase is an RNA-dependent DNA polymerase that promotes the addition of TTAGGG repeats onto the telomeres, which consist of highly repetitive sequences at the end of a linear chromosome. Normal telomerase activity is critical for maintaining telomere length. Without it, many vital genes may be compromised (27,37).
Trans-cinnamaldehyde (TC) is an aromatic aldehyde found in the bark of young Cinnamon cassia twigs (5). It is a “Generally Regarded As Safe” molecule according to the Food and Drug Administration (1). Previous studies have suggested TC has antitumor activities (23). However, its antisenescence properties have not yet been investigated. We have therefore attempted to characterize this function, which could ultimately pave the way for novel treatment strategies in various disorders.
We have chosen to use adipose-derived stem cells (ADSCs), not only because of their self-renewal capacity and multiple differentiation lineages but also because they are easy to harvest (17). Another advantage of ADSCs is, being immune privileged, they can reduce the chance of graft-versus-host disease. Given the above, paired with our previous experience (13), ADSCs were chosen for this work.
In this study, we report TC's potential to delay the effects of chemically induced senescence in ADSCs by showing a recovery in proliferation rate, a decrease in the percentage of cells expressing SA-β-gal, and an increase in both SIRT1 gene expression and telomerase activity in vitro. Furthermore, a previously established chemically induced liver fibrosis animal model (13) was used to determine the functional capacity of these rescued cells in vivo.
Materials and Methods
Cell Culture and Treatment
ADSCs were isolated following methods described in a previous report (13). In brief, human adipose tissue was harvested from subcutaneous fat (1 cm3) of the abdominal wall from a 61-year-old female during gynecological surgery with the approval of the Institutional Review Board at China Medical University Hospital [DMR100-IRB-202 (CR2)]. The cells were cultured and maintained in keratinocyte serum-free medium (Invitrogen-Gibco, Grand Island, NY, USA) supplemented with human recombinant epidermal growth factor, bovine pituitary extract, 5% fetal bovine serum (FBS), 1% P/S (Biowest, Nuaillé, France), 0.2 mM L-ascorbic acid, and 2 mM N-acetyl cysteine (Sigma-Aldrich, St. Louis, MO, USA). The cells were incubated in a 37°C incubator with 5% CO2. All the cells used for the study were passaged five to seven times.
To induce senescence of the ADSCs, cells were treated with 100 μM H2O2 (Sigma-Aldrich) for 2 h. Following induction, cells in the H2O2 group were maintained in Dulbecco's modified Eagle medium (DMEM; Corning, Corning, NY, USA) for 6 h, while the H2O2 + TC group was treated with 2 μM to 6 μM TC (Sigma-Aldrich) for 6–72 h. From these initial studies, the optimal condition was determined to be 6 μM for 6 h. This treatment protocol was used for the remainder of the work.
Surface Phenotype Characterization
Surface markers for ADSCs were characterized using a flow cytometer (FC500; Beckman Coulter, Brea, CA, USA) by labeling with antibodies against the human cluster of differentiation (CD) CD14, CD29, CD44, CD45, and human leukocyte antigen (HLA)-ABC (Dako, Carpentaria, CA, USA) and CD34, CD49b, CD73, and HLA-DR (all in dilutions of 1:50) (Becton Dickinson, Franklin Lakes, NJ, USA). Labeling was performed according to the manufacturer's instructions.
Osteogenic Differentiation
For osteogenic differentiation, cells were incubated in DMEM (Corning) containing 10% FBS, 20 nM dexamethasone, 100 U/ml penicillin, 100 μg/ml streptomycin, 2.5 μg/ml amphotericin, 10 mM β-glycerophosphate, and 0.05 mM l-ascorbic acid-2-phosphate. On day 7, osteogenic differentiation of the ADSCs was confirmed by positive ALP staining using microscopic observations previously described (3). Further spectrophotometric quantification of osteogenic differentiation was obtained using an alkaline phosphatase detection kit (EMD Millipore CSCR004; Merck Millipore, Billerica, MA, USA).
Adipogenic Differentiation
Cells were incubated with DMEM containing 10% FBS, 10 μg/ml insulin, 1 μM dexamethasone, 0.5 mM 3-isobutyl-1-methylxanthine, and 100 μM indomethacin. On day 7, adipose stem cell differentiation was identified by positive oil red O (Sigma-Aldrich) staining. Following imaging, oil droplets were extracted with isopropanol containing 4% Nonidet P-40 (Sigma-Aldrich), and absorbance readings were taken at 510 nm (6).
Ki-67 Staining
Cells were washed twice in phosphate-buffered saline (PBS), fixed to plates using 3.7% formaldehyde (Sigma-Aldrich), and blocked with 10% FBS in PBS. After further washing, the cells were incubated with Ki-67 antibody (dilution of 1:20) (Novus Biological, Cambridge, UK) overnight at 4°C. Cells were then washed with PBS and incubated with goat anti-rabbit IgG secondary antibody (dilution of 1:200) (Merck Millipore). Nuclei staining using 4′,6-diamidino-2-phenylindole (Invitrogen, 1:30,000) was conducted in the dark. Cells were observed at an objective of 20× magnification. Four random fields per dish were visualized, and at least 1,000 cells were counted per field. Ki-67-positive cells were expressed as a percentage of total counted cells as counted using image processing and analysis in Java (ImageJ) (National Institutes of Health, Bethesda, MD, USA).
Senescence-Associated β-Galactosidase Staining
Cells were washed twice in PBS, fixed to plates in 3% formaldehyde for 5 min at RT, and washed with PBS again. Cells were then incubated overnight at 37°C, in the absence of CO2, in freshly prepared staining buffer [1 mg/ml 5-bromo-4-chloro-3-indolyl β-d-galactopyranoside (X-gal) (Sigma-Aldrich), 40 mM citric acid/sodium phosphate (Sigma-Aldrich), pH 6.0, 5 mM potassium ferrocyanide (JT Baker, Center Valley, PA, USA), 5 mM potassium ferricyanide (JT Baker), 150 mM NaCl (Sigma-Aldrich), 2 mM MgCl2 (Sigma-Aldrich)] (20). Following staining, the solution was removed, and cells were washed with PBS. Cells were observed at 10× magnification. Four random fields per dish were visualized, and at least 1,000 cells were counted per field. SA-β-gal-positive cells were expressed as a percentage of total counted cells (14).
Semiquantitative RT-PCR and Quantitative RT-PCR
Total cellular RNA was isolated from the ADSCs with an RNeasy Mini Kit (Qiagen, Valencia, CA, USA) according to the manufacturer's instructions. First, cDNA synthesis was performed according to the manufacturer's protocol using maxime RT Pre Mix (iNtRON Biotechnology, Kyungki-Do, Korea). Primers were included for the human β-actin gene, which served as the internal standard. Semiquantitative PCR parameters included 25 or 30 amplification cycles. PCR products were then separated by 2% agarose gel electrophoresis and visualized by ethidium bromide (Invitrogen) staining. Further semiquantification of these bands was carried out using ImageJ software (National Institutes of Health). Q-PCR was performed with SYBR Green PCR Master Mix (Thermo Scientific, Fremont, CA, USA) on an ABI Prism 7700 Sequence Detection System (Applied Biosystems, Foster City, CA, USA). The relative expression level of β-actin was used as an internal control to normalize specific gene expression in each sample. Relative quantification of marker genes was performed according to the ΔΔCt method. The primer pairs used in this study are listed in Table 1.
Primers and Their Sequences Used in the Semiquantitative PCR

SIRT1, sirtuin 1, silent mating type information regulation 2 homolog; p53, tumor protein 53; p21, cyclin-dependent kinase inhibitor 1; OCT4, octamer-binding transcription factor 4; TWIST1, twist-related protein 1.
Microarray Analysis
For microarray, 1.5 μg cDNA was hybridized to an Affymetrix GeneChip Human Genome U133 Plus 2.0 Array (Affymetrix, Santa Clara, CA, USA), and results were read using a GeneChip® Scanner 3000 (Affymetrix). The relative expression levels of more than 47,000 transcripts and variants, including more than 38,500 well-characterized genes, were recorded.
Telomeric Repeat Amplification Protocol
Telo TAGGG Telomerase PCR ELISA (Roche Diagnostics, Indianapolis, IN, USA) reactions of freshly isolated ADSCs were performed as per the manufacturer's instructions. As a negative control, extracts were preincubated with 5 μg RNase for 10 min at 30°C prior to the extension reaction. Telomerase-positive human embryonic kidney (HEK) cells were included as a positive control. The RNAse and HEK cells were components of the ELISA kit.
Fibrotic Rat Model and Cell Transplantation Experiment
All the animal experiments were carried out with approval and in compliance with the animal protection laws under the National Dong Hwa University Animal Management Commission. To establish the rat model of chronic liver fibrosis, 200 mg/kg thioacetamide (TAA) (Sigma-Aldrich) was injected intraperitoneally into 8-weekold male Wistar rats (BioLASCO Taiwan Co., Ltd., Taipei, Taiwan) (n = 35) every third day for 60 days (20 injections). For the normal control group, 8-week-old male Wistar rats (n = 12) were injected with normal saline in the same volume as the TAA group.
Cell transplantation experiments were performed on the fourth day following the final injection (day 64), which is designated as day 0 for the cell therapy studies. On day 0, rats in the control group (n = 4) and the fibrotic groups (n = 3) were sacrificed to confirm the establishment of liver fibrosis. These specimens served as the basis to compare the various responses of different treatment groups. Cardiac blood samples were collected to measure the biochemical liver function index, and liver samples were processed and sectioned to obtain a histopathological score. The biochemical liver function index is comprised of a number of measurements, including glutamate oxaloacetate transaminase (GOT), glutamate pyruvate transaminase (GPT), albumin, total bilirubin, and prothrombin time. The measurements were collected using a biochemical analyzer (Roche Integra 800; Roche, Holliston, MA, USA), and together provide a mean to evaluate the extent of hepatic damage. Further histopathological analysis [hematoxylin and eosin staining (H&E)— activity level and Masson's trichrome staining—fibrosis level] were performed using the methods described previously (13). An injury grading score based on the Metavir system (24) was used to evaluate the degree of fibrosis and inflammation in liver parenchyma, as described previously (Table 2) (13).
Metavir-Based Injury Scoring System for (a) Liver Fibrosis and (b) Activity Score for Measuring Inflammation in the Liver Parenchyma

The remaining 32 fibrotic rats were then randomly divided into four groups: sham (n = 8), H2O2 (n = 8), ADSC (n = 8), and TC (n = 8) before cell transplantation. The ADSCs for the cell transplantation experiments were cultured and expanded in 75-cm2 T flasks and then separated into three groups on day 0. For the ADSC group (positive control), untreated ADSCs were used; for the H2O2 group (negative control), induced senescent ADSCs (i.e., cells treated with 100 μM H2O2 for 2 h before transplantation) were used; and for the H2O2 + TC group, the TC rescued ADSCs were used (i.e., initially treated with 100 μM H2O2 for 2 h and then treated with 6 μM TC for 6 h). Prior to transplantation, the cells were trypsinized (Biowest) and collected by centrifugation (300 × g for 5 min). The cells were then resuspended in saline at a concentration of 2 × 10⁶ cells/600 μl. Rats in the cell transplantation groups were anesthetized with ether (Sigma-Aldrich) and were administered 300 μl of the cell suspension by liver injection using a 29-gauge syringe. The sham group received 300 μl of normal saline without cells. Following transplantation, four rats per group were sacrificed on days 7 and 14. Cardiac blood samples were obtained for serum biochemical analysis, and liver tissue was collected and processed for histopathological analysis and immunohistochemical staining for human anti-α-fetoprotein (AFP, 1:100; Abcam, San Fransisco, CA, USA) and human anti-mitochondria (1:200; Abcam) based on the protocol described previously (13).
Statistical Analysis
All data were presented as means and standard deviations. Comparisons between two treatment groups were conducted using the Student's t-test. The Bonferroni correction was used post-ANOVA while comparing multiple groups (Graphpad, La Jolla, CA). Values of p < 0.05 were considered significant, and values of p < 0.01 were considered highly significant.
Results
Characterization of ADSCs
ADSCs utilized in this study were characterized by analyzing their surface markers using flow cytometry. The phenotypes of ADSCs, H2O2-treated ADSCs, and TC-rescued ADSCs are shown in Figure 1. We found that changing the conditions of H2O2 treatment, or extending TC treatment, did not affect the surface markers displayed by the ADSCs. The cells expressed mesenchymal stem cell (MSC) hallmarks (CD29, CD44, CD73, CD90, and HLA-ABC) and did not possess hematopoietic-specific cell markers (CD34, CD45, or HLA-DR).

Surface phenotype and typical morphology of ADSCs post-TC treatment. Flow cytometry results using selective human antibodies against CD44, CD90, CD29, CD73, CD45, CD34, HLA-ABC, and HLA-DR. The percentages indicate how much the markers (shaded regions) differ from that of the isotype control (open regions). Control: untreated ADSCs; H2O2: ADSCs treated with 100 μM of H2O2 for 2 h; H2O2 + TC: ADSCs treated with 6 μM of TC for 6 h posttreatment of 100 μM H2O2 for 2 h. ADSCs, adipose-derived stem cells; TC, trans-cinnamaldehyde; CD, cluster of differentiation; HLA, human leukocyte antigen.
Further characterization of ADSCs was performed in which their differentiation capacities, both adipogenic and osteogenic, were examined. It was found that H2O2 treatment resulted in decreased differentiation capacity. However, it appears that further treatment with TC may enable the H2O2-treated cells to maintain adipogenic and osteogenic differentiation capacities comparable to that of the controls, as shown in Figure 2a–h.

Characterization of ADSCs post-TC treatment (differentiation, proliferation, and SA-β-gal activity). Effect of TC treatment on osteogenic and adipogenic differentiation in the H2O2-induced senescent ADSCs (a–h). With standard treatment time of 6 h post-H2O2 treatment (100 μM H2O2 for 2 h), ADSCs were treated with TC at 6 μM concentration. Osteogenesis: Control-untreated ADSCs (a), ADSCs treated with 100 μM H2O2 for 2 h (b), ADSCs pretreated with H2O2 and further treated with 6 μM of TC (c). Adipogenesis: Control-untreated ADSCs (e), ADSCs treated with 100 μM H2O2 for 2 h (f), ADSCs pretreated H2O2 and further treated with 6 μM of TC (g). At day 10, postinduction of osteogenesis (d) and adipogenesis (h) differentiation quantifications were performed. The mean ± standard deviation (SD) levels of adipogenesis and osteogenesis in the three groups. ***p < 0.01, when H2O2 group was compared to TC 6 μM group. Scale bar: 200 μm. Effect of TC treatment on proliferation rate in the H2O2-induced senescent ADSCs (i–l): Proliferation of cells was observed to be increased when senescent cells were treated with TC. Control (ADSC untreated) (i), ADSCs treated with 100 μM H2O2 for 2 h (j), ADSCs treated with TC 6 μM post-H2O2 treatment (k). Scale bar: 200 μm. The mean ± SD levels of cells expressing Ki-67 positive for the above-mentioned groups of treatment (l). ***p < 0.01, control group compared to H2O2 group, H2O2 group compared to TC 6 μM group. Effect of TC treatment on percentage of SA-β-gal-positive expressing cells in the H2O2-induced senescent ADSCs (m–q). With the standard treatment time of 6 h post-H2O2 treatment (100 μM H2O2 for 2 h), ADSCs were treated with TC at different concentrations. Control ADSCs untreated (m), ADSCs treated with 100 μM H2O2 for 2 h (n), ADSCs treated with TC 6 μM post-H2O2 treatment (o), percentage of cells expressing SA-β-gal positive decreased dose dependently in ADSCs treated with TC 2 μM, 4 μM, 6 μM for 6 h post-H2O2 treatment (p). Further, after 24 h of incubation, the percentage of cells expressing SA-β-gal-positive was counted manually. Percentage of cells expressing SA-β-gal-positive is not dependent on H2O2 treatment (q). The mean ± SD levels of cells expressing SA-β-gal-positive for the above-mentioned groups of treatment, ***p < 0.01, when control group was compared to H2O2 group, H2O2 group was compared to TC 2 μM group, H2O2 group was compared to TC 4 μM group, H2O2 group was compared to H2O2 + TC 6 μM group (p) and ***p < 0.01, control group was compared to TC 6 μM group (q). Control: untreated ADSCs; H2O2: ADSCs treated with 100 μM of H2O2 for 2 h; H2O2 + TC 2 μM: ADSCs treated with 2 μM of TC for 6 h post-treatment of 100 μM H2O2 for 2 h; H2O2 + TC 4 μM: ADSCs treated with 4 μM of TC for 6 h posttreatment of 100 μM H2O2 for 2 h; H2O2 + TC 6 μM: ADSCs treated with 6 μM of TC for 6 h posttreatment of 100 μM H2O2 for 2 h. Scale bar: 200 μm.
Effect of TC Treatment on the Proliferation Rate in the H2O2-Induced Senescent ADSCs
Figure 2i–l shows the Ki-67 staining of the ADSCs across the different groups. We found that the number of Ki-67-positive cells was dramatically decreased after H2O2 induction, indicating a significant decrease in the proliferation rate (Fig. 2i, j). However, the number of Ki-67-positive cells was greatly enhanced by subsequent TC treatment, as shown in Figure 2k, indicative of a significant rescue in the proliferation rate of the senescent ADSCs (Fig. 2l).
Effect of TC Treatment on the Percentage of SA-β-gal-Positive Cells in the H2O2-Induced Senescent ADSCs
Cellular senescence is characterized by elevated levels of endogenous SA-β-gal activity at pH 6.0. In order to confirm that H2O2 treatment did indeed promote senescence, the cells were treated with 100 μM H2O2 for 2 h, and SA-β-gal staining was performed. It was noted that, following H2O2-induced senescence, the percentage of SA-β-gal-positive cells increased significantly. Strikingly, the percentage of SA-β-gal-positive cells was decreased dramatically when H2O2-induced cells were treated with TC, confirming its antisenescent effects (Fig. 2m–p). This TC-dependent decrease in the percentage of SA-β-gal-positive cells was also observed in noninduced samples, suggesting that this decrease is in fact H2O2 independent (Fig. 2q).
Effect of TC on Gene Expression in the H2O2-Induced Senescent ADSCs
Varying expressions of vital senescence-associated genes were tested using semiquantitative RT-PCR and quantitative RT-PCR. With the standard treatment duration of 6 h post-H2O2 treatment (100 μM H2O2 for 2 h), ADSCs were treated with TC (6 μM) for 6 h. Upregulation of SIRT1 in TC-treated ADSCs post-H2O2 treatment is a vital indicator of the antisenescence capacity of TC (Fig. 3a, b).
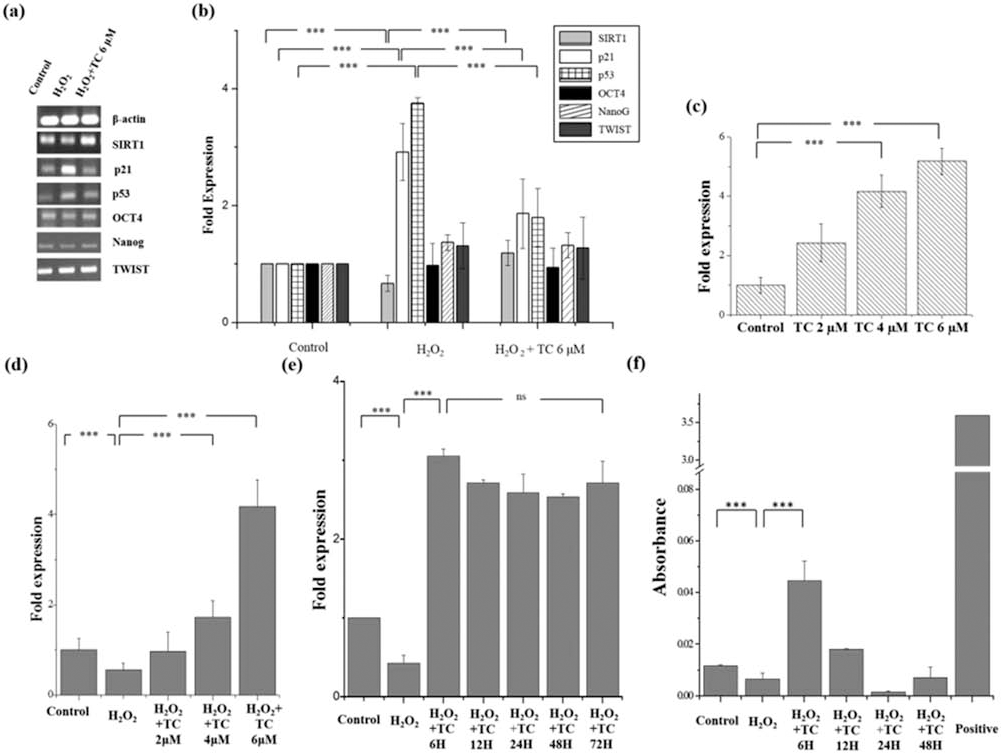
Semiquantitative, quantitative real-time gene expression profile and telomerase activity: effect of TC on H2O2-induced senescent ADSCs. Semiquantitative PCR for gene expression analysis (a, b). With the treatment time of 6 h, ADSCs were treated with TC (6 μM) post-H2O2 treatment (100 μM H2O2 for 2 h). Gene expression levels of ADSCs were analyzed by RT-PCR and gel electrophoresis (a). Further ImageJ analyses of the bands were performed to measure the semiquantitative levels of gene expression (b). The mean ± SD levels of gene expression for different groups of treatment were calculated, ***p < 0.01, when normal group was compared to H2O2 group, H2O2 group was compared to H2O2 + TC 6 μM group. Real-time quantitative gene expression profile: effect of TC on SIRT1 levels in the H2O2-induced senescent ADSCs (c–e). ADSCs treated with TC 2 μM, 4 μM, 6 μM for 6 h post-H2O2 treatment shows increase in SIRT1 levels dose dependently using real-time PCR (c). The increased SIRT1 levels were not dependent on the H2O2 treatment (d), and the increased SIRT1 levels were maintained even after 72 h of treatment (treatment duration of 6 h, 12 h, 24 h, 48 h, and 72 h were used in this study) (e). The mean ± SD levels of gene expression for the above-mentioned groups of treatment, ***p < 0.01, when the control group was compared to TC 6 μM group (c) and ***p < 0.01, when the control group was compared to H2O2 + TC 6 μM group (d). nsp = 0.417, no significant difference was found between TC 6-h-treated cells post-6 h and post-3 days of incubation (e). Effect of TC treatment on telomerase activity in the H2O2-induced senescent ADSCs (f). Telomerase activity of senescent ADSCs treated with TC for varying time intervals showed that telomerase activity for TC-treated cells increased for the 6-h-treated group when compared to the H2O2-induced senescent cells group. The mean ± SD levels of telomerase activity for treated and untreated cells at different time intervals. ***p < 0.01, when H2O2 group was compared to TC 6 h group. Abbreviations: SIRT1, silent mating type information regulation 2 homolog; p53, tumor protein 53; p21, cyclin-dependent kinase inhibitor 1; OCT4, octamer-binding transcription factor 4; TWIST1, twist-related protein 1. Control: untreated ADSCs; H2O2: ADSCs treated with 100 μM of H2O2 for 2 h; H2O2 + TC 2 μM: ADSCs treated with 2 μM of TC for 6 h posttreatment of 100 μM H2O2 for 2 h; H2O2 + TC 4 μM: ADSCs treated with 4 μM of TC for 6 h posttreatment of 100 μM H2O2 for 2 h; H2O2 + TC 6 μM: ADSCs treated with 6 μM of TC for 6 h posttreatment of 100 μM H2O2 for 2 h. Positive control: cell extract prepared from immortalized telomerase expressing human kidney cells 293 (HEK293 cells). Scale bar: 200 μm.
Along with SIRT1, other important cell cycle marker genes such as p21 and p53 were initially upregulated post-H2O2 treatment. However, when rescued by TC treatment, the expression of p21 and p53 seemed to reduce. Other pluripotency markers such as octamer-binding transcription factor 4 (OCT4) and NANOG were also expressed at normal levels in the TC-treated cells when compared to the H2O2-treated cells. Furthermore, when ADSCs were treated with TC at different concentrations for 6 h and real-time quantitative PCR was performed, it was confirmed that SIRT1 levels did increase dose dependently post-TC treatment; it was also found that SIRT1 levels increased in ADSCs even without the H2O2 treatment, proving that the increase in SIRT1 levels was not H2O2 dependent (Fig. 3c, d).
After 6 h of treatment with TC, the cells were maintained in DMEM for varying time intervals to determine the duration of long-term maintenance of SIRT1 levels. When SIRT1 levels were frequently checked at various time intervals, it was observed that SIRT1 levels continued to be maintained for up to 3 days, proving their potential for use in animal studies (Fig. 3e).
Microarray analysis was performed using Affymetrix GeneChip Human Genome U133 plus 2.0 Array. When the transcriptomes of ADSCs treated with H2O2 and senescent ADSCs rescued by TC were compared, the genes that were upregulated were mostly associated with active proliferation of cells: EIF5, NYFA, CCND1, E2F6, SIRT1, hTERT, and PCNA. Further, apoptotic genes such as p16, GADD45B, and PIM1 were all downregulated. Through the upregulation of genes involved in transcription and translation and through the upregulation of SIRT1, TC displays a strong proliferation induction capacity (Table 3).
Microarray Data Showing Differentially Expressed Genes When H2O2-Treated Cells Were Compared With ADSCs Rescued by TC

The genes that displayed significantly different (p < 0.05) expression levels are listed. Abbreviations: NYFA, nuclear transcription factor Y subunit α; CCND1, cyclin D1; EIF5, eukaryotic translation initiation factor 5; SIRT1, silent mating type information regulation 2 homolog; E2F6, Homo sapiens E2F transcription factor 6; POLR3H, polymerase (RNA) III directed H; hTERT, human telomerase reverse transcriptase; PCNA, proliferating cell nuclear antigen; GADD45B, growth arrest and DNA-damage-inducible protein GADD45b; PIM1, protein kinase-related oncogene; p16-CDKN2A, cyclin dependent kinase inhibitor 2A.
Effect of TC Treatment on Telomerase Activity in the H2O2-Induced Senescent ADSCs
Telomerase activity has been one of the vital controllers of senescence in cells. The cells were first pretreated with 100 μM H2O2 for 2 h and then were treated with 6 μM TC for varying time intervals. The TC-treated ADSCs post-H2O2 treatment showed increased telomerase activity when compared to the H2O2 group. This experiment also showed that the most optimal treatment duration for TC would be 6 h (Fig. 3f).
Establishment of the Liver Fibrosis Model
To confirm the fibrosis levels in the disease model, the biochemical indexes of the experimental rats sacrificed on day 0 were analyzed. We found that after the TAA induction procedure, blood levels of GOT and GPT increased considerably (from 91 ± 32 to 546 ± 48 U/L and from 42 ± 12 to 138 ± 47 U/L, respectively) (Table 4), indicating that the liver cells were indeed damaged due to TAA induction. The prothrombin time increased significantly (from 10.78 ± 0.26 to 16.40 ± 3.09 s), blood levels of albumin decreased significantly (from 3.9 ± 0.3 to 2.8 ± 0.4 g/dl), and total billirubin levels increased significantly (from 0.025 ± 0.050 to 0.049 ± 0.009 mg/dl) (Table 4, Fig. 4). Along with the above-mentioned findings, H&E staining and Masson's trichrome staining (Fig. 5a–f) confirmed the liver damage in the TAA-induced rats. The clear infiltration of mononuclear cells (Fig. 5a, e, f) was observed with H&E staining, confirming that chronic TAA injections damaged the liver tissue (activity score 3.0 ± 0.0). In contrast, in the control rats that did not receive any TAA injection, the sections remained normal (activity score 0). Masson's trichrome stain showed an accumulation of collagen in TAA-injured liver sections, along with bridging where the accumulated collagen connected two blood vessels, a hallmark of fibrosis (16) (fibrosis score 4.0 ± 0.2); this was unlike the case in rats that did not receive any TAA inductions (Fig. 5b–d). This finding allowed clear confirmation of the stability of the liver fibrosis model, and further transplantation experiments were performed.

Serum levels of GPT/ALT (a), GOT/AST (b), total billirubin (c), albumin (d), prothrombin time (e) on days 0, 7, 14, and 28 after ADSC transplantation. The mean ± SD levels are shown for normal rats; sham rats with liver fibrosis that did not receive ADSC transplantation, for rats that received ADSC transplantation, for rats that received H2O2-treated ADSC transplantation, and for rats that received TC-treated H2O2 ADSCs. Abbreviations: GOT, glutamate oxaloacetate transaminases; GPT, glutamate pyruvate transaminase. ***p < 0.01 and **p < 0.05, different group comparisons.
Comparative Biochemical Analysis of Liver Function for Normal and Liver Fibrosis Rats

GOT, glutamate oxaloacetate transaminases; GPT, glutamate pyruvate transaminase.
p < 0.05, liver fibrosis rats compared with the normal rats,
p < 0.01, liver fibrosis rats compared with the normal rats.
TC's Effect on the Therapeutic Capacity of Senescent ADSCs for Cell Therapy
As shown in Figures 4 and 5, transplantation of untreated ADSCs in the fibrotic rats showed beneficial effects for the recovery of liver fibrosis, as expected. Untreated ADSC-transplanted groups and the sham group showed significant differences in their biochemical indexes, fibrosis scoring, and activity scoring (Figs. 4, 5) after cell transplantation. The trends were similar to those observed in our previous study (13).
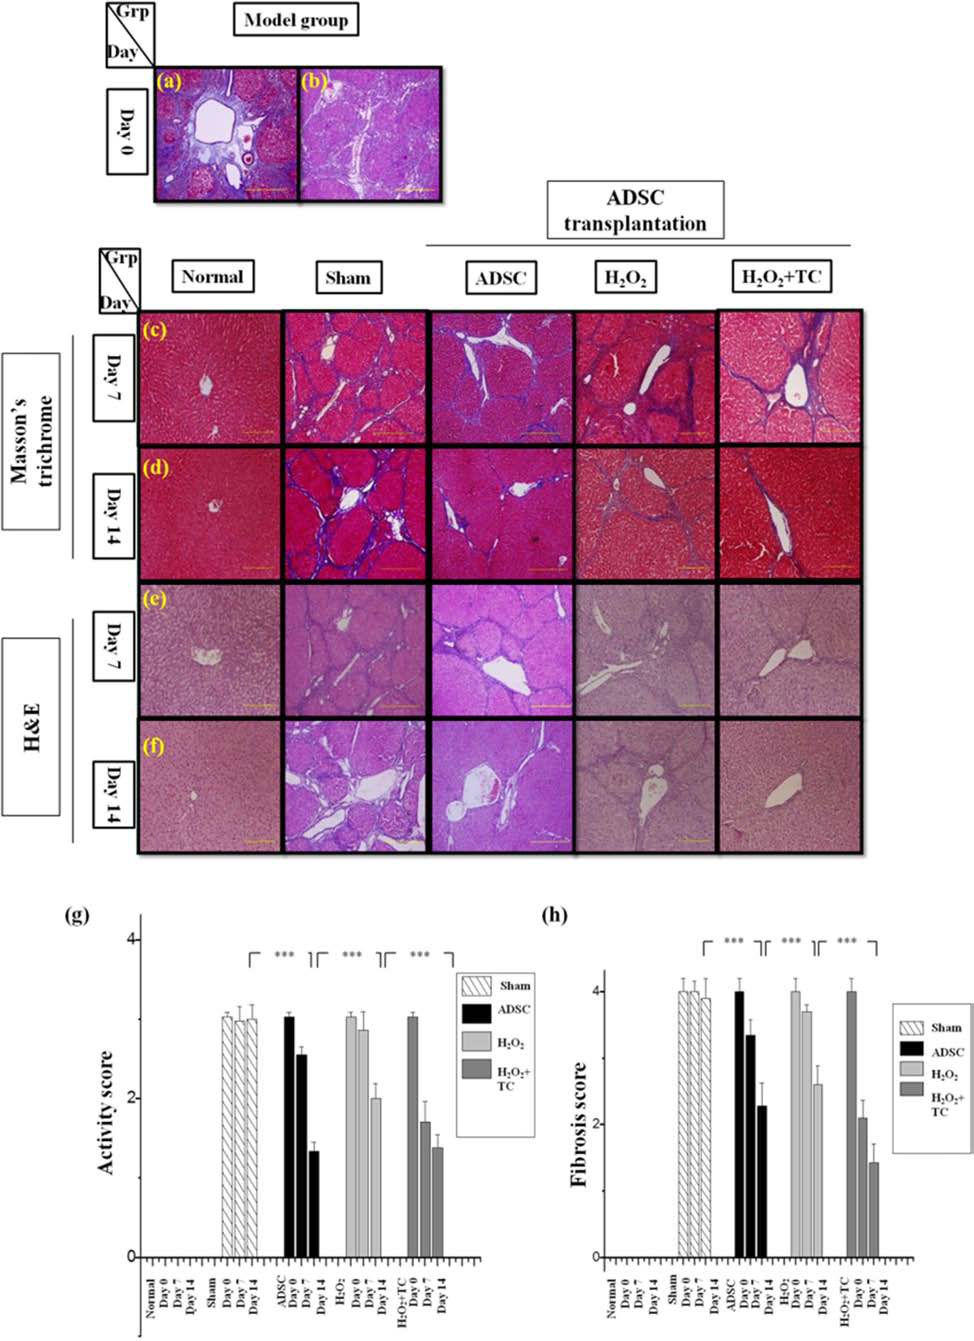
Fibrosis levels (g) using Masson's trichrome staining (a, c, d) and activity levels (h) using H&E staining (b, e, f) on days 0, 7, and 14 after ADSC transplantation. Masson's trichrome staining (a) and H&E staining (b) for day 0 post-60 days of liver fibrosis induction. Masson's trichrome staining images of liver sections for day 7 and day 14, respectively (c, d). H&E staining images of liver sections for day 7 and day 14, respectively (e, f). The mean ± SD levels are shown for sham group (which was only treated by normal saline), ADSC group, H2O2 (ADSC treated with 100 μM H2O2 for 2 h) group, and H2O2 + TC group (ADSC treated with 6 μM TC for 6 h post-100 μM H2O2 for 2 h) for fibrosis score (e) and for activity score (f). ***p < 0.01, for different group comparisons. Scale bar: 200 μm.
Also shown in Figures 4 and 5, the group transplanted with the H2O2-treated ADSCs did not show as effective recovery as the normal ADSC group. It was suggested that the therapeutic effects were indeed affected by the quality (i.e., senescence status in this study) of the stem cells. Moreover, since the above in vitro studies have shown that TC could decrease the effects of chemically induced senescence on the cellular level, this in vivo study further demonstrated that TC treatment led to significant improvement in the functional capacity of the H2O2-induced senescent ADSCs for therapeutic effects in fibrotic rat model. The details are described below.
The results of serum biochemical analysis in the transplanted rats showed that the GPT levels of the untreated ADSC group (72 ± 14 U/L) were much lower than those of the H2O2-treated ADSC group (93 ± 13 U/L) on day 14. However, when these cells were further treated with TC before transplantation, their GPT levels lowered significantly (66 ± 14 U/L) and were less than those of the untreated ADSC group. GOT levels for the sham group (208 ± 12 U/L) were higher than those of the ADSC-treated group (162 ± 60 U/L), but the TC-rescued senescent ADSCs showed even lower GOT levels (137 ± 18 U/L). Albumin levels for the sham groups were (3.23 ± 0.01 g/dl) lower than the ADSC-treated group (3.52 ± 0.28 g/dl); when further treated with TC, they showed higher albumin levels than the sham group (3.48 ± 0.03 g/dl) on day 14. The total billirubin levels of the TC-treated group showed significant improvement, approaching more toward the normal values (H2O2 + TC group: 0.034 ± 0.03 mg/dl; normal group: 0.02 ± 0.02 mg/dl; ADSC group: 0.05 ± 0.02 mg/dl). Prothrombin time for the sham group was also higher (23.10 ± 2.5 s) when compared to the TC-rescued ADSC group (10.88 ± 0.67 s) (Fig. 4).
The fibrosis scores and activity scores for experimental rats showed that the transplantation of ADSCs with good quality could improve liver function (activity score, sham: 3, ADSCs: 1) (fibrosis score, sham: 4, ADSCs: 2) (Fig. 5). The fibrosis score generated using Metavir-based injury scoring system (Table 2) was much lower for the TC-treated ADSCs than that for the H2O2 groups for day 14 after transplantation (ADSCs: 2–3; H2O2: 3–4, TC: 1–2) (Fig. 5). In other words, the tissue collagen accumulation level was much lower in the TC-treated ADSC groups than in the H2O2-treated ADSC group. Similarly, activity scores generated using Metavir-based activity scoring system (Table 2) also showed a significant difference; the activity score of the H2O2+TC group was much lower than that of the H2O2 group (ADSC: 1–2; H2O2: 2–3; TC: 1–2), showing decreased mononuclear cell infiltration in the H2O2 + TC group than that in the other groups (Fig. 5). The above-mentioned data suggest that TC has the potential to revert the H2O2-induced senescence in ADSCs, making the cells similar to normal ADSCs.
Immunostaining of Liver Sections
Based on the results of immunostaining against human AFP, the ADSC group, H2O2 group, and the H2O2 + TC group were found to contain a significant number of cells displaying AFP at day 7 (as shown in Fig. 6a–j). Because the anti-AFP antibody used in this study was human specific, the results implied that the positive AFP cells were originated from the transplanted human ADSCs, and the transplanted ADSCs were possibly differentiated into hepatocyte-like cells, similar to what was reported previously (13).

Immunostaining of liver sections for human AFP and human mitochondria. Immunostaining for human AFP at day 7 (a–e) and day 14 (f–j) after transplantation. The liver section of normal untreated group (a, f), sham group (which was only treated by normal saline) (b, g), ADSC group (c, h), H2O2 (ADSC treated with 100 μM H2O2 for 2 h) group (d, i), and H2O2 + TC group (ADSC treated with 6 μM TC for 6 h post-100 μM H2O2 for 2 h) (e, j). Antibodies specific for human AFP were used. Brown staining and arrows indicate the human AFP-positive cells. Scale bar: 200 μm. Immunostaining for human mitochondria on liver sections at day 14 (k–o) after transplantation. The liver section of normal untreated group (k), sham group (which was only treated by normal saline) (l), ADSC group (m), H2O2 (ADSC treated with 100 μM H2O2 for 2 h) group (n), and H2O2 + TC group (ADSC treated with 6 μM TC for 6 h post-100 μM H2O2 for 2 h) (o). Antibodies specific for human mitochondria were used. Brown staining and arrows indicate the human mitochondria-positive cells. Scale bar: 200 μm.
Immunostaining against human mitochondria was also performed for the liver sections after 2 weeks of cell therapy. It was found that the number of cells displaying human mitochondria was indeed higher for the H2O2 + TC group when compared to all the other groups. The normal and the sham group did not display any human mitochondria. This confirmed that the mitochondria in treatment groups were indeed from the transplanted ADSCs (Fig. 6k–o).
Discussion
Emerging evidence suggests that accumulating senescent cells could contribute to aging. These accumulating cells could in turn initiate a cascade of reactions such as DDR signaling, apoptosis, and autophagy, which could become a tremendous burden on the whole organism (26). Therefore, to develop a strategy for rescuing these senescent cells, we established an in vitro ADSC senescent cell model and further proved the effect of the TC as an antisenescence drug.
Initially in our study, an induced H2O2-based senescent cell model was established, and the senescent state was confirmed through consideration of five basic criteria as shown in Figures 2 and 3. The senescent cell model was induced through the pretreatment of H2O2 on ADSCs and was characterized initially by their senescence-associated morphology, that is, the increased number of cells expressing SA-β-gal activity. As cellular senescence is synonymous with the loss of proliferative capacity in spite of the continued metabolic function (19), a clear decrease in the proliferation capacity of the senescent cells was also observed in our study. In addition, differentiation studies showed decreased adipogenic and osteogenic differentiation of ADSCs treated with H2O2, which is consistent with previous reports by other groups (10,38). Findeisen et al. reported that increased oxidative stress inhibits adipogenic differentiation (10). Correspondingly, a decrease in SIRT1 levels and telomerase activity was also observed. Sasaki et al. (30) demonstrated that with the increase in passage number, proliferation of the cells decreased along with a significant decrease in the SIRT1 levels. This decrease in SIRT1 levels could be directly associated with a decrease in SA-β-gal activity in both the murine and human cells. There have been various other such reports associating SIRT1 levels with senescence (26,34). It was also reported that modification of SIRT1 levels in young vascular smooth muscle cells led to decreased migration capacity, decreased proliferation, and increased senescence of the cells (34). One other important regulator of senescence is telomerase, and it is also controlled by SIRT1. Previously, it has been observed that the SIRT1 overexpression can upregulate telomerase activity and that SIRT1 knockdown can downregulate telomerase activity under long-term culture (4). Along with these, p16, p21, and p53 have been shown to be very important for cell cycle progression. Although p16 plays an important part in preventing tumorigenesis by initiating the senescence of the cell (25), early upregulation could lead to early initiation of senescence. Along with this, p53 also plays major roles in tumor suppression by controlling the cell cycle, apoptosis, DNA repair, and senescence levels (29).
When the H2O2-induced senescent cells were further treated with TC, the rescuing effects of TC were evident from the decreased number of cells expressing SA-β-gal activity, increased proliferation activity, increased SIRT1 levels, and increased telomerase activity. Microarray analysis revealed that the antisenescence activity of TC may be attributed to its proproliferative and antiapoptotic properties. Array data displayed an increase in the expression of genes that play an important role in active proliferation and cell cycle. It was observed that protranscription and translation genes, such as EIF5, NYFA, CCND1 E2F6, SIRT1, hTERT, and PCNA, were upregulated along with downregulation of apoptotic genes such as p16, GADD45B, and PIM1. This finding confirms the existence of a strong correlation among proliferation, senescence, telomerase activity, and SIRT1 levels. One other very vital parameter that needs to be considered is the role of autophagy and senescence induced by oxidative stress. According to White et al., autophagy enables the completion of the senescence process, thereby allowing the recycling of components required for cellular metabolism (36). Further investigation on the effect of TC on autophagy could lead to alternative treatment strategies.
Maintenance of cell quality is one essential factor for utilization of cells in transplantation. Sepulveda et al. recently showed in their study that induction of senescence in mesenchymal cells can decrease the therapeutic potential of MSCs in lethal endotoxemia (32). Other strategies such as the use of hypoxia to improve the therapeutic potential of old human endothelial cells in rat also showed the need to include senescence as a criterion before transplantation (21). In this study, we observed the poor performance of H2O2-induced senescent cells in rescuing Wistar rats from chronic liver fibrosis. Further, in vivo studies clearly indicated that the senescent ADSCs rescued by TC had much better liver-restoring capacity than the H2O2-induced senescent cells did. However, to elucidate the possible mechanisms underlying the alleviation of liver damage by these cell transplantations, further detailed investigations are necessary.
Cellular senescence should be therefore considered as a very important criterion in cell therapy. Long-term culture or other varying factors could greatly affect the senescent state of the cell. In this study, we observed that TC could rescue senescent cells and improve their performance both in vitro and in vivo, thereby making this a valuable strategy in therapeutic applications.
In summary, we show here that ADSCs could be induced to senescence using short-term H2O2 treatment. In this study, TC showed antisenescence properties in vitro by recovering H2O2-treated ADSCs. This was confirmed by the decreased percentage of cells expressing SA-β-gal, recovered proliferation levels, increased SIRT1 levels, and increased telomerase activities in the TC-rescued ADSCs relative to that in the H2O2-induced senescent ADSCs. When tested in vivo, the senescent cells rescued by TC seemed to alleviate liver fibrosis in Wistar rats more efficiently than the H2O2-induced senescent cells. Our findings also show that TC could be useful for the treatment of innumerable senescence-related disorders.
Footnotes
Acknowledgments
This work was financially supported by the grants from Gwoxi Stem Cell Applied Technology Company, Taiwan Mitochondrion Applied Technology Company, and Stem Cell and Regenerative Medicine Foundation. The authors declare no conflicts of interest.