
Abstract
Our previous results showed that the polysaccharides extracted from Lycium barbarum (LBP) could delay secondary degeneration of retinal ganglion cell bodies and improve the function of the retinas after partial optic nerve transection (PONT). Although the common degeneration mechanisms were believed to be shared by both neuronal bodies and axons, recently published data from slow Wallerian degeneration mutant (Wlds) mice supported the divergence in the mechanisms of them. Therefore, we want to determine if LBP could also delay the degeneration of axons after PONT. Microglia/macrophages were thought to be a source of reactive oxygen species after central nervous system (CNS) injury. After PONT, however, oxidative stress was believed to occur prior to the activation of microglia/macrophages in the areas vulnerable to secondary degeneration both in the optic nerves (ONs) and the retinas. But the results did not take into account the morphological changes of microglia/macrophages after their activation. So we examined the morphology in addition to the response magnitude of microglia/macrophages to determine their time point of activation. In addition, the effects of LBP on the activation of microglia/macrophages were investigated. The results showed that (1) LBP reduced the loss of axons in the central ONs and preserved the g-ratio (axon diameter/fiber diameter) in the ventral ONs although no significant effect was detected in the dorsal ONs; (2) microglia/macrophages were activated in the ONs by 12 h after PONT; (3) LBP decreased the response magnitude of microglia/macrophages 4 weeks after PONT. In conclusion, our results showed that LBP could delay secondary degeneration of the axons, and LBP could also inhibit the activation of microglia/macrophages. Therefore, LBP could be a promising herbal medicine to delay secondary degeneration in the CNS via modulating the function of microglia/macrophages.
Introduction
In addition to primary degeneration, secondary degeneration of the neurons and glial cells in the central nervous system (CNS) occurred under various pathological conditions such as brain trauma, spinal cord injury, stroke, and chronic neurodegenerative diseases, including Alzheimer's disease, Parkinson's disease, Huntington's disease, and glaucoma (3,18,33,38,43,45,46,53). The retinal ganglion cells (RGCs) are vulnerable to secondary degeneration in glaucoma, making them a promising target of neuroprotection in order to delay the death of RGCs. However, it is difficult to distinguish secondary degeneration from primary degeneration in glaucoma patients and also in animal models currently used for the study of glaucoma, including optic nerve (ON) crush, complete ON transection, and ocular hypertension models. There is neither a clear boundary nor an effective distinguishing method between the primary degeneration and secondary degeneration. However, a new model established in the last decade, the partial optic nerve transection (PONT) model, contributed to resolve this issue. In this model, only the dorsal part of the ON was transected, and the central and ventral parts of the ON remained intact. It was useful for the study of secondary degeneration in the retinas and ONs because the primary and secondary degeneration could be distinguished in location (15,16,28,29,31).
Lycium barbarum has been used as an “upper class medical herb” for hundreds of years in the Oriental world. It can treat diseases related to vision, the kidney, and the liver in Chinese medical theory (24). In our laboratory, we use Lycium barbarum bought from the Ning Xia Huizu Autonomous Region, People's Republic of China. We have previously shown that the polysaccharides extracted from Lycium barbarum (LBP) reduced the death of cultured cortical neurons challenged by β-amyloid, glutamate, and homocysteine (23,54–56) and alleviated depression of rats by enhancing synaptic plasticity (57). LBP also delayed the degeneration of RGCs in the acute ischemia/reperfusion model (20,36), the chronic ocular hypertension model (5,35,37), and the mouse transient middle cerebral artery occlusion model (32). However, whether LBP delayed primary or secondary degeneration in these models and the mechanism(s) underlying the neuroprotective effects of LBP remained unclear. Using the PONT model of Sprague–Dawley (SD) rats, we have shown that LBP could decrease the secondary degeneration of the cell bodies of RGCs 4 weeks after PONT in the retinas, and it might exert its roles through inhibiting oxidative stress and activation of c-Jun N-terminal kinase (JNK) pathway (30). In addition, our study showed that LBP could improve the function of both the inner (RGCs) and outer retinas (bipolar cells and photoreceptors) affected by PONT using measurements from multifocal electroretinograms (9). However, the effect of LBP on the axonal degeneration in the ONs of SD rats has not been elucidated. The mechanisms of degeneration underlying the axons and RGC bodies might not be identical according to a lot of evidence using slow Wallerian degeneration mutant (Wlds) mice (10,11,26,49,50). For example, in Wlds mutant mice and transgenic rats, the axons in the ONs were protected after ON injury or ocular hypertension, whereas the somata in the retinas were not (2,34,48). Although Wallerian degeneration (the degeneration of axons distal to the injury site) was investigated in these studies, the retrograde degeneration of the ONs shared the same mechanisms with Wallerian degeneration (25). In Wistar rats, the degeneration of axons was believed to follow a similar time course to that of the RGC bodies after PONT; however, the loss percentages were different between the axons and the cell bodies at several time points (29). Damage to RGC axons often led to the retrograde degeneration of the cell bodies in the retinas (40). Therefore, it was an indispensable complement to investigate the effects of LBP on the degeneration of axons after PONT in addition to the degeneration of RGC bodies that we have previously done.
Evidence showed that the oxidative stress, activation of microglia, and infiltration of macrophages were precedent to the secondary loss of axons after PONT (29). Microglia/ macrophages were indicated to be a source of reactive oxygen species (ROS) after CNS damage (4). However, the synchronous occurrence of oxidative stress (indicated by the increased labeling intensity of mitochondrial superoxide dismutase) and activation of microglia/macrophages [based on the increased ionized calcium-binding adapter molecule 1 (Iba-1)-positive cell counting] were not confirmed in the PONT model, and the former was much earlier (5 min) than the latter (3 days). Therefore, activated microglia/macrophages were stated to not participate in the oxidative stress after PONT (16). However, in fact, the activation of microglia/macrophages could also be discerned based on their morphology. The responding microglia/ macrophages can be divided into the semiactivated state and the fully activated state according to their morphology (13). In order to find out whether microglia/macrophage activation was earlier based on their morphology than based on quantitative analysis, the morphology of microglia/ macrophages after Iba-1 labeling was observed after PONT. LBP could modulate the activation of microglia/macrophages to exert neuroprotection in our previous study in a rat chronic ocular hypertension model (8). In order to find out if LBP protection in the PONT model was related to its modulation of microglia/macrophages, the effects of LBP on the long-term responses of microglia/macrophages were investigated 4 weeks after PONT, since LBP delayed secondary degeneration of axons at this time point.
Materials and Methods
Animals
Adult female SD rats (10–12 weeks of age, weighing 250–280 g, provided by the Laboratory Animal Unit, the Hong Kong University, Hong Kong, China) were used in this study. The rats were housed in a temperature-controlled room subjected to a 12-h light/12-h dark cycle and supplied with food and water ad libitum. Normal rats without PONT and without feeding with phosphate-buffered saline (PBS; 0.01 M, pH 7.4) or 1 mg/kg (rat weight) LBP in PBS were used for the control in all the experiments in this study. The PBS (0.01 M, pH 7.4) was prepared from 0.1 M phosphate buffer (PB; pH 7.4), which was prepared from sodium phosphate dibasic dodecahydrate and sodium phosphate monobasic monohydrate (Sigma-Aldrich, St. Louis, MO, USA) and sodium chloride (Affymetrix USB, Brockville, Canada). The preparation of LBP powder was as previously described (56). The LBP powder was stored in a dry box and freshly dissolved in PBS before use. To investigate the reaction of microglia/macrophages after PONT, the normal control rats (n = 4) and the rats without treatment with PBS or LBP were sacrificed after PONT at different time points (12 h, 1 day, 4 days, 1 week, and 4 weeks; n = 4 in each group). Frozen sections of the ONs were prepared for immunohistochemistry staining. For studying the effect of LBP, the rats were fed with PBS or LBP 1 week before PONT and sacrificed 4 weeks after PONT. The treatment was achieved with a feeding needle (F.S.T., Heidelberg, Germany) by gavage once daily. There were two sets of animals (either set including the normal control, PBS, and LBP groups): one set was used for the axonal counting, and semithin and ultrathin sections of the ONs were prepared (n = 5 in each group); the other set was used for Iba-1 labeling to detect the effect of LBP on the function of microglia/macrophages, and frozen sections of the ONs were prepared for immunohistochemistry staining (n = 4 in the normal control group; n = 5 in either the PBS or the LBP group). The use of animals followed the requirements of the Cap. 340 Animals (Control of Experiments) Ordinance and Regulations in Hong Kong. All the experimental and animal handling procedures were approved by the Faculty Committee on the Use of Live Animals in Teaching and Research in The University of Hong Kong (CULATR #1850–09 and #1996–09).
PONT Surgery
The PONT surgery was performed as described previously (6,30). A partial incision 1.0 mm from the optic disc was made in the ONs using a pair of Spring Vannas scissors (15000–08; F.S.T., Heidelberg, Germany) as described previously (30) in the animals used for transmission electron microscope (TEM) analysis. A custom-made thin blade from razors was used for partial cut of the ONs in another set of animals used for immunohistochemistry staining (6). A marker at 200 mm from the tips of the blades or scissors was made to help limit the extent of the cut (Fig. 1). The axons in the directly damaged sites (the dorsal one third of the ONs) would undergo primary degeneration and the axons in the indirectly damaged sites (the central one third and ventral one third of the ONs) would undergo secondary degeneration (Fig. 1).

Schematic diagram showing the surgery of PONT. The partial incision in the ON was made 1.0 mm from the optic disc and was achieved using a pair of Spring Vannas scissors or using a custom-made sharp blade from razors; both were provided with a marker at 200 mm from the tips of blades. The axons in the direct damaged sites (dorsal one third of the ONs in the transverse sections from the cut site and the sites before the cut) would undergo primary degeneration, and the axons in the indirect damaged sites (central one third and ventral one third of the ONs in the transverse sections from the cut site and the sites before the cut) would undergo secondary degeneration.
Preparation of Semithin and Ultrathin Sections of ONs
Animals were anesthetized using an overdose intraperitoneal injection of pentobarbitone and perfused transcardially with normal saline, followed by 4% paraformaldehyde (PFA; International Laboratory USA, South San Francisco, CA, USA) in 0.1 M PB. The ONs from normal control rats and rats fed with 0.01 M PBS or LBP 1 week before PONT until 4 weeks after surgery (n = 5 in each group) were removed as close to the eyeballs as possible after sacrifice and postfixed in 2% PFA and 2.5% glutaraldehyde (Merck KGaA, Darmstadt, Germany) in 0.1 M PB for 24 h. Then the ONs were further postfixed in 1% osmium tetroxide (Electron Microscopy Sciences, Hatfield, PA, USA) in 0.1 M PB for 2.5 h, dehydrated with graded series of ethanol (30%, 50%, 70%, 80%, 90%, 95%, and 100%), infiltrated with propylene oxide (PO, Electron Microscopy Sciences), 1:1 mixture of PO and epoxy resin (Emgrid Australia Pty Ltd., The Patch, VIC 3792, Australia), and then embedded in pure epoxy resin. Semithin sections of 0.5 mm in thickness were obtained from the end of the ON segments close to the eyeball and stained with 1% toluidine blue (Bio-Rad, Life Science Research, Hercules, CA, USA). Then the sections were observed under light microscope to determine the orientation of the ON, which was marked on the resin block before performing ultrathin sections. The double contrast method was used for ultrathin section (100 nm) staining. The ultrathin sections were stained with 2% uranyl acetate (Polysciences, Inc., Warrington, PA, USA) for 20 min, followed by lead citrate (Thermo Fisher Scientific Inc., Waltham, MA, USA) for 10 min for observation, and photographs were taken under TEM (Philip CM 100 TEM: Electron Microscope Unit, HKU).
TEM Analysis of Axons and Myelin
This method was modified from that described by Payne et al. (39). After confirmation of the transverse orientation of the ON by observation under low power using the TEM, each ON was divided visually into three roughly equal areas: dorsal third, central third, and ventral third. In each area, 10 high-power images (5,800× magnification) were selected for analysis (Fig. 2). Total number of axons in each photograph with the size of 15.5 μm × 15.5 μm was calculated using ImageJ software (NIH, Bethesda, MD, USA) and then the average density (axon numbers/mm2) was determined in each area. The g-ratio (axon diameter/ nerve fiber diameter) and myelin thickness were calculated in the ventral ONs by randomly selecting 400 to 500 normally myelinated axons (thick, compact, high electrodensity myelin) (39) in each animal (40 to 50 axons in each image) with ImageJ software. The axons and nerve fibers (axon plus myelin) were not circular, so the diameter of each axon or nerve fiber was derived from a circle with the equal area to the axon or nerve fiber, and the g-ratio is obtained by dividing the diameter of an axon with the diameter of the nerve fiber (17,19,42). Myelin thickness was obtained by subtracting the axon diameter from the fiber diameter and dividing by two (39).

Schematic diagram showing the location where photographs were taken for axonal counting and g-ratio calculation. Ten high-power (5,800×) TEM images (represented by squares in the figure) within the dorsal, central, and ventral parts of ONs were used for analysis.
Immunohistochemistry Staining Protocol and Analysis of Results
Animals were sacrificed with an overdose of phenobarbital (Alfasan International B.V., Woerden, Holland) followed by transcardial perfusion with 0.9% saline followed by 4% PFA in 0.1 M PB. The segments of ON about 2.5 mm in length, including the ends closest to the eyeballs, the cut sites, and the ends distal to the cut location, were dissected and postfixed in 4% PFA for 24 h at 4°C, cryoprotected by immersion in 30% sucrose (Sigma-Aldrich) in PB overnight, embedded in optimal cutting temperature compound (Tissue Tek; OpticsPlanet, Inc., Northbrook, IL, USA), and serially cryosectioned transversely (16 um) in 10 sets with about 16 sections in each set. Then the ON sections were air dried, rehydrated in PBS, blocked with 10% normal goat serum (Invitrogen, Fisher Scientific UK Ltd., Loughborough, UK) for 1 h, and incubated overnight at 4°C in primary antibodies detecting β-III tubulin (1:500 TUJ1 antibody clone, mouse monoclonal; Convance, Emeryville, CA, USA) and microglia/macrophages (1:800 Iba-1, rabbit polyclonal; Wako, Osaka, Japan). The TUJ1 antibody clone is used for staining neuron-specific class III β-tubulin and therefore can label the axons in the ON and show the structure of ONs. Iba-1 can detect resting and activated microglia and macrophages. Signals were visualized by reacting with corresponding fluorescent secondary antibodies (1:400; Invitrogen, Fisher Scientific) for 2 h at room temperature. Then the sections were washed and coverslipped for examination. The ratios of the immunohistochemistry-positive labeling area of Iba-1 to the whole area in the ON transverse section were determined using ImageJ software using a modified method described previously (14). The ratios of the immunohistochemistry-positive labeling area of Iba-1 in each one third of the ONs to the total area of each one third of the ONs (the dorsal, central, and ventral ONs) were determined using the same method.
Statistical Analysis
All data were expressed as the mean ± standard error of the mean (SEM). One-way ANOVA was used for multiple comparisons followed by Dunn's or Student–Newman–Keuls (SNK) method as post hoc tests. Data were analyzed statistically with the Sigmastat software (Sigmastat 3.5; Systat Software Inc., Chicago, IL, USA). The level of p = 0.05 was considered to be statistically significant.
Results
LBP's Effect on the Degeneration of Optic Fibers
Under the Philips CM100 TEM, all ON fibers showed intact morphology with normal myelin in the dorsal part, the central part, and the ventral part in the normal ONs (Fig. 3A–C). The average densities of total axons in the dorsal, central, and ventral areas in the normal group were 568,970 ± 47,050 axons/mm2, 588,860 ± 36,660 axons/mm2, and 580,040 ± 34,160 axons/mm2, respectively (Fig. 4A). In the PBS group 4 weeks after PONT, the morphology of the axons and myelin changed significantly. In the dorsal part of the ONs (primary injury site), the loss of axons was severe, and the average density of axons in the dorsal areas was 284,400 ± 29,310 (Fig. 4A). The dark degeneration (arrow in Fig. 3D) and watery degeneration (white asterisk in Fig. 3D) could be seen. The definition of dark and watery degeneration has been described by Saggu et al. (41). In addition, the axonal regions were replaced by many macrophages (arrowhead in Fig. 3D) and empty spaces (black asterisks, Fig. 3D). In the central part (secondary injury site close to primary injury site), the loss of axons was still obvious but not as severe as in the dorsal ONs, and the average density was 366,990 ± 78,150 axons/mm2 (Fig. 4A). Many empty spaces (black asterisk, Fig. 3E) and broken myelin (white asterisk, Fig. 3E) appeared in the area, but some axons showed intact structure with slight atrophy (arrow, Fig. 3E). In the ventral part (the secondary injury site further from the primary injury site), the loss of axons was not obvious in the PBS group, and the average density of axons was 519,600 ± 73,320 axon/mm2 (Fig. 4A). However, most of the axons were slightly shrunken (arrow, Fig. 3F). In the LBP group, the extent of axonal loss in the dorsal ON was similar to that of the PBS group, and the average density of axons was 253,350 ± 34,550 axons/mm2 (Figs. 3G and 4A). The dark degeneration (arrow in Fig. 3G) could be seen, and the axonal regions were replaced by many macrophages (arrowhead in Fig. 3G). In the central and ventral ONs, the loss of axons was not obvious compared with the normal group, and the average density of axons were 632,240 ± 45,940 axons/mm2 and 561,630 ± 61,710 axons/mm2, respectively (Figs. 3H, I and 4A). Although the densities of axons in the normal, PBS, and LBP groups were similar in the ventral ONs (Fig. 4A), the g-ratio in the ventral ONs decreased significantly in the PBS group (0.63 ± 0.04) compared with the LBP group (0.72 ± 0.01) and normal group (0.76 ± 0.01), whereas the myelin thickness remained unchanged (Fig. 4B, C). The average thickness of myelin in normal, PBS, and LBP groups were 0.14 ± 0.011 μm, 0.16 ± 0.007 μm, and 0.15 ± 0.007 μm, respectively (Fig. 4C). However, the morphology of axons in the ventral part in the LBP group was similar to that in the normal group (Fig. 3C and I).

Micrographs showing morphological changes of ONs through transverse sections under TEM. All ON fibers show intact morphology with normal myelin in the dorsal part (A), the central part (B), and the ventral part (C) in the normal ON. In the PBS (vehicle control) group 4 weeks after PONT, the morphology of the axons and myelin change significantly. In the dorsal ON, only a few axons can be seen in the PBS group. The dark degeneration (arrow in D) and watery degeneration (white asterisk in D) can be seen. In addition, the axonal regions are replaced by many macrophages (arrowhead in D) and empty spaces (black asterisk in D). In the central part (secondary injury site close to primary injury site), many empty spaces (black asterisk, E) and broken myelin (white asterisk, E) appear in the area, but some axons show intact structure but slightly shrunken (arrow, E). In the ventral part (the secondary injury site further from the primary injury site), most of the axons were slightly shrunken (arrow, F). In the LBP group, the extent of axonal loss in the dorsal ON was similar to that of the PBS group (G). The dark degeneration (arrow in G) can be seen, and the axonal regions are replaced by many macrophages (arrowhead in G). In the central and ventral ON, the loss of axons was not obvious compared with the normal group (H, I). The morphology of axons in the ventral part in the LBP group is almost similar to that in the normal group (I).

The effects of LBP on primary and secondary degeneration of ON fibers. (A) The axon densities decreased significantly in the PBS and LBP groups in the dorsal ONs 4 weeks after PONT, but there was no significant difference between the PBS and LBP groups. The axon densities decreased significantly in the PBS group in the central parts compared with the normal and LBP groups 4 weeks after PONT. There was no significant difference between the normal and LBP groups. The axon densities were similar among the normal, PBS, and LBP groups in the ventral parts 4 weeks after PONT (one-way ANOVA, SNK method for multiple comparisons: #p < 0.001; *p < 0.05; NS, no significance, n = 5 in each group). (B) The g-ratio decreased in the PBS group in the ventral parts of ON 4 weeks after PONT compared with normal and LBP groups (one-way ANOVA, SNK method for multiple comparisons: *p < 0.05; NS, no significance, n = 5 in each group). (C) Myelin thickness remained similar among normal, PBS, and LBP groups 4 weeks after PONT (one-way ANOVA: NS, no significance, n = 5 in each group).
Response of Microglia/Macrophages to PONT
In the present study, we firstly employed β-III tubulin immunostaining to identify the morphology of the transverse sections of the ONs. Figure 5 showed that dorsal fibers of the ON were disrupted at the injury sites. The sections with the intact profiles, which were closer to the eyeball than the cut sites, were stained with Iba-1 to evaluate the response of microglia/macrophages to PONT (Fig. 6). The reason to select this location was that the transected axons kept their pathway from the cut site to the eyeball by the lipophilic membrane dye DiI tracing in vivo in SD rats (30). Therefore, the primary and secondary injury location was kept in the transverse sections of the ONs from the cut site to the eyeball. In addition, the ultrathin sections for axonal counting were also examined at a location closer to the eyeball than the cut sites.
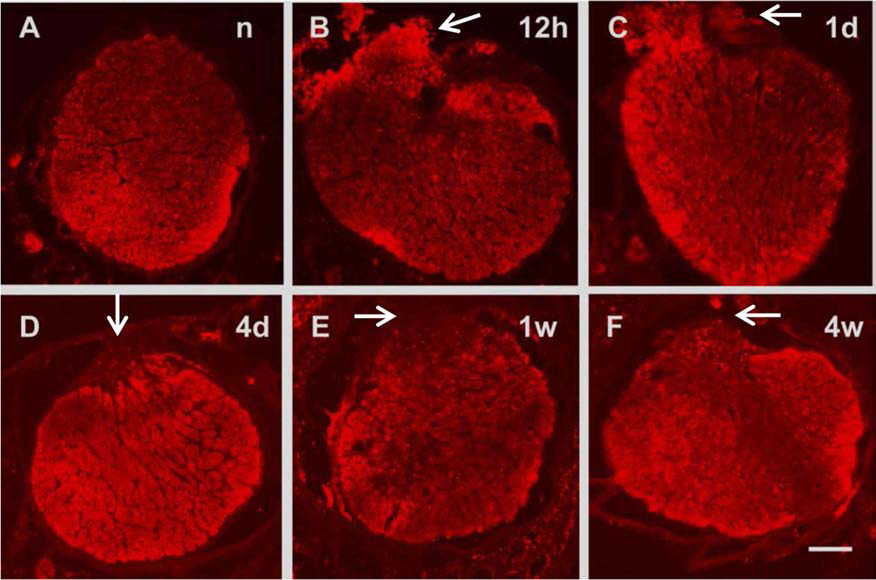
The morphology of the transverse sections of ONs stained with β-III tubulin from the cut sites. (A) The profile of the normal ON from the cut site. The profile was intact, and the border was smooth. (B–F) The profiles of ONs were disrupted at 12 h (B), 1 day (C), 4 days (D), 1 week (E), and 4 weeks (F) after PONT. The protrusion could be seen from the dorsal part where the cut was made (indicated by arrows) (scale bar: 100 μm).

The morphology of Iba-1-positive microglia/macrophages. (A–F, scale bar: 100 μm) The whole distribution of Iba-1-positive labeling in the normal ONs and ONs after PONT. The d, c, and v represent the dorsal third, central third, and ventral third in each time point. The distribution of Iba-1-positive cells was almost even in the dorsal, central, and ventral parts in the normal ONs (A). It was similar in the ONs 12 h and 1 day after PONT (B, C). There were obviously more Iba-1-positive cells both in the dorsal and central ONs 4 days and 1 week after PONT compared with ventral ONs (D, E). Four weeks after PONT, more positive cells in the dorsal ON compared with the central and ventral ONs (F). (G–X, scale bar: 25 μm) The morphology of Iba-1-positive cells in each third of the ONs of normal animals (G–I) and animals 12 h (J–L), 1 day (M–O), 4 days (P–R), 1 week (S–U), and 4 weeks (V–X) after PONT. (G–I) The morphology of the Iba-1-positive cells under normal conditions. Most cell bodies of Iba-1-positive cells were small with long and thin processes indicating resting microglia morphology in each third of the ON (arrows, H and I), although occasionally one or two activated cells could been seen (arrowheads, I). (J–O) The morphology of the Iba-1-positive cells 12 h and 1 day after PONT. The cell bodies of Iba-1-positive cells became enlarged with shorter processes (partially activated cells, arrowheads, K–M) or showed the spherical cell morphology (fully activated cells, arrows, J and O) at 12 h and 1 day after PONT. (P–R) The morphology of the Iba-1-positive cells 4 days after PONT. Almost all of the activated microglia/macrophages showed a spherical morphology (arrow), and some cells overlapped with each other to make the differentiation of individual cells difficult (arrowheads). (S–U) Most cells remained in the fully activated state 1 week after PONT (arrows). (V–X) Until 4 weeks after PONT, in addition to the spherical cells (arrows), some partially activated cells appeared again (arrowheads).
Iba-1 is a calcium-binding protein expressed mainly in resting and activated microglia and macrophages and is upregulated during the activation of these cells. According to Davis et al., the morphology of microglia can be divided into three kinds according to various activity: ramified appearance (resting cells), swollen ramified appearance (partially activated cells), and spherical appearance (fully activated cells) (13). Our study showed that in the normal condition, most cell bodies of Iba-1-positive cells were small with long and thin processes, which indicated the morphology of resting microglia (arrows, Fig. 6H, I), although occasionally one or two activated cells could been seen (arrowheads, Fig. 6I). However, the cell bodies of Iba-1-positive cells became enlarged with shorter processes (partially activated cells, arrowheads, Fig. 6K–M) or showed the spherical cell morphology (fully activated cells, arrows, Fig. 6J, O) at 12 h and 1 day after PONT. Four days after PONT, almost all the activated microglia/macrophages showed spherical morphology (arrow, Fig. 6P–R) and some cells overlapped with each other to make the differentiation of individual cell difficult (arrowheads, Fig. 6P, Q). Most cells remained fully activated 1 week after PONT (arrows, Fig. 6S–U). Until 4 weeks after PONT, in addition to the spherical cells (arrows, Fig. 6V–X), some partially activated cells appeared again (arrowheads, Fig. 6V).
In addition to the transformation of the morphology, the magnitudes of microglia/macrophages response, which were represented by the ratios of the positive areas of Iba-1 labeling to the total stained areas, increased in the whole ONs (4 days: 0.207 ± 0.029, 1 week: 0.087 ± 0.009, and 4 weeks: 0.088 ± 0.011), the dorsal ONs (4 days: 0.279 ± 0.045, 1 week: 0.142 ± 0.017, and 4 weeks: 0.149 ± 0.020), and central ONs (4 days: 0.234 ± 0.041, 1 week: 0.087 ± 0.015, and 4 weeks: 0.073 ± 0.013) at 4 days, 1 week, and 4 weeks after PONT compared with normal rats (total: 0.031 ± 0.006, dorsal: 0.020 ± 0.004, and central: 0.038 ± 0.010), although the response magnitudes were similar among the normal group, 12 h after PONT group, and 1 day after PONT group in the whole ONs (normal: 0.031 ± 0.006, 12 h: 0.027 ± 0.011, and 1 day: 0.038 ± 0.005) and each third of the ONs (Fig. 7A). In the dorsal areas, the ratios in the normal, 12 h, and 1 day after PONT groups were 0.020 ± 0.004, 0.047 ± 0.039, and 0.041 ± 0.008, respectively. In the central areas, the ratios in the normal, 12 h, and 1 day after PONT groups were 0.038 ± 0.010, 0.026 ± 0.010, and 0.030 ± 0.008, respectively. In the ventral areas, the ratios in the normal, 12 h, and 1 day after PONT groups were 0.031 ± 0.010, 0.018 ± 0.004, and 0.028 ± 0.003. In addition, the magnitude decreased significantly from 1 week after PONT when compared with the magnitude of 4 days after PONT in the whole ONs, dorsal ONs, central ONs, and ventral ONs (Fig. 7A). In the ventral ONs, the magnitude of Iba-1-positive labeling only increased on the fourth day (0.099 ± 0.015) after PONT but not on other time points after PONT (12 h: 0.018 ± 0.004, 1 day: 0.027 ± 0.003, 1 week: 0.038 ± 0.005, and 4 weeks: 0.038 ± 0.005) (Fig. 7A).

The ratios of the positive labeling areas of Iba-1 in whole ONs, dorsal ONs, central ONs, and ventral ONs. (A) Iba-1-positive labeling areas increased from 4 days after PONT until 4 weeks after PONT in whole ONs, dorsal ONs, and central ONs, but the magnitude decreased from 1 week after PONT. In the ventral ONs, Iba-1-positive labeling increased 4 days after PONT, but not at other time points studied (one-way ANOVA, SNK test for multiple comparisons: #p < 0.001; ≠p < 0.001; *p < 0.05, n = 4 in each group). (B) In normal animals and animals 12 h and 1 day after PONT, the ratios of Iba-1-positive labeling in the dorsal, central, and ventral ONs were similar. However, at 4 days and 1 week after PONT, the ratios of positive labeling in the dorsal and central ONs were similar and greater than those in the ventral ONs (one-way ANOVA, SNK test for multiple comparisons: #p < 0.001; ≠p < 0.001; *p < 0.05; NS, no significance, n = 4 in each group).
Then, when the response magnitudes in each third portion (dorsal, central, and ventral) of the ON were compared in the same group, the results showed that in normal animals and animals 12 h and 1 day after PONT, the ratios of Iba-1-positive labeling in each third were similar (Fig. 7B). But 4 days and 1 week after PONT, the ratios of positive labeling in the dorsal and central ONs were similar and greater than that in the ventral ONs (Fig. 7B). Four weeks after PONT, the ratio of Iba-1-positive labeling in the dorsal ON was greater than that in the central and ventral ONs (Fig. 7B).
Effect of Lycium barbarum on the Response of Microglia/Macrophages to PONT
The ratios of Iba-1-positive labeling areas of the whole ONs were 0.031 ± 0.006, 0.137 ± 0.007, and 0.069 ± 0.015 in the normal, PBS, and LBP groups, respectively. In the dorsal ONs, the ratios of Iba-1-positive labeling areas were 0.020 ± 0.004, 0.182 ± 0.013, and 0.101 ± 0.017 in the normal, PBS, and LBP groups, respectively. In the central ONs, the ratios of Iba-1-positive labeling areas were 0.038 ± 0.010, 0.117 ± 0.015, and 0.068 ± 0.020 in the normal, PBS, and LBP groups, respectively. In the ventral ONs, the ratios of Iba-1-positive labeling areas were 0.031 ± 0.010, 0.059 ± 0.013, and 0.022 ± 0.008, respectively. The results showed that LBP decreased the ratios of Iba-1-positive labeling areas in the whole ONs, dorsal ONs, and central ONs 4 weeks after PONT (Fig. 8A, B).
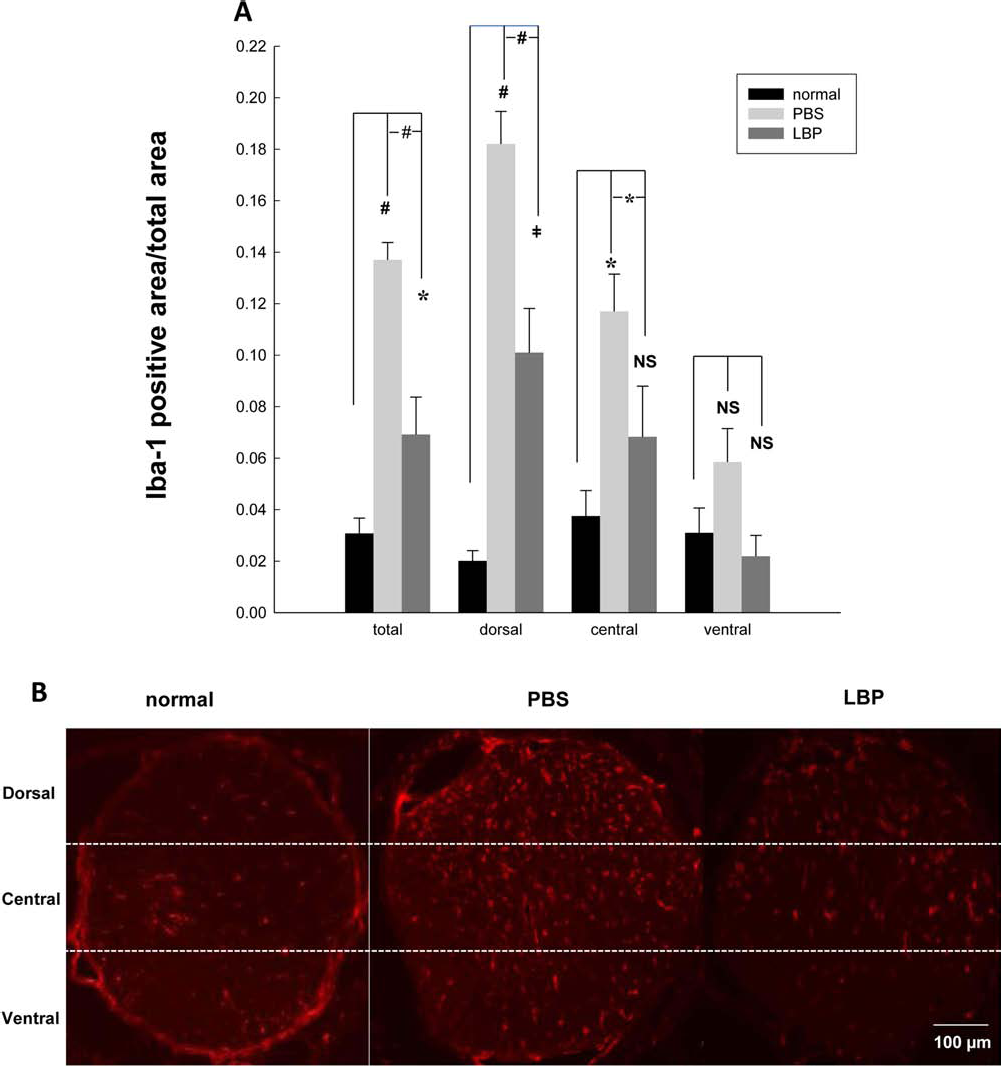
The ratios of Iba-1-positive labeling areas in normal, PBS, and LBP groups. (A) LBP decreased the ratios of Iba-1-positive labeling in whole ONs, dorsal ONs, and central ONs 4 weeks after PONT (one-way ANOVA, SNK test for multiple comparisons: #p < 0.001; ≠p < 0.001; *p < 0.05; NS, no significance, n = 4, 5, 5 in normal, PBS, and LBP groups, respectively). (B) The representative photographs from normal, PBS, and LBP groups (scale bar: 100 μm).
Discussion
In this study, our results showed that LBP could decrease secondary degeneration of axons in the ONs 4 weeks after PONT. In addition, microglia/macrophages were activated in the whole ON (both primary and secondary injury sites) from 12 h after PONT and LBP could alleviate the response magnitude of microglia/macrophages 4 weeks after PONT.
The fruit of Lycium barbarum is a traditional medicine in China, and it has long been used as a functional food as well as for medicinal purposes. In Chinese medicine, Lycium barbarum was recorded to have the efficacy to nourish the liver and kidney and be good for the eye. Modern studies elucidate that extracts from Lycium barbarum have a great number of biological activities in different animal models. These studies indicated that it had potential effects against cancer (44,59), liver injury (12,51), overweight (1), cardiovascular diseases (52), and inflammatory diseases (44). It could also modulate immunity (47) and sex behavior (27). In addition, Lycium barbarum has neuro-protective roles (7,9,20–22,30,32,36,54,56). In an eye study, our group showed that LBP could decrease secondary degeneration but not primary degeneration of the cell bodies of RGCs in the retinas after PONT (30). LBP could also improve the function of other cell types in the outer retinas, such as bipolar cells and photoreceptors, which were affected secondarily to the PONT, in addition to inner retinas (RGCs) (9). In this study, LBP was shown to decrease secondary degeneration in the central ONs rather than primary degeneration in the dorsal ONs. Therefore, all our results pointed to the fact that LBP could delay a variety of secondary degeneration caused by PONT, including RGC bodies in the inner retinas, secondary functional injury in the outer retinas, and secondary degeneration of axons in the ONs. In addition, our results showed that secondary degeneration mainly occurred in the central ONs that were closer to primary injury site rather than ventral ONs, which were further away from the primary injury site 4 weeks after PONT. This result indicated that secondary degeneration of axons in the ONs occurred in a location-dependent pattern.
Although the densities of axons were similar among normal, PBS, and LBP groups in the ventral ON in this study, marked morphological changes after PONT in the PBS group were indicated by the decreased g-ratio. The decrease in the g-ratio indicated a change in the ratio of axon diameter to the fiber diameter and might be caused by the shrinkage of the axons or the thickening of the myelin. However, our study showed that no change in myelin thickness was detected in the ventral ONs of the PBS group. Therefore, the decrease in g-ratio was most likely due to a decrease in the axon diameter in the ventral ON 4 weeks after PONT. The decrease in the axon diameter might also indicate the dysfunction of the axons. Because no axon loss was detected in the ventral ON by then, this result also indicated that the morphological change and the dysfunction of axons preceded the death of axons after PONT.
Oxidative stress and activation of microglia/macrophages occurred in the early stage after PONT, and the former was precedent to the latter based on the cell counting result of Iba-1-positive labeling (16). However, they did not observe the morphological changes of microglia/macrophages after PONT. The first aim of our study was to detect if the time point of microglia/macrophage activation would be different based on the morphological change. The results in this experiment indicated that the microglia were activated (shown by the transformation of morphology) in the whole ONs (both primary and secondary injury sites) from 12 h after PONT, which was earlier than that indicated by cell counting result (3 days after PONT) (16) or percentages of Iba-1-positive labeling areas in our study (later than 1 day and earlier or equal to 4 days after PONT). The response magnitudes of microglia/macrophages were greatest 4 days after PONT in the dorsal, central, and ventral ONs and then decreased. But the activation of microglia/macrophages persisted in the dorsal and central ONs until 4 weeks after PONT, which was the longest time point investigated in our study. At the same time, the magnitude returned to normal in the ventral ONs. But the activation was possibly longer than 4 weeks in dorsal and central ONs and microglia/macrophages played a pivotal role in both primary and secondary degeneration of axons in the ONs for a long period of time. Microglia/macrophages were shown to be a source of free radicals (4). Then our results indicated that microglia/macrophages might be activated as early as the occurrence of oxidative stress after PONT and be the source of ROS.
Our results also showed that LBP could decrease the response of microglia/macrophages in both primary (dorsal ONs) and secondary injury sites (central ONs). The activated microglia/macrophages are divided into two subtypes: M1 and M2. The deleterious M1 cells produce ROS and other harmful molecular effectors, such as proinflammatory cytokines including interleukin (IL)-1β, IL-6, IL-23, and tumor necrosis factor-α (4), but the beneficial M2 cells have protective effects (4). It is reasonable to hypothesize that LBP could decrease M1 cell number as well as increase M2 cell number after PONT, since LBP could decrease oxidative stress in the retinas after PONT (30) and increase M2 cell number after spinal cord injury (58). It would be interesting to study the numbers of M1 and M2 cells in the ONs from animals treated with LBP after PONT in the future. Although LBP could decrease the activation of microglia/macrophages in both primary and secondary injury sites, only secondary degeneration of axons in the central ONs was delayed by LBP but not primary degeneration in the dorsal ONs. A possible reason was that the primary degeneration was caused by the direct damage and too severe to be slowed down, although the response of microglia/macrophages was inhibited to some extent. In addition, additional mechanisms other than the activation of microglia/macrophages, which could not be modulated by LBP, could also take part in the primary degeneration. This point needs further investigation.
In conclusion, our results showed that the time point of microglia/macrophage activation based on the morphology was much earlier than that based on quantitative analysis, and they might involve in oxidative stress after PONT. LBP could decrease secondary degeneration of axons by inhibiting the activation of microglia/macrophages 4 weeks after PONT. Therefore, LBP might be a promising herbal medicine for treatment of secondary degeneration in neurodegenerative diseases of the CNS.
Footnotes
Acknowledgments
This work was funded by The National Program on Key Basic Research Project of China (KFS, 973 Program: 2011CB707501 and 2014CB542205); The Fundamental Research Funds for the Central Universities Grant (KFS, 21609101); General Research Fund (PolyU 5605/13M) from Research Grants Committee of the Hong Kong SAR and Departmental General Research Fund (G-UA2E and Z0GF) from The Hong Kong Polytechnic University. The funders had no role in study design, data collection and analysis, decision to publish, or preparation of the manuscript. The authors declare no conflicts of interest.