
Abstract
The central nervous system (CNS) of adult mammals generally does not regenerate, and many studies have attempted to identify factors that could increase neuroprotection and/or axonal outgrowth after CNS lesions. Using the optic nerve crush of rats as a model for CNS injury, we investigated the effect of intravitreal transplantation of syngeneic bone-marrow mononuclear cells (BMMCs) on the survival of retinal ganglion cells (RGC) and on the regeneration of optic axons. Control animals received intravitreal saline injections after lesion. Injections of BMMCs resulted in a 1.6-fold increase in the number of RGCs surviving 14 days after injury. The BMMC-treated animals also had increased numbers of axons, which grew up to 1.5 mm from the crush site, and also had reduced Müller glia activation. Analysis of mRNAs in all conditions revealed an increase in levels of fibroblast growth factor 2 (FGF-2) mRNA in treated animals 14 days after injury. To investigate whether the regenerated axons could reach the brain, we retrograde labeled the RGCs by injecting a lipophilic tracer into the superior colliculus. We also analyzed the expression of NGFI-A in the superficial layers of the superior colliculus as a possible marker of synaptic input from RGC axons. We found evidence that more RGCs were able to reach the brain after treatment and we showed that NGFI-A expression was higher in the treated animals 60 days after injury. These results demonstrate that transplant of BMMCs can increase neuroprotection and neuroregeneration after injury in a model of optic nerve crush, and these effects could be mediated by FGF-2.
Introduction
Regeneration of the central nervous system (CNS) in adult mammals is limited, and no existing therapies effectively increase neuroprotection and axonal outgrowth after injury. Lack of regeneration after lesion has been attributed partly to the weak invasion of macrophages and glial scar formation (3). Poor macrophage invasion results in prolonged clearing of myelin debris and of the well-known axonal outgrowth inhibitory molecules present in myelin (6,18,22,53). Additionally, astrocytes form a glial scar, which is a physical barrier to axonal outgrowth and also contains inhibitory molecules (2,46).
The optic nerve is a widely used model of CNS regeneration because it can be easily accessed and manipulated. Experimental models of optic nerve injury usually involve crush or complete transection of the nerve, and both injuries cause substantial retinal ganglion cell (RGC) death (30,51).
Several studies have attempted to modify the inhibitory environment of the CNS to stimulate regeneration, showing that RGC axons can grow in sciatic nerve grafts (47), enter the superior colliculus (SC) (50), and form functional synaptic connections (45). To counteract inhibitory signals from the CNS environment, other groups have used Nogo-A antibodies (14) or Nogo receptor knockout mice (48), with varying results.
It has been shown that transgenic mice overexpressing bcl-2 (9,14,42) exhibit increased RGC survival, and it has also been demonstrated that manipulating the RGC intrinsic growth program can increase optic nerve regeneration (19,38,41), although in some cases, combined therapies are necessary (19).
In a different approach, it has also been shown that intravitreal peripheral nerve transplantation (3) and lens injury stimulate RGC axonal outgrowth (20,21,29). Some have suggested that this effect depends on the presence of macrophages (57), and have identified the protein oncomodulin as the macrophage-derived signal for axonal regeneration (56,58).
Neurotrophic factors such as fibroblast growth factor 2 (FGF-2) (44) also increase optic nerve regeneration, and treatment with glia-derived neurotrophic factor (GDNF) (28) and brain-derived neurotrophic factor (BDNF) (11) increases RGC survival. The role of ciliary neurotrophic factor (CNTF) in regeneration after optic nerve injury has been controversial in the field, with some groups finding only a minor effect (34), some finding an effect only on RGC survival (54), and other groups associating this factor with lens injury-induced regeneration (39) or macrophage activation (8). The use of neurotrophic factors has promising results, but requires viral vectors or a continuous supply of these factors, which makes their clinical use impractical.
In the present study, we transplanted syngeneic BMMC into the vitreous body, to stimulate optic nerve regeneration and RGC survival. Bone marrow cells express growth factors such as nerve growth factor (NGF) and BDNF when cultured in control conditions (15), and increase the production of vascular endothelial growth factor (VEFG), hepatocyte growth factor (HGF), and BDNF in the presence of ischemic cerebral tissue (13).
Yu et al. (59) showed that bone marrow cells injected into the eye of an experimental model of glaucoma expressed several trophic factors and increased RGC survival. Mesenchymal cells derived from bone marrow have also been used in a model of glaucoma by laser-induced ocular hypertension, and it has been shown that the intravitreal transplantation of these cells a week prior to the lesion reduces optic nerve degeneration induced by elevated intraocular pressure (27).
In our model, we injected BMMC immediately after optic nerve crush. We were able to show that axonal outgrowth and RGC survival increased in the transplanted animals. Also, Müller glia activation, which is generally associated with retinal stress, was downregulated, and levels of FGF-2 mRNA in the treated animals increased 14 days after the injury. In addition, we found evidence that, in the treated animals, the regenerated axons were able to reach the brain.
Materials and Methods
Bone Marrow Mononuclear Cell Extraction and Labeling
Adult Lister-hooded rats were deeply anesthetized, euthanized by cervical dislocation, and had the femurs and tibias removed. Bone marrow cells were extruded with a syringe containing Dulbecco's modified Eagle's medium with F12 supplement (DMEM, Invitrogen Inc., Carlsbad, CA, USA) and separated by density gradient on Histopaque (Sigma, St. Louis, MO, USA). The cell fraction on the interface between Histopaque and medium (bone marrow mononuclear cell fraction) was aspirated, washed three times with phosphate-buffered saline (PBS) solution, and incubated with CellTrace™ Far Red DDAO-SE (Invitrogen) diluted in DMEM (1:500) for 45 min at 37°C in a 5% CO2 incubator. In five animals, BMMCs were labeled with DAPI (4′,6-diamidino-2-phenylindole, from Sigma). Cells were washed four times with PBS, counted in a hemocytometer, and resuspended in saline for injection. Cells were injected in a solution of 5 μl saline in a concentration of 106 cells/μal, for a total of 5 × 10⁶ cells per injection.
Optic Nerve Crush and Intraocular Injections
Surgical procedures were similar to those described previously (3) and were approved by the Committee for the Use of Experimental Animals of our Institution. Briefly, adult Lister-hooded rats were anesthetized by intraperitoneal injection of ketamine (50 mg/kg) and xylazine (5 mg/kg), and a 2-mm incision was made in the skin below the left orbit. Under a stereoscopic microscope, the fatty tissue was removed to access the optic nerve. The nerve was crushed 1 mm behind the sclera with liquid-nitrogen-frozen tweezers for 15 s; this procedure was repeated three times at 5-s intervals, avoiding injury to the ophthalmic artery. The injured nerve became whitish at the crush site. The integrity of the retina blood vessels was evaluated by fundoscopic examination, and animals showing doubtful vascular integrity were excluded from the study. Immediately after the crush, the control group was injected with saline and the treated group received BMMCs. We also injected dead BMMCs in a third group, as an additional control. For that experiment, the BMMCs were heated for 5 min at 80°C and the viability was assessed by trypan blue and live/dead assays (Invitrogen).
The injections were made into the vitreous body with a 5-μl Hamilton syringe, at the border between the sclera and the cornea, avoiding injury to the lens. The procedure was monitored with a surgical microscope, and animals that had the lens injured were excluded. The needle was kept in place for an additional period of 2 min, and withdrawn slowly to reduce leakage from the injection site. The animals were kept in a warm cage for recovery from anesthesia before being returned to the animal facility, where they received food and water ad libitum.
Immunohistochemistry
One, 14, or 21 days after optic nerve crush, the animals were euthanized with an overdose of anesthesia and perfused through the heart with ice-cold saline, followed by 4% paraformaldehyde in 0.1 M phosphate buffer, then 4% paraformaldehyde in 0.1 M phosphate buffer with 10% sucrose. Eyes and attached nerve segments were dissected to the level of the optic chiasm, cleaned of connective tissue, postfixed in 4% paraformaldehyde in 0.1 M phosphate buffer with 10% sucrose (2 h, at room temperature), and transferred to a 20% sucrose solution (overnight, 4°C). For the experiments with the NGFI-A, the animals were euthanized and perfused 60 days after optic nerve crush followed by 24 h of dark adaptation and 2 h of light stimulation (23,24). After perfusion, the brain was dissected. Tissue was embedded in optimal cutting temperature (OCT) compound (Tissue-Tek, Sakura, Japan), nerves and eyes were cut longitudinally and brains were cut coronally on a cryostat (Leica Microsystems Nussloch GmbH, Germany) at 14–20 μm thickness, and sections were collected on gelatin-coated slides for later immunohistochemistry analysis.
Tissue sections were preincubated in 5% normal goat serum (Sigma) in PBS for 30 min at room temperature to block nonspecific binding. The sections were incubated with primary antibodies in 0.1% Triton X-100 in PBS overnight at 4°C. After incubation with the primary antibodies, the sections were washed in PBS and then incubated with the appropriate secondary antibodies for 2 h at room temperature. Growth-associated protein 43 (GAP-43) expression was observed with the IgG fraction of an antibody made in sheep (1:2500; kindly donated by Dr. Larry Benowitz, Children's Hospital, Harvard Medical School, Boston, MA, USA) or with the IgG fraction of an antibody made in rabbit (1:50; Santa Cruz Biotechnology, Santa Cruz, CA, USA). In the former case, the secondary antibody used was a biotinyl-ated rabbit anti-sheep IgG (1:250; Vector Laboratories, Burlingame, CA, USA) followed by Cy3-conjugated streptavidin (Jackson ImmunoResearch Lab. Inc., West Grove, PA, USA). In the latter case, the secondary antibody used was an Alexa 488-conjugated goat anti-rabbit IgG (1:200; Invitrogen Inc., Carlsbad, CA, USA). Glial fibrillary acidic protein (GFAP) expression was used as a marker for Müller glia activation, and was visualized with the IgG fraction of an antibody made in rabbit (1: 400; DAKO, Carpinteria, CA, USA) followed by an Alexa 488-conjugated goat anti-rabbit IgG (1:200; Invitrogen) as secondary antibody. The CD11b expression was analyzed with the IgG fraction of an antibody made in mouse followed by an Alexa 488-conjugated goat anti-mouse IgG (1:200; Invitrogen) as secondary antibody. In these sections, the incubation was performed in PBS without Triton X-100. The NGFI-A expression was analyzed with the IgG fraction of an antibody made in rabbit (anti-egr1, 1:400; Santa Cruz Biotechnology) followed by an Alexa 488-conjugated goat anti-rabbit IgG (1:200; Invitrogen). In some cases the tissues were incubated with Sytox® Green (200 nM; Invitrogen) for nuclei counterstaining. After washing (three times in PBS), the slides were mounted with VectaShield (Vector Laboratories) and analyzed by confocal microscopy (Zeiss, LSM 510 META or LSM 510 META NLO). Slides from the three different conditions were always stained at the same time.
Quantification of Axon Outgrowth
Axonal outgrowth was quantified by counting the number of GAP-43+ axons located at 0.5, 1, and 1.5 mm from the crush site in longitudinal optic nerve sections using an epifluorescence microscope and a 40× objective. The counts were done by blinded observers, and we quantified at least five sections per animal (14–20 μm of width). The total number of axons per nerve was calculated as described by Leon et al. (29). Briefly, we used the equation: Σαd = πr2 × [average axons/mm]/t. The number of axons per millimeter was calculated after measuring the nerve width at 0.5, 1, and 1.5 mm from the crush site (regions where the counts were made). t represents section thickness, which varied from 14 to 20 μm, and r represents the radius of the nerve. Statistical analysis was done using GraphPad Prism 5.02 (1992–2004 GraphPad Software, Inc.) using a nonparametric unpaired one-tailed Mann-Whitney test.
Quantification of Ganglion Cell Survival
Cell survival was quantified using the lipophilic tracer DiI (1,1′-dioctadecyl-3,3,3,3′-tetramethylindocar-bocyanine perchlorate, Invitrogen) for retrograde labeling. DiI was bilaterally injected into the superior colliculi 7 days before optic nerve crush. This technique allowed us to label virtually all the RGCs. Rats were anesthetized by intraperitoneal injection of ketamine (50 mg/kg) and xylazine (5 mg/kg) and placed in a stereotaxic apparatus. A midline incision was made in the skin, and a small hole was made in the bone above the superior colliculi (6.3 mm posterior from bregma; 1.2 mm wide and 3.5 mm deep) and 4 μl of DiI was delivered stereotaxically (2.5% in dimethylformamide, Sigma). Seven days after the DiI injection, animals underwent an optic nerve crush combined with either saline injection or BMMC transplantation into the vitreous body, as described previously. The right eye (without the crush or injections) was used as control. Fourteen days after crush, animals were euthanized. At this time point, the cells that remained alive could be visualized by the DiI labeling and could be quantified. For that, the retinas were dissected without fixation, flat mounted, and fixed onto gelatinized glass slides with 4% paraformaldehyde for 15 min at room temperature. Retinas were then washed three times with PBS and stained with bisbenzimide (0.1% in PBS; Sigma) to observe the nuclei. The slides were covered with cover slips in PBS, and the retinas were analyzed by confocal microscopy. Five pictures of regions radially distributed at 1 mm from the optic disc, and three pictures of regions radially distributed at 2 mm from the optic disc were taken using a 20× objective. Counts were made in a double-blind way and were averaged across the six regions. The statistical analysis was done using GraphPad Prism 5.02 (1992–2004 GraphPad Software, Inc.), using an unpaired two-tailed t-test.
Quantification of GFAP+ Müller Cell Processes
GFAP+ Müller glia processes were counted as described previously (36). Briefly, the GFAP+ processes were counted in three same-sized regions (500 μm) in 20-μm retinal sections from control animals and 14 days after optic nerve crush combined with saline injection or with bone marrow cell transplantation. The regions covered the central and peripheral retina. Processes traversing the inner plexiform layer of the retina were counted. The number of GFAP+ Müller cell processes per section was averaged, and the results were expressed as mean ± SEM. Statistical analysis used GraphPad Prism 5.02 (1992–2004 GraphPad Software, Inc.), with one-way ANOVA and Newman-Keuls Multiple Comparison Test as a post hoc test.
Analysis of Axonal Outgrowth to the Brain
The arrival of axons to the brain was analyzed using DiI for retrograde labeling. DiI was bilaterally injected into the superior colliculi 60 days after optic nerve crush. The procedure was similar to that previously described for quantification of cell survival, but instead of injecting the dye before the crush, we injected it after the crush. By doing this, we were not labeling all the RGCs as in the previous experiment, but only the RGCs whose axons were able to reach the brain.
Seven days after the DiI injection, animals were euthanized; the retinas were dissected without fixation, flat mounted, and fixed onto gelatinized glass slides with 4% paraformaldehyde for 15 min at room temperature. Retinas were then washed three times with PBS and stained with bisbenzimide (0.1% in PBS; Sigma) to observe the nuclei. The slides were covered with cover slips in PBS, and the retinas were analyzed by confocal microscopy. The right retina was analyzed as a control for the labeling, and the whole left retina was analyzed in an epfluorescence microscope using a 40× objective. DiI+ cells were counted across the whole retina. The statistical analysis was done using GraphPad Prism 5.02 (1992–2004 GraphPad Software, Inc.), using an unpaired two-tailed t-test.
Reverse Transcription and Polymerase Chain Reaction (PCR)
Total RNA was extracted from retinas using TRIzol reagent (Invitrogen). Total RNA (2 μg) was treated with DNAse I, amplification grade (Invitrogen), and reverse-transcribed with Superscript II Reverse Transcriptase (Invitrogen) and with OligodT18 (IDT, Coralville, IA, USA). PCR reactions were performed with Platinum® Taq DNA Polymerase (Invitrogen). RNA extraction, cDNA synthesis, and PCR reactions followed the respective manufacturers' instructions. FGF-2, TGF (transforming growth factor), CNTF, and GAPDH were amplified using 60°C melting temperature. BDNF and VEGF were amplified using 63 °C melting temperature. PCR products were analyzed by electrophoresis on 1.5% agarose gel stained with ethidium bromide. GAPDH was used as an internal amplification control. Primer sequences were: BDNF, 5′-AATGCTCACACAACACT GCCCA and 5′-GGAGGAGGGAGGGAAAGAATGT; FGF-2, 5′-AGGAAGATGGACGGCTGCTG and 5′-GCCCAGTTCGTTTCAGTGCC; CNTF, 5′-TGAAGA CAGAAGCAAACCAGC and 5′-AGAACGGCTACA GAGGTCCC; VEGF, 5′-GAGTATATCTTCAAGCCG TCCTGT and 5′-ATCTGCATAGTGACGTTGCTCTC; TGF, 5′-AACAAGTGCCCAGATTCCCACA and 5′-ACACATGCTGGCTTCTCTTCCT; GAPDH, 5′-AT CAAGAAGGTGGTGAAGCAGG and 5′-AGGTGGA AGAGTGGGAGTTGCT.
Quantitative Real-time PCR (Q-PCR)
Quantitative determination of FGF-2 mRNA levels was performed using 1x of Power SYBR Green PCR Master Mix® (Applied Biosystems, Foster City, CA, USA) and 0.5 μM of each primer. PCR reactions were carried out in an ABI Prism 7000 thermocycler (Applied Biosystems). PCR protocol was performed with 45 cycles of 15 s at 95°C and 1 min at 60°C. The FGF-2 mRNA levels were normalized with mRNA GAPDH levels. Fold-change mRNA levels were calculated using the ΔΔCt method. Data were analyzed statistically by Graph Prism 5.02 (GraphPad Software, Inc.), using the means of the fold expression and a one-way ANOVA test with Newman-Keuls post test. Primers for Q-PCR were the same as for PCR.
Results
Retinal Ganglion Cell Survival
RGCs were retrograde labeled by injecting DiI bilaterally into the SC 7 days before optic nerve crush. The number of DiI+ RGCs was counted 14 days after the injury in flat-mounted retinas. The contralateral eye was used as a control for the total number of RGCs projecting to the brain. By injecting the dye before the crush, we were able to label all the RGCs; and by counting the number of labeled cells after the crush, we were quantifying only the cells that remained alive after the injury.
In the normal retina, virtually all the cells were labeled with DiI (Fig. 1A). Animals that had the optic nerve crushed and received saline injections had fewer DiI+ RGCs (Fig. 1B) compared to normal (noncrushed) eyes (Fig. 1A), indicating RGC death in the former group. Survival of RGCs after nerve crush and saline injection was 24.26 ± 1.76%, similar to previous reports (30).

Bone marrow mononuclear cell transplantation increases RGC survival. (A–C) Confocal projection images of flat-mounted retinas retrograde labeled with DiI injected into the SC 3 weeks before euthanasia. (A) Retina from the normal (noncrushed) eye showing the pattern of RGCs and axonal bundle labeling. (B) Retina from the control eye and (C) from the BMMC-treated eye 2 weeks after crush. Note the great reduction in number of RGCs and thickness of axonal bundles in (B) compared with the normal retina (A). In the treated animal (C) the number of RGCs and thickness of axonal bundles is higher than in the control (B). (D) Quantification of RGC survival 14 days after the crush (% of DiI+ RGCs relative to normal). n = 8; *p < 0.05. Scale bar: 25 μm.
To assess the effect of BMMC injections on RGC survival, we compared the number of RGCs in retinas of crushed and injected eyes with the number in noncrushed eyes. In treated animals, the number of surviving RGCs increased (Fig. 1C) compared to the retina of saline-injected animals (Fig. 1B). Quantification of DiI+ RGCs demonstrated a survival of 40.35 ± 5.46% of the RGCs in treated animals, a 1.6-fold increase in the number of RGCs compared to saline-injected animals (p < 0.05) (Fig. 1D).
Axonal Outgrowth
Axonal outgrowth was evaluated by assessing the labeling with the antibody against GAP-43, which is expressed by RGCs during axonal growth (19,29,35). We decided to use GAP-43 staining instead of anterograde labeling techniques because it has the advantage of labeling only growing axons, whereas the anterograde labeling does not distinguish growing axons from spared axons. Several reports in this field have also used GAP-43 staining to detect axonal outgrowth (19,29,39,56–58), and by using the same technique we facilitate comparison with other studies.
As expected, we observed that normal optic nerves did not express GAP-43 (data not shown). After optic nerve crush and saline injection, GAP-43 was strongly expressed in the anterior region of the nerve up to the injury site. Distal to the crush site, there was no detectable GAP-43 expression, suggesting that the growing axons were unable to pass the lesion. This pattern was observed 14 days (data not shown) and 21 days after the injury (Fig. 2A). In the BMMC-treated animals, in addition to the strong GAP-43 expression in the anterior region of the nerve, we observed GAP-43+ axons distal to the injury site and close to the optic chiasm (Fig. 2B). At higher magnification, we observed that in saline-injected animals, GAP-43 labeled axons were disorganized (Fig. 2A′). In contrast, in the BMMC-treated animals, GAP-43 labeled axons were much more organized at the crush site (Fig. 2B′); this organization persisted even in regions distal to the crush site and close to the chiasm (Fig. 2B″).

Transplantation of bone marrow mononuclear cells increases axonal outgrowth. (A, B) Photomontage of confocal projection images of optic nerve longitudinal sections labeled for GAP-43 in saline-injected (A) and BMMC-treated animals (B) 21 and 14 days after crush, respectively. (A) In saline-injected animals, GAP-43+ axons extend up to the crush site (*). Note the disorganization of the axons at the higher magnification of the crushed region (inset). (B) In BMMC-treated animals, GAP-43+ axons can be seen both in proximal and distal sites. Insets in (B) show more organized axons than in saline-injected animals. (C) Quantification of GAP-43+ axons located at 0.5, 1, and 1.5 mm from the crush site in control and treated animals. #p < 0.001; *p < 0.05. Scale bar: 125 μm (A, B), 20 μm (insets A, B).
To quantify axonal outgrowth in both conditions, we counted the number of GAP-43+ axons located 0.5, 1, and 1.5 mm distal to the crush site. The counts were made as described by Leon et al. (29). After 14 days, animals with optic nerve crush and saline injection had a median of 205.5 axons per nerve extending 0.5 mm past the crush site (n = 5), a median of 63.1 axons per nerve at 1 mm from the crush site (n = 14), and a median of 7.28 axons per nerve at 1.5 mm from the crush site (n = 6). Animals with optic nerve crush and BMMC transplantation had a median of 423.8 axons at 0.5 mm from the crush site (n = 9), a median of 174.6 axons at 1 mm from the crush site (n = 16), and a median of 77.1 axons at 1.5 mm from the crush site (n = 9). Bone marrow cell transplantation generated a twofold, significant increase (p < 0.05) in the number of axons able to grow 0.5 mm from the crush site; a 3.3-fold, significant increase (p < 0.001) in the number of axons able to grow to 1 mm from the lesion site (Fig. 2C); and a 4.35-fold, significant increase (p < 0.05) in the number of GAP-43+ axons located at 1.5 mm from the injury site.
To evaluate if this increase in axonal outgrowth was specific for BMMCs or only related to macrophage activation, we injected dead BMMCs as a control. For this, the BMMCs were heated for 5 min at 80°C and the cell viability was assessed by the live/dead assay (Invitrogen). In this assay, the membrane-permeant calcein AM is cleaved by esterases in live cells, and yields a green fluorescence; and the membrane-impermeant ethidium homodimer-1 labels nucleic acids of dead cells with a red fluorescence. Before heating, almost all the cells were alive, as seen by the green fluorescence (Fig. 3A–D). After heating, most of the cells were dead, as seen by the red fluorescence (Fig. 3E–H). In Figure 3I, we note that the injection of dead cells did not have the same effect as the injection of living cells (p < 0.01). This result suggests that the increase in axonal outgrowth is specific to BMMCs.

Transplantation of dead bone marrow mononuclear cells does not increase axonal outgrowth. (A–D) Before heating, almost all the cells were alive and were labeled with calcein AM in green. (A) Epifluorescence photomicrographs showing the calcein AM labeling (in green). (B) Because all the cells are alive, there is no ethidium labeling. (C) Bright-field image showing all the cells in the field. (D) Merge image of (A), (B), and (C). (E–H) After heating for 5 min at 80°C, almost all the cells died and incorporated the fluorescent dye ethidium homodimer-1 (in red). (E) Because all the cells died, there is no calcein AM labeling. (F) Photomicrographs showing the ethidium homodimer-1 labeling (in red). (G) Bright-field image showing all the cells in the field. (H) Merge image of (E), (F), and (G). (I) Quantification of GAP-43+ axons located at 1 mm from the crush site in control animals and animals injected with live or dead BMMCs. Scale bar: 20 μm.
Localization of Injected Bone Marrow Mononuclear Cells
BMMCs prelabeled with CellTrace were transplanted into the vitreous body after optic nerve crush. Twenty-four hours after the transplantation, we found large numbers of CellTrace+ BMMCs in the vitreous body and near the retina (Fig. 4A). Some cells were also seen in the retina layers (Fig. 4A′ and A″). Fourteen days after transplantation, most of the transplanted cells were not found in the vitreous body or in the retina, suggesting that they had a short life span or migrated out after the injection. Nevertheless, we still found a few transplanted cells in the retinal layers (Fig. 4B, C). Labeled cells were found in the ganglion cell layer (GCL), in the inner nuclear layer (INL) (Fig. 4B, arrows), in the outer nuclear layer (ONL), and near the pigmented epithelium (data not shown). Using differential interference contrast (DIC) microscopy, we noted that some of these cells were pigmented (Fig. 4C, arrowhead).

Location of transplanted bone marrow mononuclear cells. (A) Photomontage of confocal-projection images taken from longitudinal sections from the eye, 1 day after transplantation of CellTrace-labeled BMMCs (red). The vast majority of transplanted BMMCs locate in the vitreous body, but a few cells can already be observed in the ganglion cell layer (A′), the outer nuclear layer, and the photoreceptor layer (A″) of the retina. (B, C) Photomicrographs of longitudinal sections from the retina 14 days after transplantation of CellTrace-labeled BMMCs. (B) CellTrace-labeled cells (red) are found in the GCL and in the INL (arrows). (C) Differential interference contrast (DIC) image showing pigmented cells originating from the transplant (arrowheads). (D, E) Photomicrographs of longitudinal sections from the optic nerve (D) and the retina (E) 14 days after the crush, showing CellTrace+ cells derived from the transplant (red) and CD11b+ cells (green). Note that some of the transplanted cells are CD11b+ (arrows) and some are CD11b– (yellow arrows). Note also that some of the CD11b+ cells are not derived from the transplant (arrowheads). GCL, ganglion cell layer; INL, inner nuclear layer; ONL, outer nuclear layer. Scale bar: 50 μm (A), 37.5 μm (A′, A″, B, C, D), 25 μm (E).
To determine whether some of these cells were macrophages, we performed immunohistochemistry against CD11b, a marker of monocyte/macrophage/microglia. We found CD11b+ cells in the connective tissue near the optic nerve (Fig. 4D) and in the retina (Fig. 4E). Some of these cells were also labeled with CellTrace (arrows), suggesting that some of the injected cells expressed monocyte/macrophage markers. We also found CellTrace+ cells that were CD11b– (yellow arrows), demonstrating that some but not all of the transplanted cells expressed monocyte/macrophage markers. In addition, we found CD11b+ cells that were not labeled with CellTrace (arrowheads), indicating that they came from the host and suggesting a recruitment of native monocyte/macrophages to the area.
Modulation of Müller Glia Activation
Müller glia cells have a polarized morphology, which is reflected, for example, in the distribution of some proteins. Some molecules such as CD44 are restricted to the apical surface, while intermediate filaments such as GFAP are located in Müller glia endfeet (32). We analyzed GFAP expression in retinal astrocytes and Müller glia cells in BMMC-treated, saline-injected and normal animals. The expression of GFAP in normal retinas was limited to astrocytes and to Müller glia endfeet (Fig. 5A). After optic nerve crush, GFAP expression was upregulated, which resulted in labeling of the entire Müller cell body extension, suggesting activation of this cell type after injury (Fig. 5B). In BMMC-treated animals, GFAP expression decreased compared to animals that received saline injections (Fig. 5C), suggesting a modulation of Müller glia activation after treatment. Figure 5D shows the quantified data.
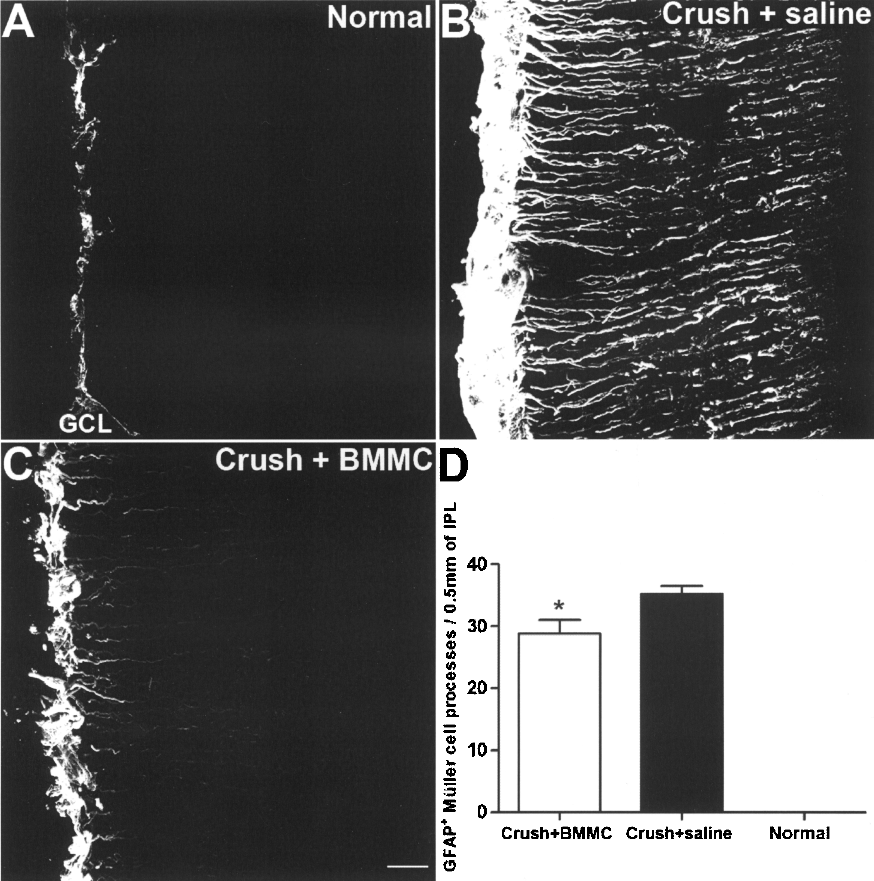
Modulation of Müller glia activation by bone marrow mononuclear cell injection. Confocal-projection images of GFAP immunostaining in the normal retina and 14 days after optic nerve crush. (A) In normal retinas, GFAP is expressed only in astrocytes and in the Müller glia cell endfeet. (B) In saline-injected animals, GFAP expression increases, suggesting intensive activation of Müller cells. (C) In the BMMC-treated animals, the level of GFAP expression is less pronounced than in the saline-injected, suggesting a decrease in Müller cell activation. GCL, ganglion cell layer. Scale bar: 20 μm.
Axonal Outgrowth to the Brain After Optic Nerve Crush and BMMC Transplantation
To determine if the axons were reaching the brain after optic nerve crush and BMMC transplantation, we performed a retrograde labeling 60 days after the lesion. By injecting DiI after the injury, we were only labeling the RCGs whose axons were able to reach the brain. Seven days after the labeling, we euthanized the animals and counted the number of DiI+ cells in the entire retina. In all the uninjured retinas, we saw DiI labeling in virtually the entire retina (Fig. 6A). After the crush, we saw very few DiI+ cells in the saline-injected animals (Fig. 6B) and a higher number of DiI+ cells in the treated animals (Fig. 6C). Some of these cells showed a complex dendritic arborization (Fig. 6C). We quantified the number of DiI+ in both conditions, and we noted a larger number of DiI+ cells in the retina of the treated animals when compared to the saline-injected ones. These results suggest that the BMMC treatment increases the number of axons that are able to reach the brain.

RGCs reach the superior colliculus in BMMC-transplanted animals. To evaluate whether the growing axons were able to reach their target, we injected DiI into the superior colliculus 60 days after the crush. Observe that, in normal eyes, virtually all RGCs are DiI+ (A). After optic nerve crush and saline injection, the number of DiI+ cells is very low (B) and this number increases after BMMC transplantation (C). Also note some dendritic branching after BMMC transplantation (C). To evaluate whether the growing axons were able to release glutamate in the superior colliculus, we analyzed the NGFI-A expression in the different conditions. In control animals, there was a high expression of NGFI-A in the superior colliculus (D). After optic nerve crush and saline injection, there were few cells expressing NGFI-A (E), and this number increased after BMMC transplantation (F). (G, H) The graphs show the quantified data for the number of DiI+ cells in the retina (G) and NGFI-A+ cells in the superior colliculus (H) *p < 0.05. Scale bar: 10 μm.
Increased Expression of NGFI-A in the Superior Colliculus in the BMMC-Treated Animals
To investigate the response to light stimulation in the different groups, we analyzed the NGFI-A expression in the superior colliculus. It has been demonstrated that after dark adaptation, NGFI-A expression is completely downregulated, indicating that this protein is not constitutively expressed in the superior colliculus. After light stimulation, NGFI-A+ cells are observed in the superficial layers, showing that NGFI-A protein expression in the superior colliculus is entirely dependent on visual stimulation (24). The NGFI-A expression is dependent on glutamate and the NMDA receptor activation (23).
To reach the peak of NGFI-A expression in the superior colliculus, 60 days after injury, the animals were subjected to a 24-h period of dark adaption followed by 90–120 min of light stimulation. We compared the contralateral superior colliculus to that ipsilateral to the lesion, and we quantified the number of NGFI-A+ cells in the superficial layers. We observed that the number of NGFI-A+ cells was higher in the BMMC-transplanted animals (Fig. 6D, F, H). These results suggest that the BMMC treatment increased the number of RGCs that were able to release glutamate and form functional synapses, but it is important to note that synapse formation was not specifically studied in these experiments.
Increased Levels of FGF-2 mRNA and Protein After Optic Nerve Crush and BMMC Transplantation
To investigate whether the effects on cell survival and axonal outgrowth generated by the BMMC transplantation could be related to known neurotrophic factors, we analyzed the mRNA levels of BDNF, CNTF, FGF-2, VEGF, and TGF-α in the three different conditions 14 days after injury. We analyzed three different animals in each condition, and we found no significant difference in the levels of BDNF, CNTF, VEGF, and TGF-α mRNAs (data not shown). These results are in conflict with those of Müller and coworkers (39), who found a slight increase in the levels of CNTF mRNA after optic nerve crush. However, the difference in the time points analyzed (7 vs. 14 days after injury) might account for these inconsistent results.
Interestingly, we saw a small increase in levels of FGF-2 mRNA after optic nerve crush and saline injection, and a larger increase in levels of FGF-2 mRNA after optic nerve crush and BMMCs transplantation. This increase was first identified by semiquantitative PCR (Fig. 7A) and confirmed by quantitative real-time PCR (Fig. 7B). The levels of FGF-2 mRNA in the treated animals (n = 5) increased 12-fold compared to control (n = 5), and 2.5-fold compared to untreated animals (n = 4). We also analyzed the mRNA levels of the same neurotrophic factors in the BMMCs before the transplantation, and we observed that they contained mRNA for all the neurotrophic factors analyzed (Fig. 7C). In addition to the mRNA levels, we analyzed the protein expression of FGF-2. We found that FGF-2 was almost absent in normal animals (Fig. 7D), and its expression increased after optic nerve crush and saline injection (Fig. 7E-F). After BMMC transplantation, the FGF-2 expression was even higher (Fig. 7G, H), especially in the central part of the retina (Fig. 7G).
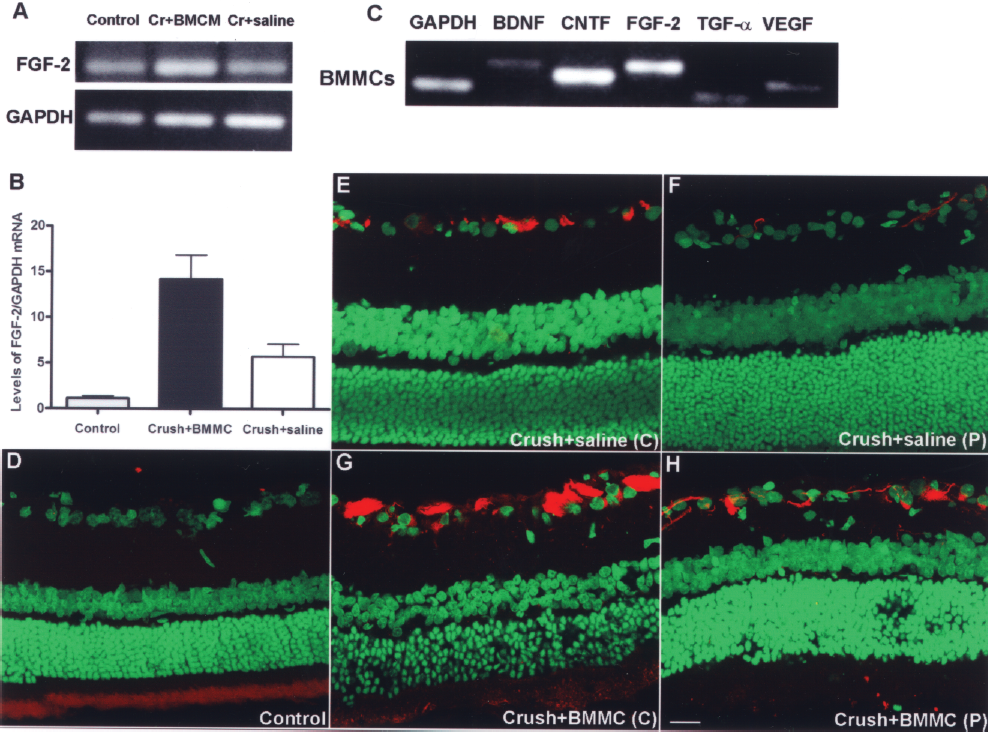
Analysis of FGF2 mRNA and protein levels. (A, B) FGF-2 mRNA levels in control (n = 5), optic nerve crush following BMMC transplantation (n = 5), and optic nerve crush following saline injection (n = 4) animals, detected by semiquantitative PCR (A) and quantitative PCR (B). The graph shows the mean and SEM. *p < 0.05. (C) BMMC levels of BDNF, CNTF, FGF-2, TGF-α, and VEGF mRNAs. (D, H). Confocal photomicrographs of FGF-2 immunostaining in the normal retina and 14 days after optic nerve crush. (D) In normal retinas, the FGF-2 expression is almost absent. (E, F) In saline-injected animals, the FGF-2 expression increases, especially in the central retina (E) when compared to normal animals. (G, H) In the BMMC-treated animals, the level of FGF-2 expression is even more pronounced than in the saline-treated group, and this difference is more evident in the central retina (H). Scale bar: 20 μm.
Discussion
Intravitreous transplant of BMMCs increased RGC survival and axonal outgrowth in our model of optic nerve crush. Some of the transplanted BMMCs expressed macrophage/microglia markers, and the levels of FGF-2 mRNA increased in the treated group 14 days after the crush. We also provided evidence that after treatment, the regenerated axons could grow to the brain.
Recent studies have shown that bone marrow cells release several factors under controlled conditions, and that this expression can be changed by injury. Human mesenchymal stem cells (hMSCs), for example, express BDNF and NGF, and interrogation of their transcriptome revealed that hMSCs also express transcripts encoding several neurite-inducing factors in addition to neural cell adhesion and axon guidance molecules (15). Also, murine bone marrow cells increase production of VEGF, HGF, NGF, and BDNF when cultured in the presence of ischemic cerebral tissue (13). In our study, we also demonstrated that rat bone marrow cells have mRNAs for BDNF, FGF-2, CNTF, VEGF, and TGF-α even without stimulation.
Based on these observations, we postulate that, in our model, the injected BMMCs could behave as biological minipumps, releasing trophic factors in response to optic nerve crush, and that these factors may decrease ganglion cell death and increase axonal outgrowth. Similar results for RGC survival were obtained with the transplantation of Schwann cells or fibroblasts into the vitreous body both before and after optic nerve injury (33,37) and with the transplantation of olfactory ensheathing cells into the ocular stumps of transected optic nerve (55). This suggests that different cell types seem to be able to delay RGC death, probably due to the release of trophic factors. Nevertheless, Schwann cells, fibroblasts, and olfactory ensheathing cells have not been reported to increase RGC axonal outgrowth. Charalambous et al. (10) demonstrated that chick neural tube-derived stem cells transplanted to the rat optic nerve after transection release the neurotrophic factors CNTF and BDNF and increase axon growth, but the treatment with xenotransplantation has limited clinical application.
In our study, we observed increased levels of FGF-2 mRNA in the treated animals. This suggests that the BMMCs could release FGF-2, or could stimulate the retinal cells to release this factor. FGF-2 gene delivery stimulates RGC survival and axonal outgrowth (44); therefore, our results could be, in part, mediated by FGF-2. Because the axonal outgrowth demonstrated in the present study is much greater than that reported by Sapieha et al. (44), we suggest that FGF-2 may be one of the factors related to the demonstrated effect, but not the only one. Further studies are necessary to identify other factors that might play an important role in the regeneration stimulated by BMMC transplantation.
We observed that most of the transplanted cells did not remain in the tissue for long periods. This accords with other reports that showed limited persistence of bone marrow cells in tissues, and with the hypothesis that BMMCs could exert their therapeutic effects through a “touch-and-go” mechanism, which represents a migration to the damaged area followed by a rapid clearance after the release of neurotrophins and other molecules [see (49) for review].
In addition to the release of neurotrophic factors, BMMCs could also stimulate recruitment and/or differentiation into macrophages. Leon et al. (29) and Yin et al. (57) reported that macrophage activation promotes RGCs survival and axonal outgrowth after optic nerve crush. One of the factors produced by macrophages is oncomodulin, a calcium-binding protein that binds to RGCs. It has been suggested that oncomodulin stimulates extensive axonal outgrowth (56,58), although in this respect conflicting results have been reported (25). Therefore, one hypothesis to explain the effects demonstrated in the present study could be the recruitment of macrophages induced by the transplant and the consequent release of oncomodulin and other macrophage factors. Furthermore, the mononuclear fraction of bone marrow cells is rich in monocytes, which could also differentiate in macrophages after transplantation. This hypothesis is corroborated by our finding of CD11b+ cells derived from the transplant, suggesting that monocytes/macrophages from the injected cells were present in the host tissue.
We also analyzed GFAP expression in the retina as a measure of Müller cell activation. In normal conditions, GFAP expression in the retina is limited to Müller's glia endfeet and to astrocytes located in the nerve fiber layer. After retinal stress, however, Müller cells are activated, showing cellular hypertrophy, proliferation, and an increase in GFAP expression (4,5). The upregulation of GFAP has been described in several models of injury, such as mechanical injury (4), photoreceptor degeneration (16,17), retina detachment (31), and experimental glaucoma (52). Increased GFAP expression in Müller cells was also described after optic nerve transection (26) and optic nerve crush (12).
In our model, we confirmed that GFAP expression was increased after optic nerve crush and saline injection. After bone marrow cell transplantation, however, GFAP expression decreased to levels similar to normal (noninjured) animals. This was unexpected, since activation of Müller glia during regenerative processes has been reported (29). We suggest that treatment with BMMCs decreases retinal stress and consequently decreases the stimulus for Müller glia activation and GFAP overexpression.
Finally, we provided evidence that growing axons were able to reach the brain. When we first validated the optic nerve crush model, we observed that after the lesion, all the axons were injured. Because of that, we strongly suggest that the BMMC-treated RGCs that were retrograde labeled 60 days after the crush were in fact cells whose axons were growing all the way back to the brain. Nevertheless, we do not provide evidence that the regeneration is time dependent, or any histological data showing that the axons were growing along the entire pathway; therefore, we need additional evidence to confirm this statement.
Similarly, we demonstrated increased NGFI-A expression in the superior colliculus after BMMC treatment. NGFI-A expression is directly dependent on light stimulation, glutamate release, and NMDA receptor activation in the target cells (23). The increase in the number of cells expressing NGFI-A in the superior colliculus is evidence of improvement in the number of functional synapses between RGCs and SC cells. Nevertheless, further experiments involving, for instance, recording of visually evoked potentials in the visual cortex are required to evaluate the extent of this putative functional regeneration.
Cell therapy with bone marrow cells in the visual system has been described previously, with promising results. Castanheira and coworkers demonstrated that 8 weeks after injection of bone marrow-derived mesenchymal stem cells in the vitreous cavity following laser-induced lesion in the retina, cells remain viable in the vitreous cavity initiating a process of homing and migration towards the injury site (7). Transplantation of bone marrow-derived mesenchymal stem cells also rescued photoreceptors in the dystrophic retina of rhodopsin knockout mice (1). In addition, bone marrow-derived stem cells stabilized and rescued retinal blood vessels and generated a neurotrophic rescue effect in a mouse model of retinal degeneration (40). Furthermore, bone marrow cell transplantation has been described in two experimental glaucoma models. Yu and coworkers (59) demonstrated that bone marrow cells expressed CNTF, GDNF, BDNF, and FGF-2 after transplantation, and that treated eyes showed a higher density of surviving RGCs. Johnson and coworkers (27), using a different glaucoma model, showed a decrease in elevated pressure-induced optic nerve degeneration after intravitreal transplantation of mesenchymal cells. Our group has also demonstrated promising results from cell therapy with bone marrow cells, after peripheral nerve injury (43).
In conclusion, we suggest that cell therapy with BMMCs seems to have a role in neuroprotection and regeneration in animal models of retina and/or optic nerve injury. These results could be mediated by FGF-2, but the mechanism(s) of action involved in this effect remain to be investigated. Although cell therapy with mesenchymal bone marrow cells has been described previously in a model of optic nerve damage (27,59), as far as we know, this is the first report of RGC axonal outgrowth after BMMC treatment. The neuroprotection and axon outgrowth data shown in the present study are similar to previous findings after lens injury (20,21,29), but the clinical relevance of our model is an important aspect.
Footnotes
Acknowledgments
This study was supported by grants from the Conselho Nacional de Desenvolvimento Científico e Tecnológico, Coordenação de Aperfeiçoamento de Pessoal de Nível Superior, Fundação Carlos Chagas Filho de Amparo à Pesquisa do Estado do Rio de Janeiro (FAPERJ), and the Ministry of Health. E.A. is supported by the Conselho Nacional de Desenvolvimento Científico e Tecnológico, Fundação Carlos Chagas Filho de Amparo à Pesquisa do Estado do Rio de Janeiro (FAPERJ), and Financiadora de Estudos e Projetos (FINEP). We thank Ricardo Azevedo-Pereira, Jason Potas, Isis Nascimento, Felipe Marins, and Suelen Serio for assistance. We thank Larry I. Benowitz for comments on the manuscript. We thank Janet W. Reid, Ph.D., JWR Associates, Virginia, USA for editing the manuscript.