
Abstract
In this study, the therapeutic effect of intra-articularly injected autologous mesenchymal stromal cells (MSCs) was evaluated in an ovine osteoarthritis (OA) model using consecutive magnetic resonance imaging (MRI), radiography, and macroscopic and histologic postmortem examination. In 12 sheep, OA was induced by bilateral, lateral meniscectomy. After 6 weeks, 20 × 106 bone marrow-derived MSCs (50% MSCs were superparamagnetic iron oxide particle labeled) were injected intra-articularly into one knee joint. The contralateral knee served as negative control. MR images were acquired before OA induction, immediately before and after MSC injection, and 1, 4, 8, and 12 weeks thereafter using a 0.5T unit and a T2* gradient echo sequence. Radiographs were obtained before OA induction, at MSC injection, and 12 weeks thereafter. The MRI scoring system included articular cartilage, bone, joint capsule, and synovial fluid evaluation. The radiographic scoring system included the joint space and bone. Postmortem evaluation entailed macroscopic and histologic assessment. Longitudinal MRI revealed a significant deceleration of OA progression in MSC-treated joints. However, at the conclusion of the study, there was no significant difference in the degree of OA detected by MRI, radiography, and postmortem evaluation between the treatment and control group. The degree of OA on MRI varied among the 12 animals at the time of injection, but there was no difference between the left and right limb. In conclusion, intra-articular MSCs decreased OA progression. However, no significant treatment effects were seen at the conclusion of the study at 12 weeks. This somewhat contradicts previously published results. Nevertheless, the choice of OA model, outcome measures, or lack of additional medication might explain the differences. Our results indicate that OA might benefit from intra-articular MSC injection, but further studies are needed to refine patient selection and injection parameters for a more substantially improved outcome.
Keywords
Introduction
Osteoarthritis (OA), the most common form of arthritis, is morphologically manifested by softening, fibrillation, ulceration, and ultimately complete loss of articular cartilage, sclerosis, and eburnation of the subchondral bone and osteophyte and subchondral cyst formation (53). The condition is well recognized in humans and animals (53,64). Despite advances in understanding the pathophysiology and establishing an early diagnosis of the disease, to date no reliable and definitive therapy has been found. Various disease or symptom-modifying treatment approaches are the focus of ongoing investigations, and among the most current and most promising are cell-based therapies (6). Cells can be used for tissue engineering or injected as suspension into the joint cavity. In vivo experimental animal studies (1,19,42–44,57), as well as human (14,16,20,47,58) and animal clinical trials (7,8,18,28), have suggested that intra-articular administration of mesenchymal stromal cells (MSCs) into diseased joints may augment healing of joint tissue. In a recent follow-up study on clinical cases of athletic horses with arthroscopically confirmed meniscal damage, a significantly improved outcome compared to the historic control group was reported (21). Similar exciting results were presented very recently in the first randomized, double-blinded, controlled study of human patients after therapeutic subtotal meniscectomy (63). In this study, significantly increased meniscal volume and long-term reduced pain were detected after intra-articular MSC injection compared to the control group.
Mesenchymal stromal cells are most commonly isolated from bone marrow (BM) and adipose tissue. They show capacity for self-renewal and differentiation. A positive immunomodulatory effect within the host tissue has been reported (13). However, the exact mechanisms of action and fate of the applied cells in the host tissue are still not completely understood.
The presented data are part of a larger project evaluating the effect and fate of autologous MSCs in osteoarthritic knee joints in an experimental ovine model. For that purpose, MSCs labeled with superparamagnetic iron oxide particles (SPIO) as well as unlabeled cells were injected 6 weeks after experimental OA induction and the animals consecutively evaluated over a period of 12 weeks using magnetic resonance imaging (MRI) and radiography.
The objective of this study was the longitudinal evaluation of knee joints after OA induction and the influence of locally administered MSCs. Data regarding the fate of the MSCs, which were evaluated by labeling part of the injected cells with SPIO, were previously presented in part (17) and are presented in our companion article appearing in this issue. Suitability of the elected SPIO product was previously demonstrated (32).
Our hypotheses for the current study were as follows: intra-articular MSC administration 6 weeks after OA induction positively influences (1) progression of OA evaluated by MRI and (2) stage of disease 12 weeks after OA induction evaluated by either MRI, radiography, or postmortem evaluation.
Materials and Methods
Induction of OA and Animal Management
All procedures were approved by the State Animal Care Committee (TVV 11/09; Landesdirektion Leipzig, Free State of Saxony, Germany). Twelve purebred German Blackhead mutton ewes from a local breeder (Agrargenossenschaft Sonnewalde, Sonnewalde, Germany) aged 24 to 30 months with an average body weight of 75.3 kg were used. Physical examination, including orthopedic evaluation, a complete blood count, and radiographic examination of both knee joints ensured normal health status and orthopedic soundness. Figure 1 illustrates the study design.

Time bar displaying the study design (MRI, magnetic resonance imaging; OA, osteoarthritis; BM, bone marrow; MSC, mesenchymal stromal cell).
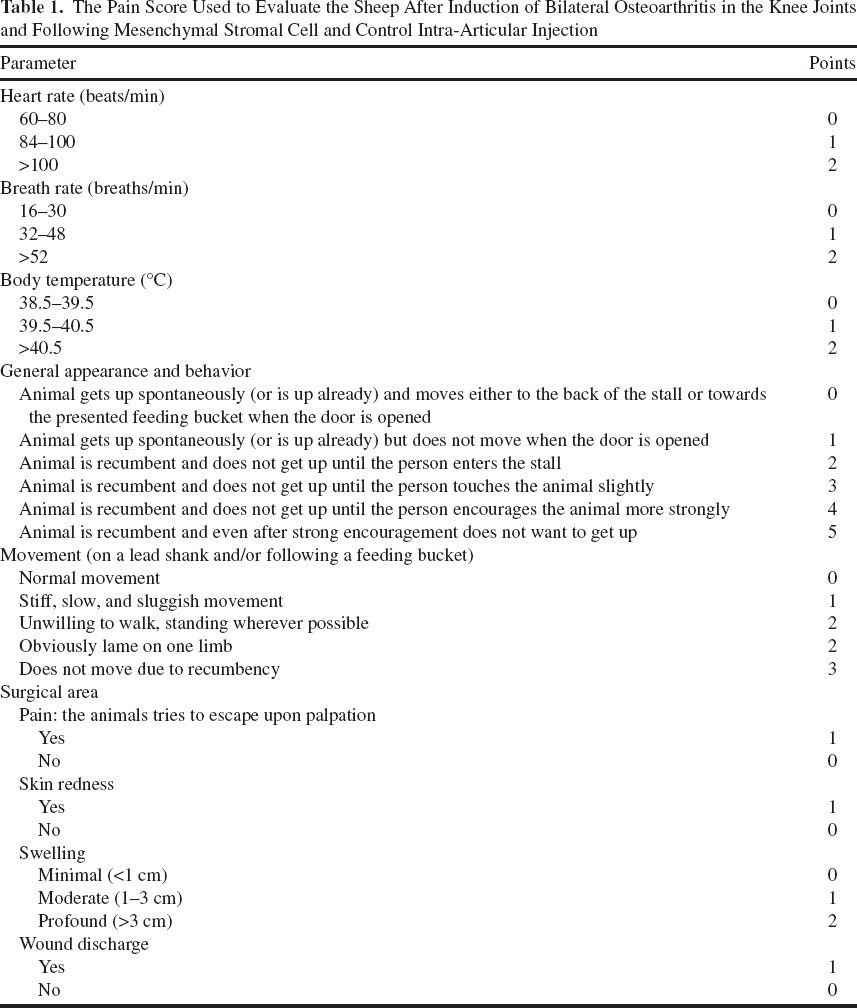
Osteoarthritis was induced by bilateral, lateral meniscectomy adapting a previously published technique (26,38). For that, animals received 2.2 mg/kg flunixin IV (cp-pharma, Burgdorf, Germany) and 2 mg/kg ceftiofur DM (Pfizer, Berlin, Germany); they were placed routinely under general anesthesia in lateral recumbency, and the surgical field was aseptically prepared. A 4-cm-long vertical skin incision was made cranial to the lateral collateral ligament (CL) of the femorotibial joint (FTJ). The FTJ was entered cranially, and the cranial and lateral attachments of the lateral meniscus were sharply transected, taking care not to damage the articular cartilage. Afterward, the joint was entered caudally to the CL using the same skin incision. Hemostasis was achieved with electrocautery. The cranially freed meniscus was grasped with rat-toothed, curved mosquito hemostatic forceps (WDT, Garbsen, Germany) and pushed axially of the popliteus tendon and the CL into the caudal FTJ pouch, dorsally to the popliteus muscle belly. The CL and the tendon of the popliteus tendon were left intact. It was always attempted to remove the meniscus completely, for example, the caudal transection was within the menisco-femoral ligament or at least within the caudal-most aspect of the caudal mensical horn. Transection was often blind with the meniscus under tension using a blunt-tipped, curved tenotom (WDT), again taking care to protect the articular cartilage. The fascia and skin were closed routinely and the wound covered with adhesive dressing. The contralateral limb was operated in a similar fashion. All procedures were performed by the same surgeon (U.D.). Subsequently, sheep were placed in sternal recumbency, and bone marrow (BM) was aspirated. Briefly, after aseptical preparation, the skin at the center of each iliac crest was incised at a length of 0.7 mm using a scalpel (No. 15; B. Braun, Tuttlingen, Germany). A sterile BM aspiration needle (11 gauge; Angiotech, Gainesville, FL, USA) was inserted vertically and pushed with gentle to-and-fro motion into the medullary space. The obturator was removed, and 12,500 IU heparin (B. Braun, Melsungen, Germany) was injected into the medullary space. Subsequently, 20 ml of BM was aspirated into a heparinized (10,000 IU heparin) syringe. The procedure was repeated on the other side, resulting in a total amount of 40 ml harvested BM. Finally, the skin incisions were covered with iodine-PVP spray (Albrecht, Aulendorf, Germany). After surgery, sheep were administered 2.2 mg/kg flunixin orally and 2 mg/kg ceftiofur IM, both every 24 h for 3 days. A semiquantitative pain score (Table 1) was applied daily during the first 7 days after surgery and at least weekly thereafter. Additional doses of flunixin were administered if the score value was >8. During the 7 days after surgery, animals were confined to stall rest (3 × 3 m). After that, they were hand walked daily for 7 min for 3 weeks. At the beginning of the fourth week after surgery, sheep were turned out daily to grass on a nearby small pasture area.
The Pain Score Used to Evaluate the Sheep After Induction of Bilateral Osteoarthritis in the Knee Joints and Following Mesenchymal Stromal Cell and Control Intra-Articular Injection
MSC Isolation and Sample Preparation for Intra-Articular Administration
Mononuclear cells (MNCs) were isolated from the BM by density gradient centrifugation within 8 h after sampling. BM was diluted 1:1 with phosphate-buffered saline (PBS; PAA, Pasching, Austria). BM aspirate, 22.5 ml, was placed on 15 ml Ficoll PREMIUM (GE Healthcare, Uppsala, Sweden) and centrifuged (20 min, 1,000 x g, 20°C). The buffy coat containing MNC was collected and washed twice with PBS. Cells were plated at a density of 1.5 × 10⁵ cells/cm2 into T175 tissue culture flasks (Greiner Bio-One, Frickenhausen, Germany) in Dulbecco's modified Eagle medium (PAA) supplemented with 10% fetal bovine serum (FBS; Sigma-Aldrich, Steinheim, Germany), 1% penicillin/streptomycin (PAA), and 8.9 μg/ml ascorbic acid (Sigma-Aldrich). Cultures were kept at 37°C in humidified atmosphere at 5% CO2. After 24 h, cells were washed with PBS, and culture medium was added again. Subsequently, culture medium was exchanged twice a week. MSCs were passaged at subconfluency. All cells of p1 were cryopreserved to prevent cell aging and senescence during the 6 weeks between BM harvest and MSC injection (i.e., OA induction and OA treatment). For cryopreservation, MSCs were harvested into 50-ml conical tubes (BD Biosciences, Erembodegem, Belgium) and centrifuged (5 min, 400 x g, 4°C). The supernatant was discarded, and cells were resuspended in freezing medium consisting of FBS and 10% dimethyl sulfoxide (Sigma-Aldrich). The suspension was transferred to cryotubes (Greiner Bio-One), which were placed in a freezing box (Nalge Nunc, Rochester, NY, USA) filled with isopropanol (Roth, Karlsruhe, Germany), allowing for a stepwise decrease in temperature of 1°C/min to −80°C for a maximal time frame of 3 weeks. Ten days prior to injection, MSCs were thawed by placing the cryotube in a 37°C water bath. MSCs were then transferred to a 50-ml conical tube and washed twice with PBS. After thawing, MSCs were further expanded until p3. Immediately before injection, approximately 10 × 106 MSCs (within two T175 tissue culture flasks) were labeled with Molday ION Rhodamine B (“Molday””; BioPAL, Worcester, MA, USA). Molday stock solution was added to the culture medium at a concentration of 50 μl/ml, and MSCs were incubated for 10 h under standard culture conditions. After labeling, medium was removed, and cells were washed three times with PBS; then 10 × 106 labeled cells were harvested and then mixed with 10 × 106 unlabeled cells that had been cultured with normal culture medium without Molday. The mixture of both labeled and unlabeled cells was resuspended in 2 ml PBS and transferred to a 5-ml syringe (DE Healthcare Products, Gillingham, UK) for implantation. The addition of unlabeled cells was necessary because it has been shown in earlier studies that labeling with SPIO led to a decrease in MSC's chondrogenic potential (32).
For the contralateral control joint injection, four different setups were used; however, none of them contained viable MSCs. Specifically, these were a) PBS (n=4), b) pure liquid SPIO in PBS (n=2), c) 10 × 106 nonviable SPIO-labeled MSCs (n=3), or d) no injection (n=3). The pure Molday sample was prepared by adding 25.5 μl Molday stock solution to 2 ml PBS and transferring it to a 5-ml syringe. The nonviable MSC sample was prepared as follows: 10 × 106 labeled MSCs were harvested and transferred to a 50-ml conical tube. Cells were centrifuged (5 min, 800 x g, 20°C), and supernatant was discarded. To devitalize the cells, they were incubated in 3 ml of 70% ethanol for 3 min at room temperature. Lack of cell viability was proven by trypan blue stain (Sigma-Aldrich). Subsequently, cells were washed three times with 40 ml PBS, resuspended in 2 ml PBS, and transferred to a 5-ml syringe.
Intra-Articular Administration and Synovial Fluid Evaluation
Time between sample preparation in the laboratory and joint injection did not exceed 30 min. Samples were kept at 4°C during that time. The treatment knee was drawn by lots; however, randomization was limited to ensure six left- and six right-sided treatment injections. The animals received a single dose 2.2 mg/kg flunixin IV and 12 mg/kg penicillin/15.5 mg/kg streptomycin IM (Albrecht). Under aseptic conditions and with the animal under general anesthesia, the caudal pouch of the lateral FTJ was entered using a 20-gauge needle (Terumo Europe, Leuven, Belgium). This site was chosen based on our own cadaver studies and the MR images obtained immediately preceding the injection (time point 0). Correct intra-articular needle position was always ensured by synovial fluid aspiration. A maximal amount of synovial fluid was aspirated. If aspiration was not possible, the needle was repositioned under X-ray control. If still unsuccessful, the femoropatellar joint (FPJ) was entered dorsally and injected instead, again ensuring positive synovial aspiration. All suspensions to be applied were gently agitated within the syringe immediately before injection.
Synovial fluid was placed in tubes containing ethylenediaminetretraacetic acid (Sarstedt, Nümbrecht, Germany), and routine analysis including total nucleated cell count (TNC; Advia 120; Siemens Healthcare, Dreieich, Germany), total protein (TP; Hitachi 912; Roche Diagnostics, Mannheim, Germany), and differential cell count, particularly the percentage of polymorphonuclear cells (PMN; microscopic examination and manual counting) were performed immediately. Synovial fluid was collected and evaluated again at the conclusion of the study 12 weeks later.
MR Image Acquisition and Evaluation
MR images of both knees were obtained before OA induction (time point −6), immediately before and after intra-articular injection (twice at time point 0), and subsequently 1, 4, 8, and 12 weeks thereafter. The protocol to obtain MR images was identical for each of the seven sessions per sheep. Animals were placed under general anesthesia in lateral recumbency into the gantry with the evaluated leg uppermost. The imaged leg was extended caudally and slightly rotated outward, being held in position with sandbags. The angle at the knee joint was approximately 90° to 110°. A 0.5T MRI unit (Gyroscan NT 0.5T; Philips HealthCare, Hamburg, Germany) and a flexible surface coil (Philips C3) were used. A T2*FFE sequence was used (field of view 160 mm, matrix scanned 256 × 256, matrix reconstructed 512 × 512, TE 41 ms, TR 27 ms, flip angle 25°, 1 mm slice width, no slice gap). Three orientations (i.e., sagittal, dorsal, transverse) and 40 to 90 slices were obtained per scan. The orientations were planned in pilot images by the same MR technician. The sagittal image was planned in a transverse pilot view so that the distal condyle of the femur was split in half. The dorsal orientation was planned in a sagittal pilot view so that it was parallel to the long axis of the tibia. Finally, the transverse orientation was planned in a dorsal pilot view so that it was parallel to the tibial plateau and 90° to the cranial aspect of the long axis of the tibia.
All images were stored and evaluated en bloc in a blinded and randomized fashion by one of the authors (U.D.). Digital image software (eFilm 2.1.0.; Merge Healthcare, Milwaukee, WI, USA) on dual monitors (each 32 bit, 1,680 × 1,050 pixels; Fujitsu Technology Solutions, München, Germany) was used.
The scoring system was newly developed based on available publications (31,39,45,46,50) and our own observations gained during image acquisition (Table 2). Within the lateral FTJ, the articular cartilage of the femoral condyle (FC) and the tibial condyle (TC) were evaluated for completeness and thickness. The underlying bone was evaluated for its shape, evidence of sclerosis, fluid accumulation, or new bone formation (i.e., osteophyte, entesiophyte). To estimate the extent of the lesions in sagittal and dorsal views of the FC, the semicircular shape of the condyle was divided into three equally shaped pie slice-shaped zones (cranial, central, caudal and medial, central, lateral, respectively). The synovial lining (evaluated for thickness) and synovial fluid (evaluated for amount and for adhesion formation) were evaluated within the lateral and also within the medial FTJ and FPJ. All images in all three scan directions were used for the assessment, and the worst score was given for each individual criterion if an abnormality was seen on any of the views. Special attention was paid to the craniolateral, lateral, and caudolateral aspect of the lateral FTJ capsule (e.g., the presence of soft tissue protruding into the joint space). Menisci and ligaments were not included in the evaluation. For the final score value per knee, all 21 individual scores were added together. Consequently, a high final score value indicated a greater degree of OA per knee.
Magnetic Resonance Image Evaluation Criteria for the Lateral Femorotibial Joint (FTJ), Medial FTJ, and Femoropatellar Joint (FPJ)

FC, femoral condyle; TC, tibial condyle; NBF, new bone formation.
Radiographic Image Acquisition and Evaluation
Radiographs of both knees were obtained before OA induction (time point −6), before MSC injection (time point 0), and again at the conclusion of the study 12 weeks later. Posterior–anterior (PA) views were made with the animal standing, and mediolateral (ML) views were obtained in lateral recumbency using a digital imaging system (Fuji film FCR 5000; Fuji Photo Film, Tokyo, Japan) and a Fuji film IP cassette type C, Pb 18 × 24 cm. The following settings were applied: 55 kV/40 mAs for the PA views and 52 kV/36 mAs for the ML views; the film focus distance was kept at 100 cm.
Image evaluation setup was identical to the MR image evaluation. However, images after OA induction (i.e., time point 0 and 12) were evaluated in direct comparison to the joint's baseline radiograph (i.e., time point −6).
The scoring system was developed based on available publications (2,27) and our own observations gained during image acquisition (Table 3). Again, in each criterion the worst finding defined the score given. The scoring system included joint space of the lateral FTJ (shape) and the FC and TC bone (new bone formation, shape, sclerosis, lysis). For the final score value per joint, all 12 parameters were added up. Consequently, a high final score value indicates a greater degree of OA.
Radiographic Image Evaluation Criteria for the Lateral Femorotibial Joint (FTJ) and Medial FTJ

NBF, new bone formation; TC, tibial condyle; FC, femoral condyle; PA, posterior–anterior view; ML, mediolateral view.
Macroscopic Postmortem Evaluation
All sheep were sacrificed 12 weeks after intra-articular administration, when knee joints were opened and synovial fluid was collected aseptically. Joint structures were grossly inspected and photographed. Assessment was performed by one person (H.J.). Within the lateral FTJ, formation of neomeniscus (i.e., soft tissue replacing the removed meniscus) was evaluated as grade 0=meniscoid tissue, grade 1 = undefined tissue with soft, jelly-like appearance, and grade 2=no tissue present. Cartilage damage was evaluated on the lateral and medial FC and TC as previously described (37): score 0=normal cartilage, score 1 = surface roughening, score 2=fibrillation and fissures, score 3 = small erosions down to subchondral bone (<5 mm diameter), score 4=larger erosions down to subchondral bone (>5 mm diameter). Scores for all four joint structures were added up to give a lesion score (0-16). Development of osteophytes was evaluated as previously described (37): score 0=no osteophyte development, score 1 = mild osteophyte development (<2 mm outgrowth or <20% of joint margin), score 2=moderate osteophyte development (2-4 mm outgrowth or 20-50% of joint margin), score 3 = large osteophyte development (>4 mm outgrowth or >50% of joint margin). Scores for all four joint structures were added up to give an osteophyte score (0-12). Total macroscopic score equals the sum of cartilage damage and osteophyte formation.
Histologic Evaluation
Osteochondral samples were obtained from the lateral and medial FC and TC. They were fixed in 4% paraformaldehyde (Roth) for a period of 72 h and decalcified in 20% Decal (Serva Electrophoresis, Heidelberg, Germany) in a 50-ml conical tube on a rotating shaker for 6 weeks. The decalcifying solution was changed every 2-3 days. Once decalcification was complete, samples were rinsed in distilled water to achieve neutral pH and dehydrated in graded alcohols. Following previous recommendations (51), the sample was transected where the plane of the block dissected the cartilage lesion to the greatest extent. The block was embedded in paraffin (Vogel, Gießen, Germany) with the lesion closest to the surface that was to be sectioned. Samples were sectioned at a thickness of 5 μm and subsequently stained with hematoxylin and eosin (H&E; Sigma-Aldrich) for general cell and tissue morphology and with Safranin O (Sigma-Aldrich) for OA histopathology assessment.
Samples were scored by one person (H.J.) using the OARSI Osteoarthritis Cartilage Histopathology Assessment System (51).
Statistical Analysis
Data were tested for normal distribution using the Shapiro–Wilk test. The control group always encompassed all four different approaches, and no separate comparisons were made between the treatment group and the individual four control setups due to the small number of cases. Group comparisons were performed using the t-test for paired samples (normally distributed data) and Wilcoxon test (non-normally distributed data). Significance was set at p < 0.05. Bonferroni correction was used to adjust the p value. Data were expressed as mean (±standard deviation) or median (interquartile range, IQR) for normally and non-normally distributed data, respectively. Regression analysis was used to determine the relationship between the macroscopic evaluation and MRI at 12 weeks. Statistical analysis was performed with IBM SPSS Statistics (version 22; IBM Corp., Armonk, NY, USA).
Results
Induction of OA and Animal Management
Using the described technique, removal of approximately 90-100% of the lateral meniscus was possible. Transposition of the meniscus axial to the tendon and popliteus muscle and the lateral CL was challenging in some animals. Wound healing was undisturbed in the majority of the limbs (22/24); seroma developed in one limb of two animals. One animal developed respiratory symptoms in the second week after surgery requiring three additional doses of ceftiofur. One animal received two additional doses of flunixin during the fourth week after surgery.
Intra-Articular Administration and Synovial Fluid Evaluation
The lateral FTJ was successfully injected in 19 joints. Five times, including one bilateral case, the FPJ had to be injected instead. Synovial fluid preceding intra-articular injection had a median of 0.4 (IQR 1.1) x 109 cells/L TNC, a TP of 35.4 (IQR 21.0) g/L, and 12% (IQR 60%) PMN cells. There was no significant difference between the right and left joint. In one joint TNC was above 5 × 10⁹ cells/L, in four joints TP values were above 50 g/L (including one bilateral case), and in three joints PMN cells were >75%, again with one bilateral case. None had more than two increased parameters per joint. Twelve weeks after MSC injection, there was no significant difference between the treatment and control group in any of the three parameters. The median values in the treatment versus control group were as follows: for TNC 0.3 (IQR 0.6) x 109 cells/L versus 0.1 (IQR 0.9) x 109 cells/L, for TP 34.0 (IQR 15.6) g/L versus 38.0 (IQR 25.8) g/L, and for PMN cells 5.0% (IQR 15.8%) versus 13.0% (IQR 41.3%). In three joints TP values were above 50 g/L.
MR Image Evaluation
Based on the overall MR image evaluation score, no significant difference was detected between the treatment and control joint at any time point during and at the end of the 12-week evaluation period; at week 12, the score for treatment knees was 9.5 (IQR 9.25) and for control knees 11.0 (IQR 6.5). Excluding lateral FTJ cartilage parameters and all medial FTJ and FPJ data from the overall score, no difference was detected either. There was also no statistical difference between the treatment and control group in any of the individual scores of the final MRI overall score. Selected values are presented in Table 4.
Selected Scores [Median (Interquartile Range)] of Magnetic Resonance Image Knee Joint Evaluation Following Intra-Articular Mesenchymal Stromal Cell (M) and Control (C) Injection Throughout a 12-Week Evaluation Period

Note: “Cartilage complete” combined values of the lateral femoral condyle (FC) and the lateral tibial condyle (TC); the “amount synovial fluid” combines all three knee joint compartments.
In the treatment and the control knee joints, the OA score decreased over the 12-week observation period, but only in the treated knee were the differences between time points 12 and 0 (15.5, IQR 10.0, p = 0.003) as well as between time points 12 and 1 (14.0, IQR 10.75, p = 0.002) significant (Fig. 2). Representative parasagittal MR images throughout the evaluation period of animal #9, with generally mild to moderate OA changes, are presented in Figure 3.
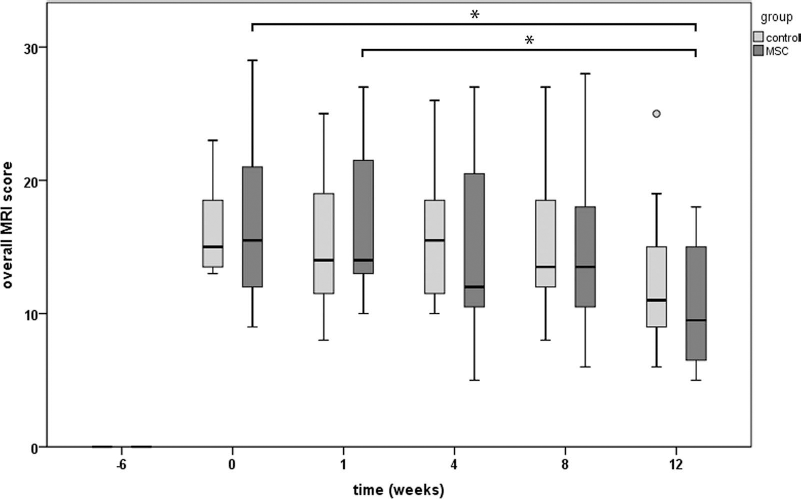
Overall MRI scores throughout the study. Median, interquartile range (box), range (whisker), and outlier (°) of the overall MRI scores throughout the study; note the score decrease in the MSC-treated and control group. *Significant difference between scores at week 12, week 0, and week 1, respectively (p < 0.005).
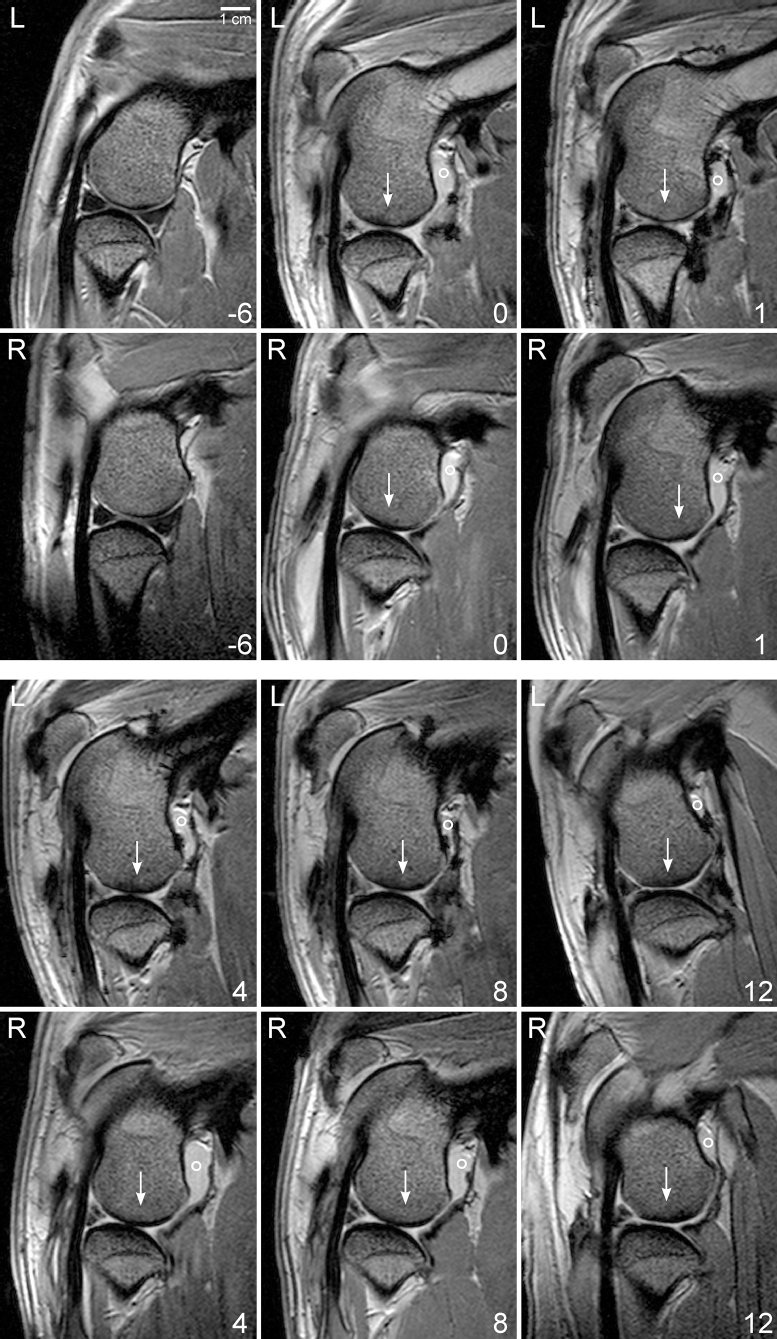
Representative magnetic resonance images of the knee joints throughout the study. Parasagittal T2*FFE magnetic resonance images at the level of the extensor tendon dorsolateral to the femorotibial joint (FTJ) from the left (L) and right (R) lateral FTJ of animal #9 at time point −6 (native stage), time point 0 (before intra-articular injection), and time points 4, 8, and 12 (conclusion of the study). In this animal, the left side was treated with mesenchymal stromal cells, the right side received phosphate-buffered saline control injection. ° Joint fluid within the caudal pouch decreasing with time; → sclerosis within the femoral condyle.
In general, osteoarthritic changes at time point 0 before injection included a moderate to severe synovial effusion in all three joint compartments, mild to moderate subchondral sclerosis of the lateral FC and TC, and mild to severe subchondral fluid accumulation in the FC. Bone attrition (bone shape grades 2 and 3) at the central contact area of the lateral FC was observed in two animals bilaterally (#2 and #6) and in two animals unilaterally (#5 and #10) at time point 0.
The individual MRI parameters changed throughout the evaluation period as follows. 1) Articular cartilage evaluation did not show any perceivable pattern throughout the evaluation period. 2) Bone shape, sclerosis, and fluid accumulation showed the highest variation between the 12 individuals. However, within a sheep, these parameters changed only slightly during the evaluation period. 3) Joint capsule evaluation did not show any perceivable pattern throughout the evaluation period. At the cranial and lateral edge of the lateral FTJ, in the area of the cranial surgical joint access, joint capsule tissue and periarticular soft tissue bulged into the joint space. Caudally, the popliteus muscle bulged into the joint space. In dorsal images, this protruding soft tissue was triangular. It was visible at week 0 and did not change during the evaluation period. The mensical remnant/meniscofemoral ligament was readily visible in the caudal aspect of the FTJ. In sagittal views, it measured about 5 mm in a craniocaudal direction. 4) Joint effusion was marked in all three compartments and decreased over time in all animals (Fig. 4). The caudal recess of the medial FTJ appeared larger than the lateral one.

Combined synovial fluid amount scores throughout the study. Median, interquartile range (box), range (whisker), and outlier (°) of the synovial fluid amount (combined all three compartments) throughout the study; note the score decreases in the mesenchymal stromal cell-treated and in the control group. There was no significant difference at any time between the treatment and control joint.
Important to note was that the overall MRI score in the left and right knee joint was not significantly different at week 0. This was still true when the parameters for cartilage and medial FTJ and FPJ were excluded from the score.
Radiographic Image Evaluation
At time point 0, new bone formations were visible, that is, the bone margins were blurry, and newly formed osteophytes were up to 2 mm in length. In all animals, the lateral FC tilted into the joint space, often contacting the TC. In 6/72 PA views, the joint space could not be evaluated adequately due to malalignment; sheep tend to lift the imaged leg upon cassette placement making image acquisition challenging at times. Owing to the uncertainty of weight bearing, the criterion “joint space” was excluded from the final radiographic score. Based on the radiographic overall score, there was no significant difference on OA status between the treatment (9.0, IQR 4.75) and control group (8.0, IQR 6.0) at time point 12. The overall radiographic score, irrespective of the treatment, increased in each group significantly from time point 0 to 12. Again, there was no significant difference in the OA degree between left and right at time point 0. In Figure 5, representative PA images of animal #1 with overall moderate OA changes are depicted.

Representative radiographic images of the knee joints throughout the study. Posterior–anterior radiographic view of the left (top row) and right (bottom row) knee joint of animal #1 at time point −6 (native stage), time point 0 (before intra-articular injection), and time point 12 (conclusion of the study). In this animal, the right side was treated with mesenchymal stromal cells; the left side received phosphate-buffered saline control injection; lateral is to the right. Note the increasing amount of new bone formation at the * lateral and medial tibial condyle and ° abaxial and axial aspect of the lateral femoral condyle; → uneven and collapsed joint space.
Postmortem Macroscopic Evaluation
Soft tissue formation was observed in all lateral aspects of the lateral FTJ and filled the space between the lateral FC and TC. The quality of the new tissue was independent of applied MSCs. In the treatment group, 6/12 samples were judged as undefined soft tissue, and 6/12 samples resembled meniscoid tissue. In the control group, 7/12 samples were evaluated as undefined soft tissue, while 5/12 samples resembled meniscoid tissue.
Lateral meniscectomy led to fissuring and focal cartilage erosions of the lateral FC and TC. In some joints, subchondral bone defects of the FC, and in all joints osteophyte formation was visible. The medial FTJ showed no or only mild cartilage changes and very few and mild degrees of osteophytes.
The overall macroscopic scores in treatment and control knee joints were very similar (9.0, IQR 4.6 and 9.0, IQR 3.8, respectively) (Table 5). Separate evaluation between treatment and control joint scores for cartilage (5.0, IQR 3.0 and 5.0, IQR 2.5, respectively) and osteophyte formation (4.5, IQR 2.8 and 4.0, IQR 2.0, respectively) also resulted in no significant difference.
Results of Macroscopic Evaluation [Median (Interquartile Range)] According to Little et al. (37) Following Mesenchymal Stromal Cell (MSC) and Control Intra-Articular Injection

Regression analysis between the macroscopic scores (i.e., cartilage, osteophyte, total macroscopic score) and the overall MRI score revealed a significant correlation between the MRI score and the cartilage score only for both the treatment (r2=0.40, p = 0.028, F=6.6) and the control joint (r2=0.55, p = 0.006, F = 12.1).
Histologic Evaluation
Based on the OARSI score, no significant effect of MSC administration on the OA degree was detectable (Table 6).
Results of Histologic Evaluation [Mean (±Standard Deviation)] According to Pritzker et al. (51) Following Mesenchymal Stromal Cell (MSC) and Control Intra-Articular Injection

At the lateral FC, overall OA was even more pronounced in the MSC treatment group compared to the control group. This was the case for the grade, which indicates OA severity (treatment 5.00 ± 1.15, control 4.63 ± 1.11), and for the stage, which expresses the horizontal extent of cartilage involvement (treatment 3.00 ± 0.6, control 2.83 ± 0.72). Consequently, the final score was worse in the MSC treatment group as well (treatment 15.38 ± 5.71, control 13.29 ± 5.35).
In contrast, OA was less prominent in the MSC treatment group at the lateral TC: this was true for the grade (treatment 3.96 ± 0.84, control 4.83 ± 1.01), stage (treatment 3.25 ± 1.06, control 3.50 ± 0.67), and consequently for the final score as well (treatment 13.33 ± 5.63, control 17.00 ± 5.08, respectively), but data did not reach significance.
Discussion
MSC injection provided improvement of MRI scores over time, whereas control treatments did not. This may indicate amelioration of disease progression, which was, however, not substantiated in radiographic macroscopic or histologic analyses. This is in contradiction to some previously published in vivo experimental results (44) and to clinical experience (21,63). Therefore, several possible explanations need to be discussed.
We used an established ovine model of OA induction by bilateral, lateral meniscectomy (3,9-12,38,55). This model is characterized by the development of morphologic and histologic changes in articular cartilage typical of early established OA (3,11). In a comparable study (44), goats were used, and OA was induced by unilateral, medial meniscectomy combined with cranial cruciate ligament resection. The choice of model may account in part for the different results obtained. At the time of treatment injection (time point 0), the degree of OA on radiographic and MR images was judged to be moderate; however, it was in two animals bilaterally and in two animals unilaterally severe. These findings were confirmed on macroscopic evaluation 12 weeks later. The macroscopic appearance of the remaining joints was also observed in previous publications (11). It is known that lateral meniscectomy has a greater impact on OA development compared to medial meniscectomy (25,56). This is thought to be due to the larger area of articular cartilage covered by the lateral meniscus versus the medial side (107.7 mm2 vs. 60.8 mm2), even though the medial side of the knee bears more weight (5.5 MPa vs. 4.4 MPa) (36). Also, bilateral procedures result in higher degrees of OA compared to unilateral surgery (37).
Postoperative exercise influences OA degree. A moderate (24 km/week) walking program beginning 1 week after OA induction exacerbates disease status (5). On the contrary, less forced exercise (12 km/week) beginning 3 weeks after surgery was judged to be beneficial for the quality of cartilaginous matrix, but was accompanied by osteophytosis and cartilage hyperplasia (26). In our study, animals received comparatively little forced exercise (7 min/day, i.e., approximately 3.5 km/week) beginning 1 week after surgery for a total of 3 weeks and no controlled exercise thereafter.
Body weight and age are known risk factors for OA. Our animals were young adults. One previous study used immature sheep (11-12 months) with an average body weight of 25 kg, and their positive effect of intra-articularly applied MSCs might be explained by these facts (1).
No additional intra-articular medication was used in our study since the sole effect of MSCs was to be evaluated. In contrast, sodium hyaluronan (HA) was coinjected in previous reports evaluating the effect of intra-articular MSCs (21,42-44). Injection of chondroprotective medication like HA by itself can influence outcome measures in experimental OA models (4,10,12,24,55). Furthermore, in vitro experiments showed that HA induces chondrogenesis of equine MSCs (29). An improved outcome of MSC-HA coinjection versus sole MSC injection is therefore conceivable.
The source of MSCs (e.g., fat vs. BM derived) influences cell characteristics as well. Equine BM-derived MSCs showed higher chondrogenic potential compared to fat-derived cells (65). In our study and in the majority of the comparable large animal studies, BM-derived MSCs were used (1,43,44).
We injected 10 × 106 nonlabeled MSCs in addition to the 10 × 106 SPIO-labeled MSCs since intracellular iron decreases the chondrogenic capacity of MSCs (32). Thus, comparison to previously published data using between 10 × 106 to 20 × 106 MSCs (44) can be made. A benefit of higher cell numbers has been contemplated in the past, and comparative human case studies using up to 100 × 106 MSCs are still under investigation (58). However, in a recent human trial, no increased benefit of 150 × 106 MSCs versus 50 × 106 MSCs was seen (63).
The time point of injection in regard to disease progress may influence the outcome as well. In experimental studies, the OA degree increases with time postinduction (37). Six weeks following meniscectomy an established disease status developed (3,11), which is a realistic scenario for clinical cases (21). An improved outcome after intra-articular MSC injection early in the disease process was suggested (43) or was significant (57) in experimental models. In a human trial, the MSCs were administered 7-10 days after subtotal meniscectomy (63). We saw substantial new bone formation on radiographs in all our animals at the time of injection 6 weeks after meniscectomy, and we believe that the optimal time point for therapeutic intervention for the MSCs had passed.
The end point of our study was 3 months after MSC injection. A positive long-term outcome, in terms of athletic soundness, after a considerably longer follow-up period of 24 months after intra-articular MSC injection in equine clinical cases was reported (21). In a previous study, where intra-articular MSCs resulted in superior OA grades at 6 weeks after injection, this effect was not observed anymore 20 weeks after injection (44). The number of human patients showing a significant meniscal volume on MRI after intra-articular MSC injection increased during a 2-year follow-up compared to the control group (63), thus suggesting a prolonged positive influence. A longer follow-up period might have resulted in a different outcome in our study.
It is important to note that there was no significant difference in OA degree on MRI, radiographs, and synovial fluid between the left and right limb at the time of joint injection. Nonetheless, there seemed to be an individual variance in OA development after meniscectomy. This may be due to variations in surgical technique or individual OA predisposition. A genetic trait for superior cartilage healing was found in a superhealer strain of mice (19,22). All our research animals originate from one source, that of a large, established, healthy breeding herd. Interestingly, a high prevalence of naturally occurring cartilage defects in ovine knees of adult, mixed breed Texel ewes without clinical signs was reported (60). Those researchers applied OARSI recommendations (37) and found that only 34% of the evaluated animals were considered OA free. There was an age-related increase of OA prevalence, and no lesions were found in animals under 3 years of age. Also, of the three knee compartments, the lateral FTJ seems to be the least affected one (60).
In 5/24 joints, the FPJ was injected instead of the lateral FTJ. We assume that MSCs are still effective within the FTJ because in sheep all three knee joint compartments always communicate (62). Also, in MR images, we observed signal void artifacts caused by the SPIO particles within all lateral FTJs (17). Other authors (62) proposed three arthrocentesis sites for the knee in sheep including a cranial approach for the lateral FTJ. We avoided this area on purpose because of the surgical scarring there in our research animals; we used a caudal approach instead.
The synovial fluid in some animals showed considerably high values at the time of injection. Applying cutoff values at 5 × 10⁹ cells/L TNC, 50 g/L TP (60), and 75% PMN cells, some of our animals had one increased parameter, but none of them had more than two, thus indicating a strong, but not infectious, arthritis. Those animals with higher values were not the same as the ones with stronger OA degrees. The majority of the joints had very low values in all three parameters at time points 0 and 12. Inflammatory stimuli enhance the regenerative potential and anti-inflammatory responses of MSCs (40); however, specifically IL-1 and TNF-α have a negative impact on the chondrogenic capacity of the MSCs (30).
Another point to consider is the choice of outcome measures. The degree of OA in the current study was determined with semiquantitative scores for MRI, radiography, and final macroscopic and histologic evaluation, the latter being the gold standard for experimental studies (37). MRI permits noninvasive longitudinal observation, allows the delineation of different tissues, and SPIO-labeled MSCs can be traced. However, the presence of SPIO may have affected our ability to detect subtle differences on MR images between treated and control limbs. We are not aware of a comprehensive OA grading system for sheep using MRI. The normal ovine knee MRI anatomy was published only very recently (61). With high field MR units and dedicated sequences like the magnetization transfer MRI protocol (34) or a modified dGEMRIC protocol (35), cartilage degradation was assessed in a caprine OA model. Unfortunately, this technology was not available to us. It might, however, have detected more subtle differences between the treatment and control group.
In regard to usefulness of our chosen MRI parameters, we found the articular cartilage scores to be a less reliable parameter for OA progress evaluation. Nevertheless, even excluding cartilage parameters from the overall score resulted in no significant difference. A 0.5T MRI unit is probably not sufficient for correct display and evaluation of a structure less than 1 mm in size, even though slices of 1 mm thickness were obtained. Average cartilage thickness of the trochlear ridges and the medial FC is reportedly 0.4-0.5 mm in sheep (23), and even a 3T MRI unit may be insufficient for precise cartilage evaluation in sheep (61).
Joint capsule evaluation was not without difficulties either, especially due to the large signal void artifact in animals treated with any kind of SPIO products. Oblique transection, intra-articular synovial plicae, adhesion formation, adjacent periarticular soft tissue, surgical scar tissue formation, and degree of joint filling may have also influenced the assessment of the joint capsule. Similarly, intra-articular adhesion formation is maybe a less reliable parameter, too. If a joint is not effused, no adhesions can be observed. Also, two synovial plicae were recently described within the caudal aspect of the knee joint (62). In our animals, the lateral caudal knee joint aspect was surgically altered during meniscectomy. However, it is possible that some structures classified as adhesions may indeed be normal plicae.
Finally, due to time constraints, we were limited to one sequence (T2*). This sequence is particularly susceptible to artifacts induced by the SPIO particles (33). This limits comparison to previous publications and restricts detectability of pathologic changes usually visible on MRI (45,46,50). MRI was used as the final outcome measure in a bilateral equine OA model study assessing effects of intra-articular MSCs. No differences between treated and nontreated joints were detectable via MRI, even though some significant effects on macroscopic evaluation were apparent (42).
An interesting finding in MRI is the soft tissue structure in the lateral aspect of the lateral FTJ in all animals, irrespective of the treatment method and even before intra-articular injection 6 weeks after OA induction occurred. The joint capsule bulged into the vacant space left by the exteriorized meniscus, and from the caudal side, the popliteus tendon is also part of the prolapsing tissue. This has been mentioned before in the context of macroscopic evaluation (37). In a few of our animals, this soft tissue structure strikingly resembled normal meniscal tissue on macroscopic evaluation. A substantial meniscal regrowth on macroscopic postmortem evaluation in some research sheep after unilateral, medial meniscectomy without any treatment administration was previously described (9,26). A neomeniscus-like structure has been described in a caprine meniscectomy model 6 and 20 weeks after HA-MSC injection, but it was not observed in the HA-control group (44). Contrary to that, we were not able to see a correlation between the appearance of this soft tissue structure and administration of MSCs in our ovine model. Discrepancy in findings may be due to species-specific differences.
We tried to indirectly judge the quality of our MRI scoring system by correlating it to the macroscopic scores. The significance obtained is of uncertain value since the only macroscopic score to be significantly correlated to the overall MRI score was “cartilage” only. A marked variability in accuracy of lesion detection using either a low (0.27 T) or high (1.5 T) field MR system compared to histopathology was detected in a study evaluating cartilage, subchondral and trabecular bone in equine cadaver fetlock joints (54). MRI interpretation of the trabecular bone was most reliable, but an overall high likelihood of false-positive results was emphasized.
Similar to MRI, the radiographic scoring system for sheep had to be adapted from other animals and humans. Loss of joint space in the FTJ is, even being the gold standard in humans, very difficult to assess accurately due to variability in imaging acquisition and weight bearing. Additionally, the removed meniscus greatly influences the size of the space. In contrast to the overall MRI score, the radiographic score increased throughout the study. A possible explanation for this is that the MRI score included degree of joint filling, which decreased to some extent in all animals over time. On the other hand, the radiographic score is dominated by parameters for new bone formation, which in turn is always underestimated in MRI images.
For many years, the Histologic/Histochemical Grading System (HHGS) has been used as a scoring system for the quality of cartilage (41). However, it has been criticized for its questionable reproducibility and inadequate assessment of mild and moderate OA (48,49). Furthermore, it does not evaluate the extent to which the cartilage surface is affected (15,51) and was demonstrated to have a significant intra- and interobserver variability (15,48,49,59). We therefore used the OARSI Osteoarthritis Cartilage Histopathology Assessment System, which has been described as being more adequate for assessing mild and moderate OA, which assesses severity and cartilage lesions, and can be applied more consistently by less experienced observers than the HHGS (52).
In summary, according to our first hypothesis, we were able to show a significant improvement in MRI scores over time, whereas the control injection did not. This may indicate amelioration of disease progression. However, we had to refute our second hypothesis as there was no treatment effect detectable on MRI, radiographs, macroscopic, and histologic evaluation 12 weeks after injection. Our choice of outcome measures may have limited the detection of more subtle changes. Additionally, considering the individual variation observed, a different animal model or higher case number might be necessary to attain sufficient statistical power to detect subtle differences. Our results indicate that OA might benefit from intra-articular MSC injection, but further studies are needed to refine patient selection and injection parameters for a more substantially improved outcome.
Footnotes
Acknowledgments
The authors would like to thank Mrs. Ines Merseburger for her excellent work in acquiring the MR images and Prof. Dr. Johannes Seeger and Mrs. Gabriele Lindner for their support during histologic processing. We would also like to thank Mr. Miguel Espina, Dr. Christin Veit, and Mrs. Doreen Stein for taking such good care of our research sheep. The work presented in this article was made possible by funding from the German Federal Ministry of Education and Research (BMBF, PtJ-Bio, 0313909/0315883). Results of this project have been published previously as poster and oral presentation at the annual scientific meeting of the European College of Veterinary Surgeons (ECVS), Barcelona, Spain in July 2012. The authors declare no conflicts of interest.