
Abstract
Genetically engineered stem cells that overexpress genes encoding therapeutic products can be exploited to correct metabolic disorders by repairing and regenerating diseased organs or restoring their function. Hair follicles are readily accessible and serve as a rich source of autologous stem cells for cell-based gene therapy. Here we isolated mesenchymal stem cells from human hair follicles (HF-MSCs) and engineered them to overexpress the human insulin gene and release human insulin in a time- and dose-dependent manner in response to rapamycin. The engineered HF-MSCs retained their characteristic cell surface markers and retained their potential to differentiate into adipocytes and osteoblasts. When mice with streptozotocin-induced type 1 diabetes were engrafted with these engineered HF-MSCs, these cells expressed and released a dose of human insulin, dramatically reversed hyperglycemia, and significantly reduced death rate. Moreover, the engineered HF-MSCs did not form detectable tumors throughout the 120-day animal tests in our experiment. Our results show that HF-MSCs can be used to safely and efficiently express therapeutic transgenes and therefore show promise for cell-based gene therapy of human disease.
Introduction
Type 1 diabetes is caused by immune-mediated destruction of insulin-secreting islet β-cells in the pancreas (9,19). Pancreatic islet transplantation is currently being developed as a potential treatment for diabetes of various etiologies (30). Allogeneic islet transplantation effectively controls the levels of blood glucose and reduces the mortality rate of patients with diabetes (42). Despite its efficacy, the lack of islet donor sources hinders islet cell transplantation (56). Stem cell therapy helps overcome the lack of donor cells (2,27,49). Therefore, researchers focus on developing in vitro methods that induce stem cells to differentiate into insulin-producing cells that help repair lesions in pancreatic islet tissue, secrete insulin, and control blood glucose levels in patients with diabetes (21,26,29,45,57).
Different sources of stem cells can be induced to differentiate into insulin-secreting cells in vitro and can reverse hyperglycemia when transplanted into diabetic mice (4,14,51). However, the scarcity of donor cells, ethical concerns, and the immune response, as well as teratoma formation by embryonic stem cells (ESCs), limits the use of ESCs in translational medicine (11,14). Although exogenous insulin therapy mimics the regulation of glucose in vivo and delays the occurrence of complications, multiple daily injections or life-long subcutaneous infusion of insulin is inconvenient and sometimes causes hypoglycemia (55).
The introduction into the body of exogenous genes that express therapeutic proteins (gene therapy) provides an option to treat patients with type 1 diabetes (1). Stem cells, which self-renew and differentiate into distinct lineages, can be engineered to express and deliver therapeutic proteins to specifically repair and regenerate damaged or diseased tissues and organs or restore their function (13,15,44).
Human hair follicles serve as a convenient source of mesenchymal stem cells (HF-MSCs) because they are readily accessible, and harvesting hair follicles causes only minor adverse effects (24,50). Moreover, transplanted HF-MSCs survive in the human body for extended periods because of their low immunogenicity (36,38). We recently patented a technique to generate HF-MSCs in large numbers (United States Patent Application Number 13/517,068) for use in cell-based gene therapy.
In the present study, we genetically engineered HF-MSCs to release human insulin in a controlled manner. The engineered HF-MSCs retain their characteristic cell surface markers and their multipotency, and they release human insulin in a time- and dose-dependent manner in response to rapamycin. The engineered HF-MSCs released a dose of human insulin that significantly reversed hyperglycemia and dramatically reduced the death rate of mice with type 1 diabetes induced with streptozocin (STZ). Our results demonstrate that hair follicles are a rich source of stem cells that can be genetically engineered to safely and efficiently deliver a therapeutic protein.
Materials and Methods
Ethics Statement
The Ethics Committee of Jilin Province (China) approved this study. HF-MSCs were obtained from the scalp hairs of three volunteers (41-year-old female, 29-year-old male, and 49-year-old male) who granted prior informed written consent.
Isolation and Cultivation of HF-MSCs
HF-MSCs were isolated and purified as described previously (58). Briefly, at least 20 hairs were physically removed from the occipital region of the volunteers' scalp. Hairs with intact follicles were extensively washed with phosphate-buffered saline (PBS; Life Technologies, Carlsbad, CA, USA) containing 1% penicillin/streptomycin solution (P/S; 100 IU/ml penicillin, 100 IU/ml streptomycin; HyClone, Victoria, Australia). After washing, the hair shafts were cut off, and the remaining portions of the hairs were manually placed on the bottom of a 24-well plate (Corning, Tewksbury, MA, USA), one piece of hair per well, and cultured in 100 ml of Dulbecco's modified Eagle medium: nutrient mixture F-12 (DMEM/F12; Life Technologies) containing 10% fetal bovine serum (FBS; HyClone), 1% P/S, and 2 ng/ml basic fibroblast growth factor (bFGF; Life Technologies) and incubated at 37°C overnight in an atmosphere containing 5% CO2. The next day, 400 μl of culture medium was added to the well, and the medium was changed every 3 days. When the spindle-shaped cells migrated from the hair follicles, they were trypsinized (0.25% ethylenediaminetetraacetic acid-trypsin; Life Technologies), pooled, and expanded using the same culture conditions.
Analysis of Multilineage Differentiation Potential
HF-MSCs were cultured in various types of differentiation media, and their multilineage differentiation potential was analyzed as described previously (25,37). Briefly, adipogenic differentiation was induced in an adipogenic medium consisting of high glucose-DMEM (HG-DMEM; Life Technologies), 10% FBS, 1 μM dexamethasone (Sigma-Aldrich, St. Louis, MO, USA), 0.5 mM isobutylmethylxanthine (Sigma-Aldrich), 10 μM insulin (Sigma-Aldrich), and 200 μM indomethacin (Sigma-Aldrich). After culture for 2 weeks, the formation of lipid droplets was assessed using Oil Red O (Sigma-Aldrich) staining. Osteogenic differentiation was induced in an osteogenic medium consisting of HG-DMEM, 10% FBS, 0.1 μM dexamethasone, 50 μM ascorbate-2-phosphate (Sigma-Aldrich), and 10 nM β-glycerolphosphate (Sigma-Aldrich). After culture for 4 weeks, the mineralization of accumulated calcium was assessed using Alizarin Red S (Sigma-Aldrich) staining.
RNA from differentiated cells was isolated using Trizol reagent (Life Technologies) according to the manufacturer's instructions. Reverse-transcription polymerase chain reaction (RT-PCR) was performed using EasyScript Reverse Transcriptase (Beijing Transgen Biotech, Beijing, China). Subsequent PCR reactions were performed using complementary DNA (cDNA). The cDNA was amplified by PCR to detect gene expressions of the adipocyte lipid-binding protein, activating protein 2 (aP2) and runt-related transcription factor 2 (RunX2) in differentiated HF-MSCs (25,37). Glyceraldehyde-3-phsosphate dehydrogenase (GAPDH) was used as an internal standard. The PCR primers were aP2 (F, 5′-AAAGAAGTAGGAGTGGGCTTTGC-3′ and R, 5′-CCCCATTCACACTGATGATCAT-3′) (NCBI Reference Sequence: NM_001442.2); RunX2 (F, 5′-TGGT TAATCTCCGCAGGTCAC-3′ and R, 5′-ACTGTGCT GAAGAGGCTGTTTG-3′) (NCBI Reference Sequence: NM_001015051.3); GAPDH (F, 5′-ACATCAAGAAG GTGGTGAAGCAGG-3′ and R, 5′-CAGCGTCAAAG GTGGAGGAGTGG-3′) (NCBI Reference Sequence: XM_005253678.1).
Immunophenotyping of HF-MSCs
Flow cytometry and immunostaining were carried out as described previously (24,25,53). After culture, 1 × 10⁶ cells were resuspended in PBS and fixed with 4% paraformaldehyde [room temperature (RT), 10 min; Beijing Dingguo, Beijing, China]. After three washes in PBS, cells were blocked with 2% bovine serum albumin (BSA; Roche Diagnostics, Mannheim, Germany) in PBS (RT, 30 min) and then incubated with mouse monoclonal antibodies as follows: anti-human cluster of differentiation 44 (CD44; R&D Systems, Abingdon, UK), CD73 (Life Technologies), CD90, CD105, CD31, CD34, and CD45 (1:100 dilutions, RT, 1 h; all eBioscience, San Diego, CA, USA). After three washes in PBS, the cells were incubated with Alexa Fluor® 555-conjungated goat anti-mouse antibody (1:400 dilutions, RT, 1 h; Cell Signaling, Danvers, MA, USA). The cell nuclei were stained with Hoechst 33342 (1:10,000, RT, 2 min; Life Technologies). After washing in PBS, HF-MSCs were analyzed using a fluorescence-activated cell sorting (FACS) Calibur flow cytometer (BD Biosciences, San Jose, CA, USA) equipped with Cell Quest Pro Analysis software (BD Biosciences).
HF-MSCs were seeded on coverslips (Fisher Scientific, Pittsburg, PA, USA), grown to 70% confluence, fixed and incubated with antibodies as described above, and visualized using a fluorescence microscope (Olympus, Tokyo, Japan).
Virus Preparation and Cell Transduction
The lentiviral vector (pCMV-nFM-FCS-hppI4-HD-IRES-GFP) used for overexpression of the release-controlled insulin gene in our experiment was kindly provided by Dr. Andreadis (State University of New York at Buffalo). The vector was engineered to produce a fusion protein between the self-dimerization mutant of FK506-binding protein and the proinsulin-containing furin protease cleavage sites. The resulting fusion protein accumulates in the endoplasmic reticulum and is released upon contact with the small organic molecule, rapamycin (48). For the preparation of the lentivirus, 15 mg of lentiviral vector was cotransfected with 5 μg pMDL-g/p, 3 μg pSRV-rev, and 1.5 μg pMD2.G (all vectors kindly provided by S. T. Andreadis) into human embryonic kidney 293T cells (obtained from the Xiaolei Group, Shanghai Institute of Biochemistry and Cell Biology, Shanghai Institutes for Biological Science, Chinese Academy of Sciences) in 100-mm dishes (Corning) in the presence of FuGENE HD (Roch Diagnostics) according to the manufacturer's protocol. Viral supernatants were collected 48 and 72 h after transfection, passed through 0.45-μm filters (Millipore, Bedford, MA, USA), and concentrated by ultracentrifugation (Optima™L-100XP Ultracentrifuge; Beckman Coulter, Palo Alto, CA, USA) at 20,000 × g at 4°C for 2 h. The viral pellets were resuspended in HF-MSC culture medium to yield purified and 8× concentrated virus stock. HF-MSCs at passage 3 were transduced twice with viral particles in the presence of polybrene (Sigma-Aldrich) at a final concentration of 10 μg/ml. After transduction, when expressing green fluorescent protein (GFP) cells appeared, they were sorted using FACS (BD, FACS Aria) and designated insulin-producing cells (In-HF-MSCs). The HF-MSCs transduced with a lentiviral vector-expressing GFP under the control of the CMV promoter were designated G-HF-MSCs and served as controls.
Rapamycin Preparation and Insulin Release
The preparation of rapamycin (Sigma-Aldrich) for in vitro and in vivo experiments was performed as described previously (48). For in vitro experiments, rapamycin was dissolved in ethanol and then diluted with the cell culture medium to the indicated concentrations. For in vivo experiments, rapamycin was initially dissolved in N,N-dimethylacetamide (Alfa Aesar, Ward Hill, NY, USA) and then diluted with a solution containing a mixture of 4% (v/v), N,N-dimethylacetamide, 10% (v/v) polyethylene glycol (average molecular weight 400; Alfa Aesar), and 17% (v/v) polyoxyethlene sorbitan monooleate (Alfa Aesar) to the indicated concentrations.
In-HF-MSCs were seeded on Lab-Tek chamber slides (Sigma-Aldrich) and cultured in DMEM-F12 containing bFGF and FBS. When the In-HF-MSCs proliferated to 70–80% confluence, they were treated with 5 μM of rapamycin for 4 h. Control cells were cultured in medium alone. After treatment, In-HF-MSCs were fixed with 4% paraformaldehyde and permeabilized with 0.1% Triton X-100 (Sigma-Aldrich). The slides were blocked with 2% BSA in PBS, and the expression of insulin was detected using a rabbit anti-human insulin antibody (1:100 dilutions, overnight at 4°C; Cell Signaling) and Alexa Fluor® 555-conjugated secondary goat anti-rabbit (1:100 dilutions, RT, 1 h; Cell Signaling). The slides were sealed with antifade solution containing 4′,6-diamidino-2-phenylindole (DAPI; Vectashield, Vector Lab, Burlingame, CA, USA) or Hoechst 33342. Images of In-HF-MSCs were acquired using a Delta Vision Core imaging system (API, Rockville, MD, USA), analyzed using Imaris software (Olympus, Tokyo, Japan), or acquired using laser scanning confocal microscopy (Olympus FV500).
Measurement of C-Peptide and Insulin Levels
Passage 4 In-HF-MSCs were seeded in a 24-well plate, 3 × 10⁴ cells per well, and cultured in 500 μl of DMEM-F12 supplemented with bFGF and 10% FBS. The next day, the culture medium was exchanged with fresh medium containing 5 μM of rapamycin. At the indicated times, 20 μl of culture supernatant was collected, and the amount of C-peptide in the supernatant was determined by enzyme-linked immunosorbent assay (ELISA) using a human C-peptide kit (Millipore).
To investigate the dose dependency of insulin release, In-HF-MSCs were seeded and treated with rapamycin at the indicated doses. The culture supernatant was collected at the time point of maximum release of insulin and subjected to C-peptide analysis using the human C-peptide kit (Millipore). To determine insulin levels in blood after rapamycin injection, mouse sera were collected from the tail vein at the indicated time points, and the levels of human and mouse insulin were determined using an ultrasensitive Human/Mouse Insulin ELISA Kit (Mercodia, Winston Salem, NC, USA).
Implantation of Transgenic HF-MSCs and Analysis of Hyperglycemia
Female BALB/cA-nu mice (20 g, 6–8 weeks of age) were purchased from Beijing HFK Bioscience Co., Ltd. All animal procedures were conducted in compliance with the guidelines approved by the China Association of Laboratory Animal Care and the Institutional Animal Care Committee. We generate mice with diabetes that serve as a model for the human disease by administering a single intraperitoneal injection of STZ (180 mg/kg body weight; Sigma-Aldrich) into BALB/cA-nu mice that were first fasted overnight. Mice were considered diabetic if blood glucose levels were greater than 11 mmol/L. The diabetic mice were randomly divided into three groups of 12 mice each as follows: (I) Sham group (injected with 200 μl PBS); (II) In-HF-MSCs group (injected with 5 × 10⁶ In-HG-MSCs in 200 μl of PBS); and (III) G-HF-MSCs group (injected with 5 × 10⁶ G-HF-MSCs in 200 μl PBS). PBS or 5 × 10⁶ transgenic HF-MSCs were injected subcutaneously into the mouse's back. Untreated mice and mice not receiving implants served as the Normal group (n = 12). Seven days after cell implantation, diabetic mice were fasted for 3 h and then injected intraperitoneally with 100 μl rapamycin (30 mg/kg body weight). Blood glucose levels, body weight, and death rate were assessed at the indicated times (see Results).
Glucose Tolerance Test
The test was performed on day 50 on diabetic mice implanted with In-HF-MSCs. After treatment with rapamycin, diabetic mice were fasted overnight. Whole blood was collected from the tail vein, and blood glucose levels were measured using a glucose meter (Roche Diagnostics) 0, 30, 60, 90, and 120 min after intraperitoneal injection of glucose solution (1.5 g/kg body weight; Sigma-Aldrich). Normal mice served as controls. Each group comprised six mice.
In Vivo Live Image Detection and Histology
Diabetic mice at days 3, 60, 90, and 120 postimplantation of In-HF-MSCs were anesthetized with isoflurane and subjected to in vivo live image analysis (IVIS Spectrum; Caliper Life Sciences, Hopkinton, MA, USA). Images were collected and analyzed using Living Image 3.1 software (Caliper Life Sciences). The mice were then sacrificed by decapitation, and graft-bearing tissues (1.5 cm × 1.5 cm) were removed. The tissues were fixed in 10% formalin (Beijing Dingguo), embedded in paraffin, and stained with hematoxylin and eosin (Beijing Dingguo) or incubated with antibodies for immunofluorescence assays. For immunofluorescence analysis, tissue sections (5 μm thick) were autoclaved in 10 mM citrate buffer solution (pH 6.0) (Beijing Dingguo) for antigen retrieval, washed in PBS, permeabilized in 0.1% Triton X-100/PBS (RT, 20 min), and blocked in 2% BSA/PBS (RT, 1 h). The tissue sections were then incubated with rabbit anti-human insulin antibody (1:100, overnight at 4°C) and mouse anti-GFP antibody (1:100, overnight at 4°C; Cell Signaling). After washing in PBS, the tissue sections were incubated for 1 h at RT with Alexa Fluor® 555-conjugated goat anti-rabbit antibody (1:400) and Alexa Fluor® 488-conjugated goat anti-mouse antibody (1:400; Cell Signaling). Tissue sections prepared on day 120 mice were subjected to immunofluorescence analysis using a mouse antihuman nucleus antibody (1:20, overnight at 4°C; Millipore). After washing in PBS, the tissue sections were incubated for 1 h at RT with Alexa Fluor® 488-conjugated goat anti-mouse antibody. The tissue sections were washed in PBS, stained with Hoechst 33342, and visualized using a fluorescence microscope (Leica DMI4000B, Leica Microsystems Ltd., Wetzlar, Germany).
Statistical Analysis
Data are expressed as the mean ± standard deviation (SD) of three repeated studies unless specified otherwise. Statistical comparisons between two groups were determined using the Student's t-test. Differences in blood glucose levels and body weights among groups assigned to the Sham, G-HF-MSCs, and In-HF-MSCs were analyzed by one-way analysis of variance (ANOVA), followed by the Bonferroni's post hoc test to determine significant differences between each two groups. Survival curves were prepared using the Kaplan–Meier method and analyzed for statistical significance using the Cox–Mantel test. A value of p < 0.05 was considered statistically significant. The data were analyzed using SPSS 17.0 software (IBM, New York, Armonk, USA).
Results
Isolation and Characterization of HF-MSCs
After 1 week in culture, some cells that migrated from the dermal sheath and papilla (Fig. 1Aa) that exhibited small, spindle-shaped, fibroblast-like morphology characteristic of MSCs (Fig. 1Ab) were pooled and expanded. When cultured using adipogenic and osteogenic conditions, RT-PCR analysis revealed that the spindle-shaped cells expressed the genes encoding adipocyte-specific transcription factor aP2 (Fig. 1B) and the osteoblast-specific RunX2 (Fig. 1C). The cells finally differentiated into adipocytes, as indicated by their accumulation of cytoplasmic lipid droplets (Oil Red O staining) (Fig. 1D), or osteoblasts, as indicated by calcium deposition in the cells (Alizarin Red S staining) (Fig. 1E). Immunofluorescence and flow cytometric analyses showed the spindle-shaped fibroblast-like cells were MSCs because they were highly positive for CD44, CD73, CD90, and CD105, but negative for CD31, CD34, and CD45 (Fig. 1F, G). The spindle-shaped fibroblast-like cells were therefore designated HF-MSCs.

Isolation and characterization of HF-MSCs. (A) The morphology of cells migrating from hair follicle root tissue (a) was fibroblast-like (b). (B) PCR analysis of the adipogenic marker-activating protein 2 (aP2). (C) PCR analysis of the osteogenic marker runt-related transcription factor 2 (RunX2). (D) Oil Red O staining of undifferentiated HF-MSCs and HF-MSCs differentiated into adipocytes. (E) Alizarin Red S staining of undifferentiated HF-MSCs and HF-MSCs differentiated into osteocytes. (F) Immunofluorescence and (G) flow cytometric analysis of cell surface markers on HF-MSCs. Cells stained with only Alexa Fluor® 555-conjugated secondary antibody served as negative controls. All samples were counterstained with Hoechst (blue) to identify the nuclei. Values are reported as the mean ± SD of triplicate samples in a representative experiment (n = 3). Ctrl, control; Adipo, adipogenic; Osteo, osteogenic; GAPDH, glyceraldehyde-3-phsosphate dehydrogenase; CD44, cluster of differentiation 44. Scale bar: 200 μm (A), 50 μm (D–F).
Generation of Transgenic HF-MSCs Overexpressing the Human Proinsulin Gene
HF-MSCs at passage 3 were transduced with recombinant lentivirus encoding the human proinsulin-GFP genes (48). After two consecutive transductions, up to 85% transduction efficiency was obtained according to the results of flow cytometry (Fig. 2A, B). The transduced cells were passaged two to three times and subjected to FACS. The cells were observed using live-cell microscopy imaging systems (Fig. 2C) to confirm that the cultures contained >90% GFP+/DAPI+ cells (Fig. 2D). Thereafter, the transgenic HF-MSCs overexpressing the human insulin gene were designated In-HF-MSCs. HF-MSCs were transduced with lentiviral particles encoding GFP using the same procedure, sorted, and designated G-HF-MSCs that served as controls in the subsequent experiments.
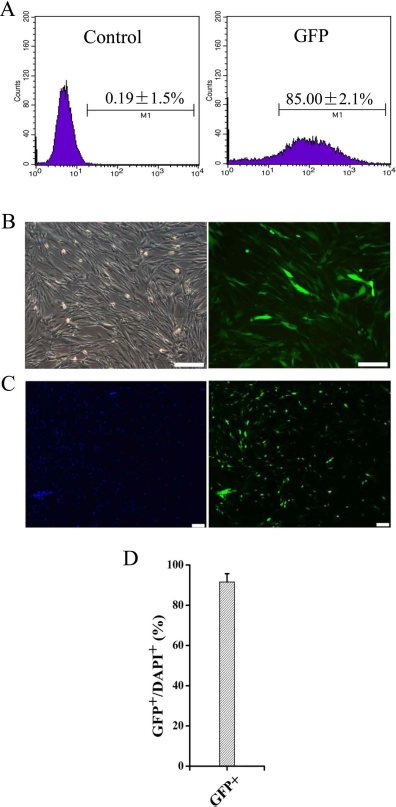
Efficient transduction of HF-MSCs with a lentivirus encoding the human insulin gene. (A) Flow cytometric analysis of transduced human In-HF-MSCs. (B) Bright field and fluorescence imaging of transduced In-HF-MSCs. Transduced cells expressed GFP (green). (C) Cells were imaged using live-cell microscopy imaging systems after FACS. Cell nuclei were stained with DAPI (blue). (D) Quantification of GFP+/DAPI+ cells. Values are reported as the mean ± SD of triplicate samples of a representative experiment (n = 3). Scale bar: 200 μm.
We next determined whether the transduced HF-MSCs retained the MSC phenotype. The In-HF-MSCs differentiated into adipogenic and osteogenic lineages as efficiently as HF-MSCs (Fig. 3A–D). Immunofluorescence and flow cytometric analyses showed that In-HF-MSCs expressed CD44, CD73, CD90, and CD105, but were negative for CD31, CD34, and CD45 (Fig. 3E, F). The G-HF-MSCs differentiated into adipogenic and osteogenic lineages as efficiently as HF-MSCs (Fig. 4A–D). Immunofluorescence and flow cytometric analyses showed that G-HF-MSCs expressed CD44, CD73, CD90, and CD105, but were negative for CD31, CD34, and CD45 (Fig. 4E, F). These results indicated that the In-HF-MSCs and G-HE-MSCs retained the MSC phenotype.
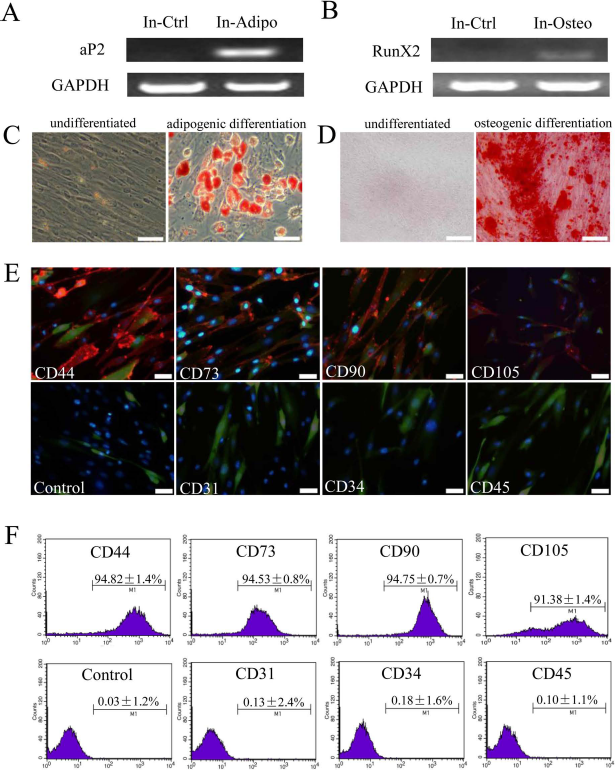
Characterization of transduced In-HF-MSCs. Potential of In-HF-MSCs (passage 2) to differentiate into adipocytes and osteoblasts. PCR analysis of the adipogenic marker aP2 (A) and osteogenic marker RunX2 (B). (C) Oil Red O staining of undifferentiated HF-MSCs and HF-MSCs differentiated into adipocytes. (D) Alizarin Red S staining of undifferentiated HF-MSCs and HF-MSCs differentiated into osteocytes. (E, F) Immunofluorescence and flow cytometric analysis of cell surface markers of transduced HF-MSCs (passage 2). Cells stained with only Alexa Fluor® 555-conjugated secondary antibody served as negative control. All samples were counterstained with Hoechst (blue) to identify nuclei. Transduced cells expressed GFP (green). Values are reported as the mean ± SD of triplicate samples of a representative experiment (n = 3). In, In-HF-MSCs; Ctrl, control; Adipo, adipogenic; Osteo, osteogenic. Scale bar: 50 μm.
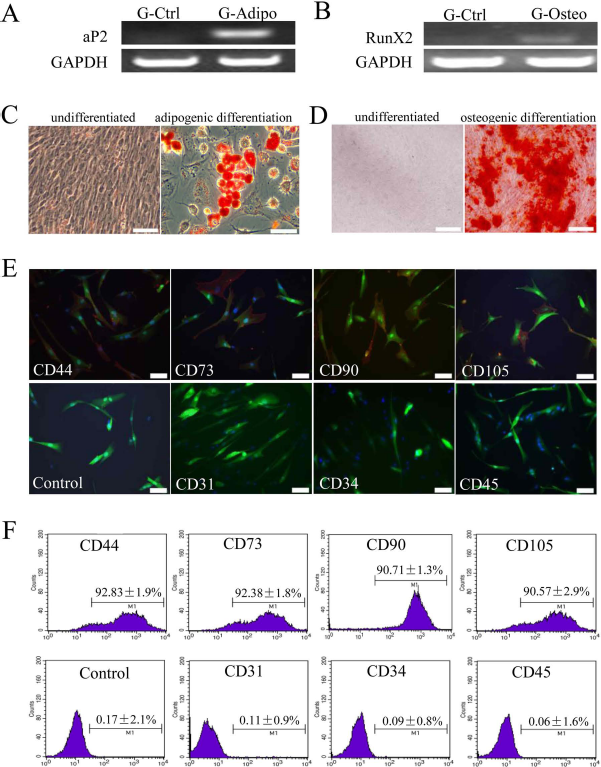
Characterization of transduced G-HF-MSCs. Potential of GFP-expressing HF-MSCs (G-HF-MSCs; passage 2) to differentiate into adipocytes and osteoblasts. PCR analysis of the adipogenic marker aP2 (A) and osteogenic marker RunX2 (B). (C) Oil Red O staining of undifferentiated HF-MSCs and HF-MSCs differentiated into adipocytes. (D) Alizarin Red S staining of undifferentiated HF-MSCs and HF-MSCs differentiated into osteocytes. (E, F) Immunofluorescence and flow cytometric analysis of cell surface markers of transduced HF-MSCs (passage 2). Cells stained with only Alexa Fluor® 555-conjugated secondary antibody served as negative control. All samples were counterstained with Hoechst (blue) to identify nuclei. Transduced cells expressed GFP (green). Values are reported as the mean ± SD of triplicate samples of a representative experiment (n = 3). G, G-HF-MSCs; Ctrl, control; Adipo, adipogenic; Osteo, osteogenic. Scale bar: 50 μm.
In Vitro Release of Insulin From In-HF-MSCs in Response to Rapamycin
Treating In-HF-MSCs with 5 μM of rapamycin induced the release of C-peptide, which accumulated in the culture supernatant, and its concentration (5.6 ng/ml) reached a plateau in 10 h (Fig. 5A). The amount of insulin at each time was calculated by subtracting the C-peptide values from the value determined at the subsequent time, and the data show that the maximum release of human insulin occurred 4 h after treatment with rapamycin (Fig. 5B). The release of human insulin increased as a function of rapamycin concentration (1 μM to 5 μM) and decreased when the rapamycin concentration was greater than 5 μM (Fig. 5C). In contrast, human insulin was not detected in culture fluids of G-HF-MSCs treated with rapamycin.
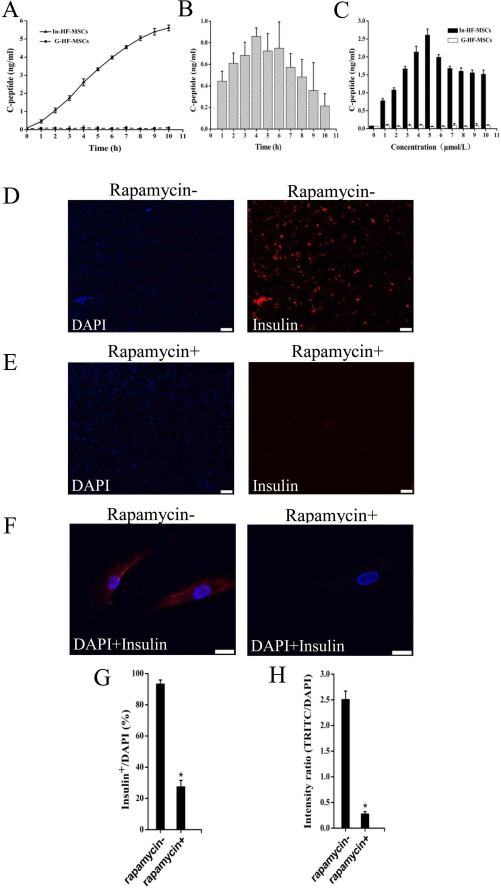
Insulin release from In-HF-MSCs in response to rapamycin treatment. (A) In-HF-MSCs and G-HF-MSCs were treated with 5 μM rapamycin at the indicated times, human insulin accumulated and was detected in the culture supernatant. Conditioned media were harvested, and C-peptide levels were determined using an ELISA. (B) Analysis of responses over time showed that maximum release of human insulin occurred 4 h after treatment with rapamycin. (C) In-HF-MSCs and G-HF-MSCs were treated with the indicated concentration of rapamycin for 4 h, conditioned media were harvested, and C-peptide levels were determined using an ELISA. (D, E) Live-cell microscopy image analysis of cells stained with an anti-insulin antibody. Insulin+ cells (red) were detected only in the group not treated with rapamycin. Cell nuclei were stained with DAPI (blue). (F) Confocal microscopic analysis of detection of insulin (red) in In-HF-MSCs treated or not for 4 h with 5 μM rapamycin. Cell nuclei were stained with Hoechst 33342 (blue). (G) Quantification of Insulin+/DAPI+ cells. (H) Fluorescence intensities of tetrarhodamine isothiocyanate (TRITC)/ DAPI. Values are reported as the mean ± SD of triplicate samples in a representative experiment (n = 3). *p < 0.05. Scale bar: 200 μm (D, E), 20 μm (F).
To detect the levels of intracellular insulin, untreated or rapamycin-treated (5 μM, 4 h) In-HF-MSCs were incubated with an anti-human insulin antibody (Fig. 5D, E). The rapamycin-induced release of insulin was confirmed using confocal microscopy showing that insulin accumulation around the nucleus of In-HF-MSCs disappeared after rapamycin treatment (Fig. 5F). Live-cell microscopy revealed that rapamycin treatment caused a significant decrease in the percentage of insulin+/DAPI+ cells (27.5 ± 4.1% vs. 93.4 ± 2.5%, p < 0.05) and fluorescence intensities (0.28 ± 0.04% vs. 2.51 ± 0.16%, p < 0.05) (Fig. 5G, H).
The Effect of Engrafted In-HF-MSCs on Hyperglycemia in Mice with Type 1 Diabetes
To determine whether insulin released in response to rapamycin in vivo, diabetic BALB/cA-nu mice were injected subcutaneously with In-HF-MSCs or G-HF-MSCs (5 × 10⁶ cells per animal). Seven days after transplantation, all diabetic mice were fasted for 3 h and then treated with rapamycin administered by intraperitoneal injection (30 mg/kg). Human insulin and blood glucose levels were measured at the indicated times. Insulin was released into the blood and reached maximum levels (0.8 ng/ml) 1 h after rapamycin treatment (Fig. 6A). In contrast, human insulin was undetectable in the blood of diabetic mice implanted with G-HF-MSCs after treatment with rapamycin. Further, the increase in human insulin in mice implanted with In-HF-MSCs corresponded to the gradual decrease in blood glucose levels after rapamycin treatment. In contrast, blood glucose levels in diabetic mice implanted with G-HF-MSCs were not affected by rapamycin (Fig. 6B). The clearance of rapamycin from the body takes 4–5 days (32), so to avoid any potential accumulated toxicity occurring in the body, rapamycin was administered once per week between consecutive treatments.

Insulin secretion and physiological responses of diabetic mice to transplantation of In-HF-MSCs. Following implantation with saline (Sham), In-HF-MSCs and G-HF-MSCs diabetic mice were fasted for 3 h and then injected with rapamycin (30 mg/kg body weight). (A) Blood samples were collected from the In-HF-MSCs and G-HF-MSCs mice at the indicated times after administration of rapamycin, and plasma insulin was measured using an ELISA (n = 6). (B) Blood glucose levels of the In-HF-MSCs and G-HF-MSCs mice at the indicated times after administration of rapamycin (n = 6). (C) Mouse and human insulin in the sera of Normal and In-HF-MSCs mice (n = 6). (D) ANOVA showed significant changes in the blood glucose levels among Sham, G-HF-MSCs, and In-HF-MSCs groups (n = 12) (F = 106.03, p < 0.05 at 7 days posttransplantation; F = 546.22, p < 0.05 at 14 days posttransplantation; F = 1396.41, p < 0.05 at 21 days posttransplantation; F = 1250.37, p < 0.05 at 28 days posttransplantation). Bonferroni's post hoc analysis showed that the blood glucose levels of the In-HF-MSCs group were significantly lower than the other two groups (p < 0.05) at each individual time point. (E) ANOVA showed significant changes in the body weight levels among Sham, G-HF-MSCs, and In-HF-MSCs groups (n = 12) (F = 27.69, p < 0.05 at 7 days posttransplantation; F = 76.93, p < 0.05 at 14 days posttransplantation; F = 229.28, p < 0.05 at 21 days posttransplantation; F = 392.79, p < 0.05 at 28 days posttransplantation). Bonferroni's post hoc analysis showed that the body weight levels of In-HF-MSCs group were significantly higher than the other two groups (p < 0.05) at each individual time point. (F) Survival rate (n = 12), and (G) glucose tolerance test (n = 12) were determined in mice. Survival curves were prepared using the Kaplan–Meier method and analyzed for statistical significance using the Cox–Mantel test. All error bars are standard deviation (SD). *p < 0.05.
ELISA analysis showed that six randomly chosen diabetic mice contained a small amount of mouse insulin in their blood 60 days after transplantation of In-HF-MSCs. This may be accounted for because type 1 diabetes is caused by immune-mediated destruction of insulin-secreting islet β-cells in the pancreas, leading to absolute insulin deficiency (9). Although the level of human insulin released from implanted In-HF-MSCs was remarkably lower than the normal murine insulin level (Fig. 6C), the blood glucose level in diabetic mice implanted with In-HF-MSCs was dramatically reduced from 13.7 mM on day 7 to 5.8 mM on day 90, reaching normal blood glucose levels. In contrast, the blood glucose levels of diabetic mice implanted with G-HF-MSCs or without cells continuously increased, reaching 19.3 mM or 16.8 mM, respectively, at the end of the experiment. ANOVA indicated significant changes between the In-HF-MSC group and the other two groups (G-HF-MSC group and Sham group) at 7, 14, 21, and 28 days post-cell transplantation (p < 0.05) (Fig. 6D). Bonferroni post hoc test analysis confirmed that the levels of blood glucose in the In-HF-MSCs group were significantly lower than in the Sham or G-HF-MSC group (p < 0.05) at each individual time point.
All diabetic mice began to lose body weight as soon as diabetes mellitus developed, while animals regained body weight after implantation of In-HF-MSCs (Fig. 6E). The body weights of mice implanted with In-HF-MSCs reached those of the controls and survived for at least 90 days (Fig. 6F). In contrast, diabetic mice implanted with G-HF-MSCs or without cells lost weight and began to die as early as day 20, and none survived more than 40 days after diabetes developed. ANOVA indicated significant changes between the In-HF-MSC group and the other two groups (G-HF-MSC group and Sham group) at 7, 14, 21, and 28 days posttransplantation. Bonferroni post hoc test analysis confirmed that the levels of body weight in the In-HF-MSC group was significantly higher than in the Sham or G-HF-MSC group (p < 0.05) at each individual time point.
Further, glucose tolerance tests showed that the blood glucose levels of normal and diabetic mice implanted with In-HF-MSCs at day 50 spiked after 30 min and then dropped to initial levels within 120 min after administration of glucose (Fig. 6G). Taken together, these results demonstrate that engrafted In-HF-MSCs released insulin in response to rapamycin and ameliorated the symptoms of type 1 diabetes for 90 days.
In Vivo Imaging and Histology of In-HF-MSCs
We next used in vivo imaging to determine the survival of In-HF-MSCs in diabetic mice. The fluorescence intensity of In-HF-MSCs in diabetic mice gradually weakened with time, and no signal was detected on day 120 (Fig. 7). Consistent with these results, immunofluorescence analysis of human insulin showed that the In-HF-MSCs decreased with time and were not detectable at day 120 (Fig. 8A–D). We were unable to detect human cells in graft-bearing tissues at day 120, ruling out the possibility that the expression of the human insulin gene was inhibited (Fig. 8D). Moreover, histological analysis failed to detect the presence of tumors (Fig. 8A–D).

In vivo imaging of In-HF-MSCs. Representative fluorescence images of individual mice at different times after transplantation.
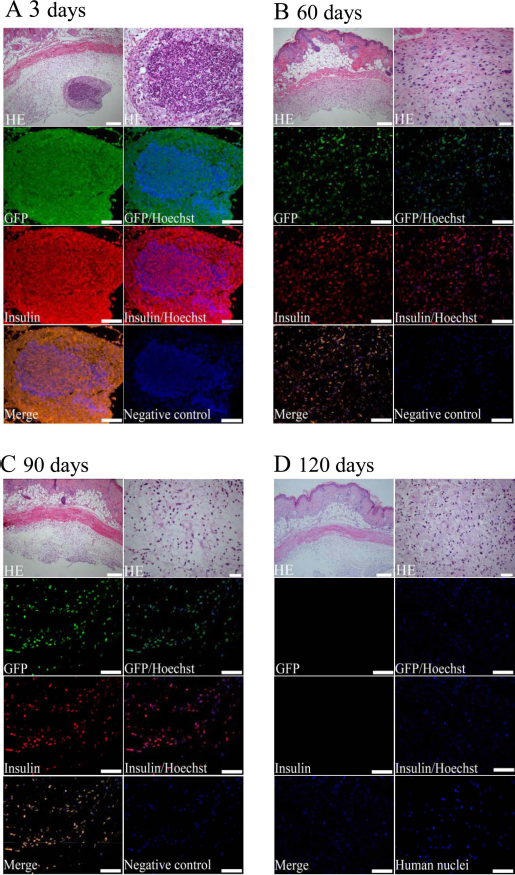
Mouse skin tissue harboring In-HF-MSCs that express human insulin over time. (A–D) At the indicated times after transplantation, skin tissue was excised from each animal and processed for histology. Paraffin-embedded tissue sections were stained with hematoxylin and eosin (H&E), immunostained for GFP (green), human insulin (red), and human nuclei (green). Cell nuclei were counterstained with Hoechst (blue). Cells stained with only Alexa Fluor® 555-conjugated and 488-conjugated secondary antibodies served as negative control. Scale bar: 100 μm, 20 μm (right of HE in A–D).
Discussion
In the present study, we genetically engineered HF-MSCs to overexpress the human insulin gene. When implanted into mice with STZ-induced type 1 diabetes and treated with rapamycin, the In-HF-MSCs released human insulin, dramatically reversed hyperglycemia, and significantly increased body weight to the same levels as normal mice. Therefore, our findings indicate that HF-MSCs show promise for cell-based gene therapy.
Gene therapy offers an approach for correcting hereditary or metabolic disorders (28), and its success relies largely on an effective and targeted gene delivery system (55). Lentiviral vectors offer advantages of low risk of inducing tumor formation, high transduction efficiency, and long-term expression of transgenes (8,10). We show that our lentiviral vector yielded a transduction efficiency of 85% for HF-MSCs.
Effective temporal control of gene expression is a crucial element of gene therapy (48), and various glucose-sensitive regulatory elements have been widely used to control insulin expression or its secretion from target cells in response to glucose concentrations (18,46,47). To mimic the physiological postprandial kinetics of insulin secretion to transiently correct hyperglycemia, a system was developed (33,39,40) that pharmacologically controls the rapid secretion of insulin in pulses, thus avoiding the slow time course of expression systems that rely on gene transcription in response to glucose (48) to mitigate impaired glucose tolerance or hypoglycemia (7). A small molecule such as rapamycin controls the activity of an engineered transcription factor that in turn regulates the expression of a therapeutic gene. This system has been successfully used to control the expression in mice of transgenes encoding hormones such as erythropoietin (54) and human growth hormone (41). Protein release from target cells can be controlled by fusing the protein of interest with a self-dimerization mutant of the FK506-binding protein (FM) and a furin recognition sequence. The resulting fusion protein aggregates and accumulates in the endoplasmic reticulum of cells expressing the gene of interest. The addition of the FM ligand (rapamycin) dissociates the aggregates, which subjects the protein (e.g., insulin) to cleavage by the ubiquitous protease furin, and the targeted protein is exported from the cell (40). Therefore, this system induces the release of a mature protein in response to a pharmacological agent such as a small molecule (e.g., rapamycin) (48).
In our experiments, the sequences encoding the fusion protein 3FM-hppI4-HD, which express proinsulin, were modified to include furin cleavage sites and cloned into a third-generation lentiviral vector with an internal ribosome entry site, and the gene encoding GFP was positioned downstream of the transgene. Using this system, we achieved rapid release of insulin in response to treatment with rapamycin. Thus, C-peptide and insulin were detected in the culture medium of In-HF-MSCs or in sera collected from diabetic mice engrafted with In-HF-MSCs (Figs. 5A and 6A).
Rapamycin causes insulin resistance (16,17), impairs insulin signaling (43), and induces glucose intolerance in mice by reducing islet mass, insulin content, and insulin sensitivity (52). Therefore, follow-up of recipients is required in a clinical setting to detect the side effects of rapamycin, and we anticipate that rapamycin analogs with fewer side effects will be developed in the future as substitutes for rapamycin. We note that direct intramuscular (31) or hepatic (35) injections of a lentivirus-insulin vector in STZ-treated rats decreases the severity of hyperglycemia and increases the survival of diabetic animals. Although these studies suggest that lentiviral gene transfer can be used to treat type 1 diabetes, they were not designed to regulate the delivery of insulin.
Cells derived from various sources are used to express transgenes whose products target specific tissues (55). Keratinocytes can be easily harvested, so they are attractive for use in cell-based gene therapy (22,48). However, the isolation of keratinocytes from skin may injure the donor (23) and therefore may not be appropriate for patients with diabetes or hemophilia. To address this problem, MSCs were engineered to secrete a variety of different proteins in vitro and in vivo to potentially treat infectious diseases and tumors (34). For example, rhesus monkey MSCs transduced with lentiviral vectors in vitro maintain their capacity to differentiate. A critical property of MSCs is their intrinsic homing properties that enable them to repair and regenerate damaged or diseased tissues (3,20). We show here that genetically modified HF-MSCs release human insulin in vitro and in vivo and retain their MSC phenotype and differentiated into adipocytes and osteoblasts (Figs. 3 and 4), suggesting that they may release insulin to correct diabetes by restoring the function of pancreatic islets (44). Thus, gene therapy using stem cells may provide an effective treatment of diabetes (6) and free patients from repeated insulin injections (7). Transplanted keratinocytes express the transgene for several weeks in vivo and respond to multiple administrations of rapamycin by secreting bioactive insulin that reverses hyperglycemia in STZ-treated athymic mice (48). During treatment, several animals lost >20% of their body weight because of severe hyperglycemia and had to be sacrificed. This decreased the number of animals available for the second and third applications of rapamycin, and 6–8 weeks after the implantation these animals were sacrificed. To take full advantage of an easily accessible and abundant source of autologous HF-MSCs, we transduced HF-MSCs with a human insulin gene engineered to provide controlled release of human insulin. It is important to note that, although the diabetic mice became hyperglycemic again, lost weight, and began to die 90 days postimplantation of In-HF-MSCs, the recipients were healthy throughout the 90 days in our experiment.
We show here that, as expected, diabetic mice implanted with In-HF-MSCs that expressed human insulin in a sustained manner and released human insulin in response to cyclic administration rapamycin reversed hyperglycemia and increased body weight to the same levels as normal mice at day 90. Unexpectedly, the diabetic mice became hyperglycemic again, lost weight, and began to die 90 days postimplantation of In-HF-MSCs. Our inability to detect human cells in mouse skin at day 120 likely explains the relapse of diabetes. We used BALB/cA-nu mice, which lack functional T-cells, but not B-cells (12), and so we think that it is reasonable to assume that a B-cell-related immune response occurred that led to the rejection of the In-HF-MSCs. Other possible mechanisms such as apoptosis and autophagy caused by rapamycin may be involved (5), requiring further clarification. It is important to note that the In-HF-MSCs did not form detectable tumors during the experiment, suggesting that HF-MSCs may be used as target cells to safely deliver therapeutic gene products.
To the best of our knowledge, we are the first to use human HF-MSCs for controlled release of human insulin. We conclude that HF-MSCs show great promise in gene therapy of diabetes.
Footnotes
Acknowledgments
This study was supported by the Science and Technology Development Plan of the Office of Science and Technology Project of Jilin Province, China (20100947); the Major State Basic Research of China (973 program) (2011C B606200); the National Natural Science Foundation of China (30930026/C100101); the Science and Technology Development, Plan of the Office of Science and Technology Project of Jilin Province, China (20120935); the Frontier Interdiscipline Program of Norman Bethune Health Science Center of Jilin University (2013101007), and the Specialized Research Fund for the Doctoral Program of Higher Education (20130061110077). We thank William Orr (Department of Pathology, University of Manitoba, Canada) for help with revising the language of this manuscript. The authors declare no conflict of interest.