
Abstract
The amniotic epithelium consists of cells exhibiting mature epitelial cell characteristics, but also varying degrees of stemness. We tested the hypothesis that induction of epithelial-to-mesenchymal transition (EMT) in amniotic epitelial cells (AECs) derived from human placenta enhances their capacity to support the ischemic myocardium. In response to incubation with transforming growth factor-β1 (TGF-β1) protein, AECs lost their cobblestone morphology and acquired a fibroblastoid shape, associated with downregulation of E-cadherin, upregulation of N-cadherin, Akt phosphorylation, and intracellular periostin translocation. EMT—AECs displayed greatly enhanced mobility and secreted gelatinase activity compared with naive AECs. The surface presentation of CD105 and CD73 decreased, and RNA microarray analysis mirrored the loss of epithelial characteristics and transcriptional profile. Unmodified AECs and EMT—AECs were then injected intramyocardially in fully immunocompetent mice after permanent LAD ligation, and heart function was followed by MRI as well as 2D speckle tracking echocardiography after 4 weeks. EMT—AEC-treated infarct hearts displayed better global systolic function and improved longitudinal strain rate in the area of interest. Although no signals of human cells were detectable by histology, infarct size was smaller in EMT—AEC-treated hearts, associated with fewer TUNEL-positive cells and upregulation of periostin, while blood vessel density was increased in both ACE- and EMT—AEC-treated hearts. We conclude that EMT enhances the cardioprotective effects of human AECs.
Keywords
Introduction
Cell-based therapies may support myocardial regeneration processes, but autologous cell products have so far produced only very modest clinical results. One of the reasons appears to be age- and disease-related impairment of somatic stem cell function, and cell products from neonatal tissues may help overcome this problem. The placenta has long been recognized as a readily available source of juvenile cells that possess a number of typical stem cell properties (1). Both chorion and subepithelial layers of the amniotic membrane consist mainly of cells with a phenotype resembling that of multipotent stromal cells, but surface layer amniotic epithelial cells (AECs) represent a fundamentally different cell type. Derived from the inner cell mass, AECs are embryonic cells that may retain epiblast stem cell-like characteristics and in vitro trilineage differentiation capacity because they have not directly been subjected to differentiation signals throughout organogenesis (12,22). However, they clearly possess many phenotypic characteristics of mature epithelial cells including expression of cytokeratin and formation of intercellular tight junctions, seal the amniotic cavity, and help maintain the composition of the amniotic fluid. AECs have been suggested to be useful for cellular therapy in the context of cardiovascular regeneration, but it is unclear whether this requires actual stemness or pluripotency-unrelated (i.e., secretory) mechanisms (7). Epithelial-to-mesenchymal transition (EMT) plays a role in embyrogenesis and in tumor metastasis and involves increased mobility of epithelial cells and modulation of extracellular matrix, phenomena that might be helpful for cell-based regeneration processes (2,11,16,19,31). We therefore assumed that, by forcing AECs to undergo EMT, their myocardial regeneration capacity could be augmented and tested this hypothesis in vitro as well as in a mouse model of myocardial infarction.
Materials and Methods
The study was done in accordance with the Declaration of Helsinki, with approval of the ethics committee of Charité University Medicine Berlin and Seoul National University. Full-term human placentas were obtained from healthy donors who gave informed consent for using the material for research purposes.
Culture of Human Amniotic Epithelial Cells
Human AECs were isolated and cultured as previously described (21,30). Nine placentas from five female and four male neonates were used for the study. Briefly, the amnion was peeled off the placenta and washed with Hank's balanced salt solution (HBSS; Invitrogen, Carlsbad, CA, USA). It was then incubated in HBSS containing 10 mM dithiothreitol (Invitrogen) for 30 min and chopped into small pieces, followed by incubation in Dulbecco's modified Eagle medium (Invitrogen) containing 0.05 trypsin-ethylenediaminetetraacetic acid (Invitrogen) for 60 min at 37°C. After incubation, the tissue was vortexed for 1 min and filtered first through a 1-mm mesh (Spectrum Laboratories, Rancho Dominguez, CA, USA), followed by a second filtration with a 100-μm cell strainer (Becton Dickinson, Franklin Lakes, NJ, USA). The filtrate was centrifuged, washed with HBSS, and cultured in AEC media containing 10 ng/ml epidermal growth factor (EGF) (RAEM; RNL BIO, Seoul, South Korea) overnight at 37°C, 5% CO2 with 10% fetal bovine serum (FBS; Invitrogen). After 24 h, nonadherent cells were removed by washing with phosphate-buffered saline (PBS) containing calcium and magnesium (Gibco/Life Technologies, Carlsbad, CA, USA). The cell medium was changed to fresh RAEM containing 10% FBS and maintained for 4—5 days until confluent (passage 0). For storage, cells were trypsinized using TrypLE (Invitrogen), washed, and frozen in liquid nitrogen with 10% dimethyl sulfoxide (Carl Roth, Karlsruhe, Germany) added. Prior to experimental use, cells were thawed, washed, and plated on T75 or T25 cell culture flasks (Nunc; Thermo Scientific, Wiesbaden, Germany) for expansion at a seeding density of 100,000 cells/cm2 and incubated in a humidified cell culture incubator at 5% CO2 and 37°C in RAEM. At 100% confluency, cells were trypsinized for 12—15 min. Homogeneity of AECs in culture was confirmed by immunostaining for cytokeratin (BD Biosciences, Heidelberg, Germany) (Fig. 1, inset; for methods see below).

Representative photomicrographs of AECs undergoing EMT mediated by TGF-β1. Changes in cell morphology over a period of 6 days as observed in bright field (scale bar: 200 μm). Inset: Expression of pan-cytokeratin (pan-CK) in AECs as assessed by immunofluorescence. Nuclear staining by DAPI in blue.
Induction of Epithelial-to-Mesenchymal Transition (EMT)
AECs were cultured to 90% confluency and treated with 25 ng/ml transforming growth factor-β1 (TGF-β1; Invitrogen) for 6 days. Cells were monitored for morphological changes every 24 h by light microscopy (Carl Zeiss, Oberkochen, Germany).
Scratch Wound Healing Assay
In AEC culture plates, two perpendicular scratches were made using a 200-μl pipette tip (Eppendorf, Hamburg, Germany). The cell surface was washed three times with PBS to remove floating cell debris along the edges of the scratch. Cell culture medium with TGF-β1 or without (control) was added to the cells and incubated at 37°C with 5% CO2. Cells were observed every 2 h for 24 h for changes in migration pattern by light microscopy.
Transwell Migration Assay
Transwell inserts with 8-μm pore size in a 24-well format (Corning, Corning, NY, USA) were used for the assay. First, 800 μl of cell culture medium, with and without TGF-β1, was added to the plate well along with the Transwell insert and placed in the incubator 30 min prior to the addition of the cells, to achieve equilibrium of the cell culture medium between the plate well and the insert. AECs were then seeded onto the inserts with or without TGF-β1. Assays were done in duplicate with Transwell inserts being examined on the third and the fifth day. For quantification, cells were fixed with 4% paraformaldehyde (PFA; Carl Roth) and stained using 0.1% crystal violet solution (Carl Roth). Cells in the lower compartment were visualized using phase-contrast light microscopy.
Immunofluorescence
AECs were plated on a 96-well cell carrier plate (Perkin Elmer, Waltham, MA, USA) with and without TGF-β1. Following induction of EMT, cells were fixed using 4% PFA. Nonspecific binding was blocked using 5% normal goat serum (Chemicon, Temecula, CA, USA). Cells were incubated with anti-human E-cadherin (1:100; Abcam, Cambridge, UK), anti-human β-actin (1:200; Abcam), anti-human N-cadherin (20 μg/ml; Abcam), anti-human periostin (1:200; Acris Antibodies, Herford, Germany), and anti-human pan-cytokeratin (10 μg/ml; Abcam) primary antibody for 1 h at room temperature (RT). Anti-mouse secondary antibody conjugated to Alexa 488 (2 μg/ml; Molecular Probes, Eugene, OR, USA) for E-cadherin, pan-cytokeratin, and β-actin, or Alexa 555 (4 μg/ml; Molecular Probes) for N-cadherin and periostin was used for fluorescence detection. Nuclei were counterstained with 4′,6-diamidino-2-phenylindole (DAPI, 1 μg/ml; Molecular Probes). Images were acquired using the OPERETTA high content screener system (Perkin Elmer).
Western Blotting
Cells cultured with and without TGF-β1 were lysed using sodium dodecyl sulfate (SDS) lysis buffer (62.5 mM Tris, 2% SDS, 10% glycerol, pH 6.8; all components from Carl Roth) for protein isolation. Protein concentration was estimated using the bicinchoninic acid protein assay kit (Thermo Fisher Scientific, Waltham, MA, USA). Twenty-five micrograms of protein per well was loaded on a 10% polyacrylamide gel (Carl Roth). A semidry transfer system (Bio-Rad Laboratories, Hercules, CA, USA) was used to transfer the proteins onto a polyvinylidene fluoride membrane (Carl Roth). The membrane was incubated overnight at 4°C with antibodies against E-cadherin (1:1,500; Abcam), occludin (1 μg/ml; Abcam), Akt (0.05 μg/ml; Cell Signaling Technology, Beverly, MA, USA), phospho-Akt (0.05 μg/ml; Cell Signaling Technology), extracellular signal-regulated kinase 1/2 (Erk1/2; 0.05 μg/ml; Cell Signaling Technology), phospho-Erk1/2 (1 μg/ml; Cell Signaling Technology), and β-actin (1:10,000; Abcam). Then the membranes were washed, incubated with IRDye® 680LT-conjugated secondary antibodies (0.03 μg/ml; Li-Cor Biosciences, Bad Homburg, Germany) for Akt, Erk1/2, β-actin, and E-cadherin and with anti-rabbit IRDye 800CW-conjugated secondary antibody (0.06 μg/ml; Li-Cor Biosciences) for phospho-Akt, phospho-Erk1/2, and occludin for 1 h at room temperature (RT). Membranes were analyzed using the infrared imaging system and software Odyssey® from Li-Cor Biosciences.
Flow Cytometry
The immunophenotype of AECs and EMT—AECs was analyzed using a FACSAriaII (BD Biosciences, Franklin Lakes, NJ, USA) with BD FACSDiva software. Cells were incubated at 4°C using the following antibodies conjugated to fluorophores according to the manufacturers' instructions: cluster of differentiation 34 fluorescein isothiocyanate (CD34 FITC; 1:11), CD45 Vioblue (1:10), CD133 phycoerythrin (PE; 1:11) (all Miltenyi Biotec, Bergisch Gladbach, Germany), human leukocyte antigen-DR phycoerythrin cyanine 7 (HLA-DR PECy7; 0.5 μg/ml; BD Biosciences), CD14 allophycocyanin cyanine 7 (APCCy7; 1:100; Biolegend, San Diego, CA, USA), CD90 APC (1:100), CD73 PE (1:100), and CD105 FITC (1:100) (all e-bioscience, Frankfurt, Germany) followed by one washing step. Using FlowJo Software (Tree Star, Ashland, OR, USA), cells were gated in forward and side scatter, and dead cells were excluded based on DAPI staining (1 μg/ml). Gates for phenotypic markers were set according to unstained control samples (not shown).
Genechip Array Hybridization
Total RNA was isolated from cell lysates using the RNeasy mini kit (Qiagen, Hilden, Germany), quantified by UV-spectroscopy, and analyzed on a LabChip (BioAnalyzer; Agilent Technologies, Santa Clara, CA, USA). One to three micrograms from each sample was synthesized into double-stranded cDNA using SuperScript transcriptase II (Life Technologies) and with an oligo (dT)24 primer containing a T7 RNA polymerase promoter (TIBMOL Biol, Berlin, Germany). After RNAse H-mediated (Roche, Basel, Switzerland) second-strand cDNA synthesis, the product was purified and served as template in the subsequent in vitro transcription (IVT) reaction. Labeled complementary RNA (cRNA) was prepared from double-stranded cDNA by IVT using the GeneChip RNA transcript labeling kit (Affymetrix, Santa Clara, CA, USA). After cleanup, biotin-labeled cRNA was fragmented by alkaline treatment [40 mmol/L Trisacetate (pH 8.2) (Carl Roth), 100 mmol/L potassium acetate (Carl, Roth), and 50 mmol/L magnesium acetate (Carl Roth) at 94°C for 35 min]. Fifteen micrograms of each cRNA sample was hybridized for 16 h at 45°C to an Affymetrix Human GeneChip Array U133A 2.0. Chips were washed and stained with streptavidin—phycoerythrin (Life Technologies) using a fluidics station (Affymetrix). Finally, arrays were scanned at 1.56-μm resolution using the Affymetrix GeneChip System confocal scanner 3000. Raw data were analyzed with Affymetrix Operating Software (GCOS 1.2). For comparison between chips, the data were normalized to a global intensity of 500. A scatter plot was constructed using microarray data analysis software, Chipster (CSC-IT Center for Science, Espoo, Finland), and genes with a change of more than twofold were selected for constructing heat maps.
Cytokine Secretion Profile
AECs or EMT—AECs were cultured in RAEM containing bovine serum albumin (Sigma-Aldrich, Buchs SG, Switzerland) instead of fetal bovine serum for 6 days. The medium was removed, centrifuged, and the supernatant analyzed with the chemiluminescent Human Cytokine ELISA plate array (Signosis, Sunnyvale, CA, USA), which was used to detect proteins secreted by AECs and EMT—AECs according to the manufacturer's instructions. The assay was done in triplicate, and the difference in luminescence intensity between AECs and EMT—AECs was calculated in percentages with the blank value not subtracted.
Gelatin Zymography
AECs were plated in T25 cell culture flasks (Nunc) with and without TGF-β1. After induction of EMT, conditioned medium was collected from cell culture flasks and centrifuged at 1,000 rpm for 10 min. The concentrated supernatant was then run in a 10% Novex zymogram gel containing gelatin (Life Technologies). Cell-free medium was used as control. Gels were incubated in 1× zymogram renaturing buffer (Life Technologies) for 30 min at RT followed by equilibration in 1× zymogram developing buffer (Life Technologies) for 30 min RT with constant shaking. Gels were then processed overnight at 37°C in 1× zymogram developing buffer and stained using Coomassie brilliant blue (Thermo Fisher Scientific) staining solution followed by destaining. Band intensity was quantified using ImageJ imaging software (NIH, Bethesda, MD, USA).
Induction of Myocardial Infarction
The protocol, including surgery and all follow-up examinations, was approved by the Landesamt für Gesundheit und Soziales Berlin (State Office of Health and Social Affairs Berlin). Six- to 8-week-old wild-type male balb/c mice (Charles River, Sulzfeld, Germany) were sedated by intraperitoneal administration of a mixture of ketamine (50— 80 mg/kg or 1.5 mg/mouse; Serumwerk Bernburg AG, Bernburg, Germany) and xylazine (10—16 mg/kg or 0.3 mg/mouse; Bayer, Leverkusen, Germany). Anesthesia depth was considered adequate when there was no response to tactile stimuli and the hindlimb pedal withdrawal reflex provoked with metal forceps (Fehling Instruments, Karlstein, Germany) was absent. Mice were fixed in a supine position and intubated endotracheally using a 0.9-mm tube (B. Braun, Melsungen, Germany) connected to a Minivent volume-controlled animal ventilator (Harvard Apparatus, Holliston, MA, USA). Following a left anterolateral thoracotomy and removal of the pericardium, the left anterior descending artery (LAD) was ligated using a 7-0 polypropylene suture (Ethicon, Somerville, NJ, USA). Myocardial ischemia distal to the ligation was evident by the discoloration of the myocardium. One million AECs (n = 10) or EMT—AECs (n = 10) in 25 μl PBS or vehicle only (control, n = 10) were injected in five points in the peri-infarct area (5 μl each). The chest was closed, and the animals were allowed to recover. Six mice underwent a sham operation with thoracotomy but no manipulation of the heart. After surgery, mice were given Flunixin meglumine (2.5 mg/kg; Pharma Greven GmbH, Greven, Germany) subcutaneously every 12 h for 72 h for pain relief and were allowed to survive for 4 weeks.
Magnetic Resonance Imaging (MRI)
MRI was carried out on a whole-body 3.0 T MR system (Achieva; Philips Medical Systems, Best, Netherlands) equipped with a Quasar Dual gradient system (80 mT/m, 200 mT/m/ms slew rate) and a dedicated solenoid coil for mouse hearts. After induction of anesthesia by administering a mixture of ketamine (25—60 mg/kg or 0.75 mg/mouse) and xylazine (5—15 mg/kg or 0.15 mg/mouse), the animals were placed in a dedicated animal bed and positioned within the coil. After generation of survey images and of a long-axis set of cine images, a stack of left ventricular (LV) short-axis cine images was acquired (phases, 30; repetition time, 8.7 ms; echo time, 4.3 ms; flip angle, 15°; field of view, 40 mm; acquired voxel size, 0.3 × 0.3 × 1.5 mm; number of signal averages, 4; slices, 7; interslice gap adjusted to allow for coverage of the entire LV range, −0.5 to −0.2 mm). MR images were analyzed using the preclinical deviation version of a commercial software package (CMR42; Circle Cardiovascular Imaging Inc., Calgary, Canada). By delineating subendocardial and subepicardial contours of end-diastolic and end-systolic images, the following LV parameters were assessed according to Simpson's rule: end-diastolic volume, end-systolic volume, ejection fraction, and mass.
Echocardiography
Mice were sedated as described above. Sedation depth was considered adequate when there was delayed response to tactile stimuli and the anterior chest wall was shaved. Echocardiography was performed using a Vivid Seven digital ultrasound system with a Matrix 12-MHz linear probe (General Electrics, Horton, Norway). On 2D images, LV end-systolic and end-diastolic volume was determined by manual tracing, and LV ejection fraction was calculated accordingly. Strain rate analysis of the 2D echocardiography images to quantify the time course of tissue deformation was performed off-line with the aid of a customized software package (EchoPAC; General Electrics) using two consecutive cardiac cycles of acquired loops. This system allows analysis of peak systolic longitudinal strain rate based on detection of natural acoustic markers within the myocardium and an algorithm that follows the acoustic markers accurately during several consecutive frames (speckle tracking). The mean value of many individual strain rate data was used to compute instantaneous strain curves for predefined LV segments (anterior and inferior).
Histology
After echocardiography, mice were sacrificed by cervical dislocation, and hearts were excised, fixed in 4% PFA, and embedded in paraffin. Five-micrometer sections were prepared and mounted onto super frost glass slides (Thermo Scientific, Bonn, Germany) for histological analysis.
Infarct Size
Deparaffinized and rehydrated sections were stained with Masson's trichrome stain (Sigma-Aldrich) according to the manufacturer's protocol. The area of infarcted and noninfarcted myocardium was quantified using ImageJ imaging software. The percentage of infarcted myocardium was calculated in relation to the total area of the LV including the septum.
Blood Vessel Density
Antigens were unmasked by boiling sections in citrate buffer [10 mM citric acid (Carl Roth) and 0.05% Tween 20 (Carl Roth), pH 6.0] for 30 min. Endogenous peroxidase activity was inhibited by treating sections with 3% hydrogen peroxide (Carl Roth). After blocking with 5% goat serum (Chemicon) and 5% milk (Carl Roth), sections were incubated with anti-CD31 antibody (4 μg/ml; Santa Cruz Biotechnology, Santa Cruz, CA, USA) for 1 h at RT. This was followed by incubation with biotinylated anti-rabbit secondary antibody (3.75 μg/ml; Vector Laboratories, Burlingame, CA, USA) at RT. The secondary antibody was conjugated to horseradish peroxidase (Vector Laboratories), which was developed by diaminobenzidine (Carl Roth). Nuclei were counterstained with Meyer's hematoxylin (Carl Roth). Slides were analyzed with a light microscope. Mature blood vessels with distinct connective tissue, smooth muscle layer, and endothelium layer were counted separately based on Masson's trichrome and CD31 staining.
TUNEL Staining
Apoptotic cells were detected in deparaffinized sections by end labeling of fragmented DNA using the DeadEnd™ Colorimetic terminal deoxynucleotidyl transferase dUTP nick-end labeling (TUNEL) System (Promega, Fitchburg, WI, USA) according to the manufacturer's instructions. Counterstaining of all nuclei was done with DAPI, and myocardial histoarchitecture was visualized by caveolin-1 (1:100; Acris Antibodies) staining. Using MetaMorph software (Molecular Devices, Sunnyvale, CA, USA), TUNEL+ and DAPI+ nuclei were counted, and the frequency of apoptotic cells expressed as per 10,000 nuclei.
Periostin Expression
Following deparaffinization and rehydration, antigens were unmasked by boiling slides in target retrieval solution (Dako, Hamburg, Germany) for 30 min. Following blocking with 5% normal goat serum (Chemicon), sections were incubated with anti-periostin antibody (1:200; Acris Antibodies) for 1 h at RT. Secondary anti-rabbit antibody conjugated to Alexa fluor 647 (4 μg/ml; Molecular Probes) was used for visualization by fluorescence microscopy (Nikon Eclipse Ti-U; Nikon, Düsseldorf, Germany). Nuclei were counterstained with DAPI (1 μg/ml).
Detection of Transplanted Cells
Deparaffinized paraffin sections were incubated with mouse anti-human nuclear antigen (hNuc) primary antibody (1:50; Chemicon) followed by incubation with goat anti-mouse Alexa 647 (4 μg/ml; Molecular Probes)-conjugated secondary antibody. Nuclei were counterstained with DAPI, and sections and cells were analyzed by fluorescence microscopy. CRL-2429™ fibroblasts from human foreskin (LGC Standards, Wesel, Germany) were used as the positive control.
Statistics
Statistical analysis was performed using IBM SPSS statistics 20 (Armonk, NY, USA). Data with normal distribution are expressed as mean ± SEM. Intergroup differences between more than two groups were analyzed by one-way ANOVA with Bonferroni's (equal variance given) or Dunnett's T3 (unequal variance) post hoc test. If indicated, data between two groups were compared using two-tailed, unpaired Students's t-test. Hemodynamic data are expressed as median and range, and the Kruskal—Wallis test with pairwise comparison by Mann—Whitney U-test, and Bonferroni correction was used for intergroup comparison of the data distribution. A value of p < 0.05 was considered statistically significant.
Results
In Vitro Experiments
Cell Morphology
Upon exposure to TGF-β1, AECs underwent a dramatic change in morphology (Fig. 1). The typical cobblestone morphology of epithelial cells, characterized by tight junctions, was disrupted, and cells displayed a spindle-like, fibroblastoid shape. An increase in cell size was also observed through the course of the transition. The morphologic transition of AECs undergoing EMT was completed within 6 days.
Surface Marker Expression
The results of the FACS analysis of several typical surface antigens are summarized in Table 1. AECs were negative for all hematopoietic lineage markers (CD45, CD34, CD133, and CD14) but were positive for stemness-associated surface markers CD90, CD105, and CD73. Upon completion of EMT under the influence of TGF-β1, CD90 surface presentation remained unchanged, CD105 nearly completely disappeared, and CD73 was markedly reduced but still present on 33% of the EMT-AECs.
Surface Marker Expression in AECs and EMT—AECs as Assessed by Flow Cytometry

AECs and EMT—AECs were negative for CD34, CD45, CD133, CD14, and HLA-DR. Upon induction of EMT, the percentage of CD90-positive cells remained unchanged, whereas populations expressing CD73 and CD105 drastically changed. CD, cluster of differentiation; HLA, human leukocyte antigen.
Immunofluorescence
N-cadherin was expressed at very low levels on the surface of naive epithelial cells. After TGF-β1 treatment, the expression of N-cadherin increased and was highest upon completion of EMT with cells acquiring a fibroblast-like morphology (Fig. 2A, B). In contrast, unstimulated epithelial cells displayed the typical surface expression of E-cadherin localized at cell junctions, but expression levels were significantly reduced with the progression of EMT (Fig. 2C, D). Upon induction of EMT, periostin immunostaining indicated a translocation from perinuclear to a diffuse cytoplasmic distribution (Fig. 2E, F). Immunostaining for β-actin demonstrated the rearrangement of the cytoskeleton consistent with EMT (Fig. 2G, H).

Protein expression of AECs and AECs undergoing EMT. Protein expression of (A, B) N-cadherin, (C, D) E-cadherin, (E, F) periostin, and (G, H) β-actin as assessed by immunofluorescence (A—H) and by Western blot (I). (A, C, E, G) Untreated AECs. AECs expressed very low levels of N-cadherin and a typical junctional localization of E-cadherin. (B, D, F, H) Cells treated with TGF-β1 (EMT—AEC). EMT—AECs displayed an increased expression of N-cadherin and a loss of E-cadherin expression with the progression of EMT (original magnification 20×, scale bar: 50 μm). (I) Western blots of selected proteins involved in EMT. Erk1/2, extracellular signal-regulated kinases 1/2; p, phosphorylated.
Western Blot
Several EMT-relevant proteins were also studied by Western blotting (Fig. 2I). As seen by immunocytology, E-cadherin expression clearly decreased upon EMT. The loss of epithelial morphology was also associated with reduced expression of the junctional protein occludin. The phosphoinositide 3 (PI3)/Akt pathway and activation of Erk1/2 have been shown to play a role in EMT (2). Expression of Akt was similar in AECs and EMT—AECs, but Akt phosphorylation was clearly increased upon EMT. Total ERK1/2 protein increased upon EMT induction, while phosphorlated Erk1/2 remained unchanged. This differential regulation may be explained by the combined effects of added TGF-β1 and EGF that is present in the RAEM (5,9).
Microarray Analysis
Global RNA expression profiling showed that some 700 genes were differentially expressed in AECs upon EMT (Fig. 3). Of note, functional annotation and principle component analysis revealed that EMT induced activation of signaling cascades associated with TGF-β1 signaling (i.e., Mothers Against Decapentaplegic Homolog 6/7; SMAD 6/7), regulation of the actin cytoskeleton, focal adhesion, and cell—matrix interactions. On the other hand, cell cycle-related genes (i.e., cyclin A, B, and D) were predominantly expressed in naive AECs.
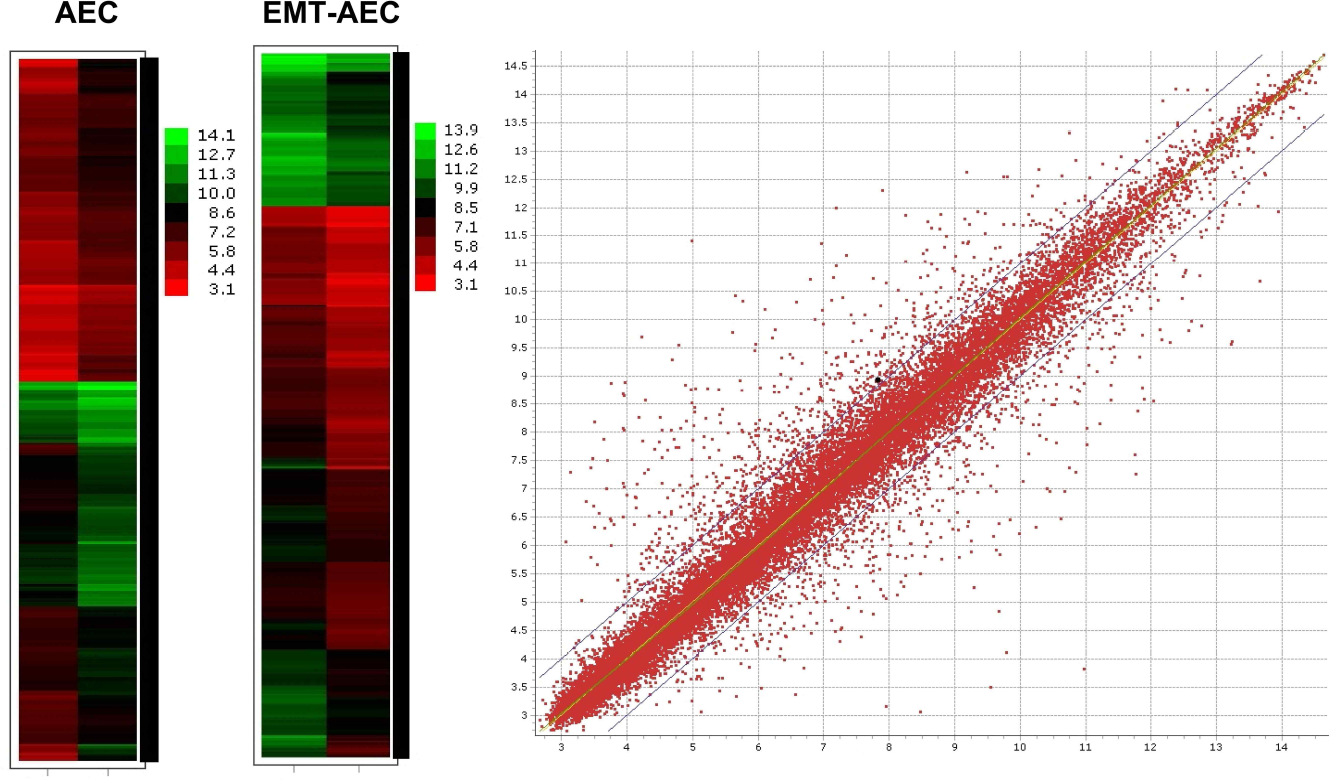
Gene expression of AECs and EMT—AECs. Left, heat maps indicating genes with more than twofold change in differential expression. Right, gene expression scatter plot of log intensities for naive amniotic epithelial cells compared to amniotic epithelial cells after EMT, thresholds set for twofold change in differential expression.
Cell Mobility
In the scratch wound healing assay, naive AECs maintained their epithelial confluence and narrowed the scratch wound only slightly during the observation period (Fig. 4, upper panel). In contrast, EMT—AECs abandoned the confluent monolayer and rapidly migrated into the scratch wound as single cells and in multidirectional fashion. In the Transwell migration assay, the change in morphology of cells plated on the Transwell inserts and treated with TGF-β1 was consistent with that of standard cell culture flask surface conditions (Fig. 4, lower panel). During the observation period, only EMT—AECs migrated through the membrane pores and were found in the lower compartment.
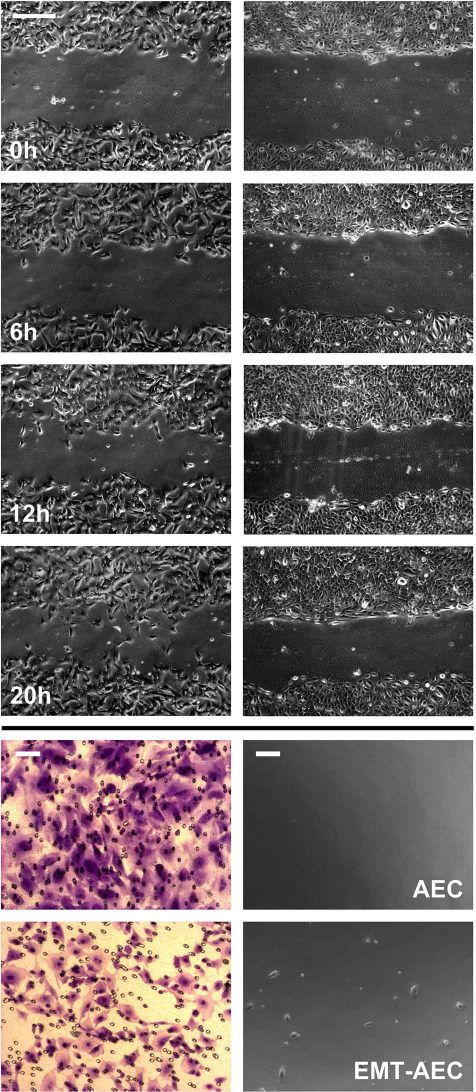
Migration pattern of AECs and EMT—AECs. Upper panel: Migration pattern of AECs depicted after (left) and before treatment with TGF-β1 (right). Naive AECs show a controlled unidirectional migration, while EMT—AECs display a random multidirectional movement (original magnification 10×, scale bar: 200 μm). Lower panel: Cell morphology on the Transwell insert as depicted by crystal violet staining (left); and migrated cells that attached on the surface of the cell culture plate well (right) (scale bar: 50 μm).
Cytokine Secretion Profile
The difference in cytokine and growth factor secretion between AECs and EMT—AECs is illustrated in Figure 5. The most obvious differences related to a significant increase in interleukin 8 (IL-8), 10-kDa interferon-γ-induced protein (IP-10), IL-1a, interferon-γ (IFN-γ), fibroblast growth factor-β (FGF-β), β-nerve growth factor (β-NGF), and a decrease in IL-10 and IL-6 associated with EMT. Of note, with respect to our findings regarding angiogenesis (see below), vascular endothelial growth factor (VEGF) secretion did not change.

Cytokine secretion profile given as the percentage difference of cytokines in the cell culture medium between EMT—AECs and naive AECs. The solid red line depicts 100%, that is, no difference in cytokine concentration. The p values were computed by unpaired t-test comparing AEC and EMT—AEC media for each individual cytokine.
Gelatinase Activity
Zymography of AEC or EMT—AEC-conditioned medium showed that secreted gelatinase activity was higher in EMT—AEC medium than in naive AEC medium. However, AEC medium still had a higher activity than cell-free control medium (Fig. 6).

Gelatinase activity by zymography. Gelatinase activity exhibited by (A) EMT—AECs, (B) AECs, (C) cell-free control medium. (D) Densitometry data summarizing total gelatinase activity in the experimental groups. Mean and standard error are given, and the p values are based on ANOVA with Bonferroni's post hoc analysis.
In Vivo Experiments
Survival
A total of eight animals (AEC n = 5, EMT—AEC n = 1, PBS control n = 2) did not recover from the operation and/or myocardial infarction and died on the day of surgery (early mortality = 19%). There were no late deaths during the 4-week observation period.
Heart Function
As measured by transthoracic echocardiography and shown in Figure 7A, global LV function expressed as left ventricular ejection fraction (LVEF) was best preserved in animals that received EMT—AECs [LVEF, 57% (43—77%); p < 0.001], while transplantation of naive AECs did not result in a significantly higher LVEF [43% (35—54%)] than that in control infarct hearts [33% (28—41%)]. For comparison, sham-operated animals had a median LVEF of 70% (59—78%). Speckle tracking echocardiography confirmed these results because the systolic strain rate in the area of interest was maintained best in EMT—AEC-treated infarct tissue [AEC 29 (21—46); EMT—AEC 45 (36—58); infarct control 23 (4—37); and sham 54 (50—59); p < 0.001 (Fig. 7B)]. By cardiac MRI, we also observed that LV function was best preserved in EMT—AEC-treated hearts [LVEF: AEC 32% (23—42%); EMT—AEC 44% (39—49%); infarct control 27% (17—36%); and sham 60% (48—64%); p < 0.001 (Fig. 7C)]. Among the animals that underwent myocardial infarction, cardiac output was lowest in PBS-treated control hearts (p = 0.001) (Fig. 7D), and those animals also required the highest heart rate to maintain adequate hemodynamics (p = 0.009) (Fig. 7E).
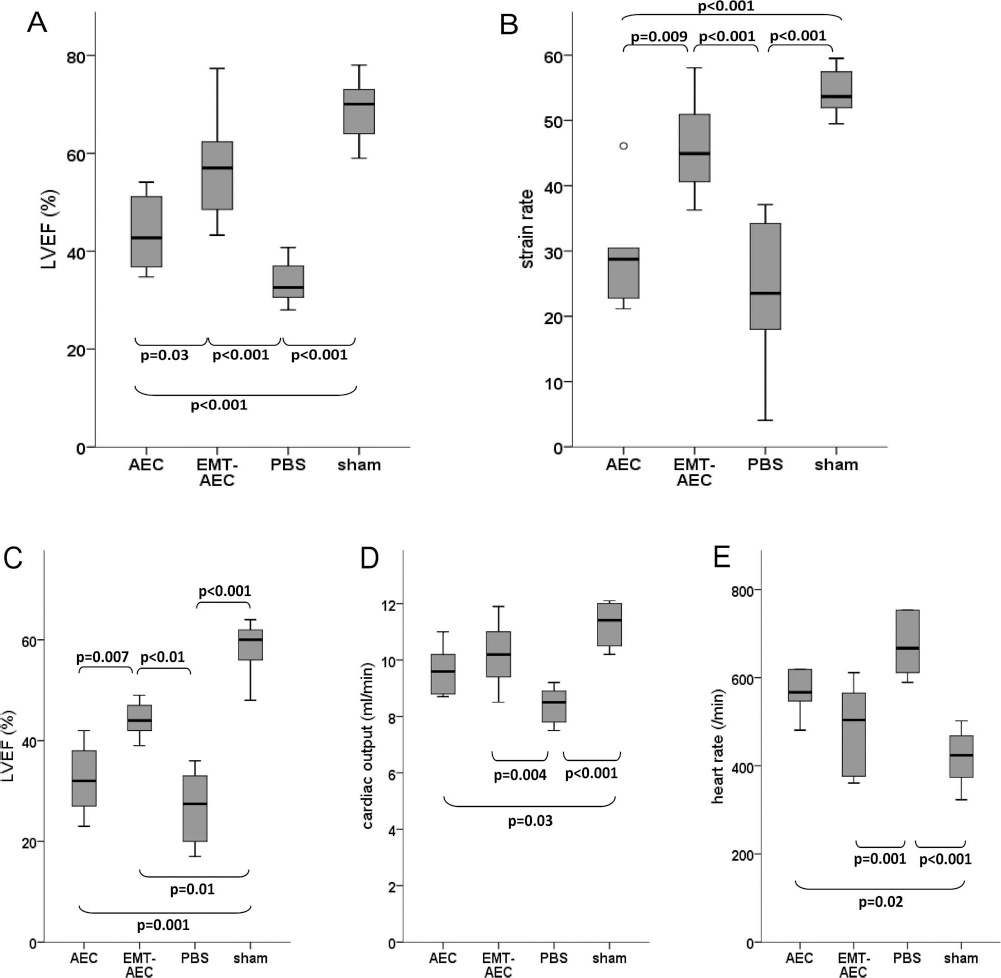
Heart function measured by transthoracic echocardiography (A, B) (AEC n = 5; EMT-AEC n = 9; PBS n = 8; sham n = 6) and cardiac MRI (C—E) (AEC n = 4; EMT-AEC n = 5; PBS n = 5; sham n = 5). By echocardiography, global systolic LV function expressed as LVEF (A) was highest in EMT—AEC-treated mice, as was the rate of myocardial deformation (strain rate) (B). By cardiac MRI, LVEF was also highest in EMT—AEC-treated hearts (C), and cardiac output was maintained in PBS control hearts via a higher heart rate (D, E). The omnibus Kruskal—Wallis test was used for comparison of the data distribution, and the individual intergroup p values refer to the post hoc pairwise comparison (Mann—Whitney U-test with Bonferroni correction). Only p values indicating significant differences are given. Box plots indicate median, interquartile interval, and range.
Infarct Size
As expected, permanent occlusion of the LAD resulted in transmural anterior myocardial infarction. As shown in Figure 8, infarct size was greatest in PBS-treated control hearts (14 ± 2%) and smallest in EMT—AEC-treated hearts (3.2 ± 2%), with the exception of sham-operated hearts (p < 0.01 vs. AEC and vs. PBS control). Hearts treated with unmodified AECs seemed to have smaller infarcts than PBS control hearts (10.6 ± 2%), but the statistical analysis indicated merely a trend (p = 0.1 by post hoc Bonferroni correction).

Representative photomicrographs of heart sections from apex to the base (left to right) after Masson's trichrome staining (AEC n = 5; EMT-AEC n = 9; PBS n = 8; sham n = 6). (A) AEC-treated heart. (B) EMT—AEC-treated heart. (C) Control heart with PBS injection. (D) Normal sham control heart (original magnification 2×). (E) Infarct size quantified by computerized planimetry on Masson's trichrome-stained hearts. The percentage of infarcted myocardium was calculated in six sections per heart and is shown as mean and standard error. The p values were computed by ANOVA with Bonferroni's post hoc analysis.
TUNEL Staining
In line with the findings regarding infarct size, the number of apoptotic nuclei were found to be significantly reduced in hearts that were treated with AECs at the time of infarction and was even lower in response to EMT—AEC transplantation (TUNEL+/ 10.000 nuclei: AEC, 6.2 ± 1.5; EMT—AEC, 3.8 ± 1.2; control, 12.4 ± 3.5; sham, 0.8 ± 0.2; p = 0.001) (Fig. 9).

Apoptosis quantified in myocardial sections by TUNEL staining (AEC n = 5; EMT-AEC n = 9; PBS n = 8; sham n = 6). TUNEL+ cells were found to be highest in PBS-treated control hearts. EMT—AEC-treated hearts were observed to have the least TUNEL+ cells/10,000 nuclei. Mean and standard error are given, and the p values were computed by ANOVA with Bonferroni's post hoc analysis (scale bar: 100 μm). Inset shows TUNEL and caveolin staining with DAPI nuclear labeling.
Cardiac Extracellular Matrix Remodeling
The matricellular protein periostin was not detectable by immunofluorescence in noninfarcted, sham-operated hearts. Myocardial infarction, however, led to a marked periostin expression that could be detected in all segments of the heart. Periostin protein was mainly located in the extracellular matrix and was particularly pronounced in the peri-infarct area. Upon semiquantification of immunohistology images, we found the highest level of periostin expression in hearts treated with EMT—AECs (Fig. 10).

Expression of matricellular protein periostin in infarcted myocardium (AEC n = 5; EMT-AEC n = 9; PBS n = 8; sham n = 6). Periostin was expressed primarily in the peri-infarct and infarcted myocardium. The protein was found to be highest in EMT—AEC-treated hearts (B), followed by PBS-injected control hearts (C) and the least in AEC-treated hearts (A). Periostin was completely absent in sham-operated hearts (D) (original magnification 20×, scale bar: 50 μm).
Arteriogenesis
In order to assess an increase in diameter of preexisting arterial vessels (arteriogenesis), epicardial arteries with typical three-layered wall structure were counted, and their size was quantified on Masson's trichrome stained histology slides (Fig. 11). Only vessels with distinct endothelium, tunica media (smooth muscle cell layer, red), and tunica adventitia (blue) were counted. In addition, the same measurement was performed on immunohistology slides stained for the endothelial cell marker CD31. The number of large vessels was higher in infarcted hearts treated with AECs (AEC, 6.4 ± 0.4 vs. PBS, 4.2 ± 0.64, p = 0.03) or EMT—AECs (EMT—AEC, 6.6 ± 0.41, p = 0.007), but there was no difference between these two groups. Similarly, the vessel diameter tended to be higher in AEC- and EMT—AEC-treated hearts than in controls.

Representative images of vasculature in the LV (AEC n = 5; EMT-AEC n = 9; PBS n = 8; sham n = 6). Microvessel density in the left ventricle represented by cluster of differentiation 31 (CD31) immunostaining in (A) AEC-treated group, (D) EMT—AEC-treated group, (G) PBS-treated group, (J) sham-operated group (original magnification 40×, scale bar: 100 μm); mature blood vessels identified by Masson's trichrome staining and CD31 immunostaining in (B, C) AEC-treated hearts, (E, F) EMT—AEC-treated hearts, (H, I) PBS control hearts, and (K, L) sham hearts. (M) Bar graphs representing the average number of arterial blood vessels in the LV across various experimental groups. The number of blood vessels in the LV was found to be higher in the cell-treated groups than the control groups. (B, E, H, K) (original magnification 40×, scale bar: 100 μm). (C, F, I, L) (original magnification 20×, scale bar: 200 μm). (N), Number of microvessels/high power field. Mean and standard error are given, and p values were computed by ANOVA with Bonferroni's post hoc analysis.
Microvessel Density
As expected, myocardial infarction induced angiogenesis processes in infarcted hearts, and both AEC- and EMT—AEC-treated hearts had more microvessels than sham-operated or infarcted control hearts as determined by immunohistochemistry for CD31 (Fig. 11N). Especially in the infarct border zone, microvessels appeared more prominent in AEC- or EMT—AEC-treated hearts than in controls (EMT—AEC, 12.5 ± 0.87; AEC, 12.1 ± 1.1; PBS, 8.5 ± 0.85; p = 0.01). However, there was no difference in the quantity or quality of microvessels between hearts treated with naive AECs and those treated with EMT—AECs.
AEC Retention
Four weeks after transplantation, surviving hNuc+ cells could not be detected in hearts treated with AECs or EMT—AECs (Fig. 12).

LV myocardium stained for human nuclear antigen (hNuc) and DAPI. Mouse hearts 4 weeks after transplantation of (A, B) naive AECs or (C, D) EMT—AECs, (E, F) PBS control, and (G, H) positive control consisting of human foreskin fibroblasts (original magnification 20×, scale bar: 50 μm).
Discussion
Given the modest results of cardiac cell therapy using autologous, patient-derived cells, the search for alternative cell products that have not been subjected to age- and disease-related changes has intensified. Of the possible sources, the placenta is particularly attractive since it is a “waste tissue” of substantial size, containing a large number of cells with regenerative potential. While cell products derived from the chorion are a mix of fetal and maternal cells, the amniotic membrane consists entirely of fetal cells. Their epithelial properties primarily serve the purpose of sealing the amniotic cavity and possibly regulating amniotic fluid homeostasis, but they also mirror the epithelial character of their ancestors, embryonic stem cells. Indeed, AECs have been shown to share phenotypic characteristics of pluripotent stem cells (20), and isolation and clinical-grade expansion is relatively straightforward (21,24). During embryologic development, EMT occurs, for instance, when mesodermal cells separate from the ectodermal layer during gastrulation. In vitro, embryonic stem cells in monolayers undergo EMT early during differentiation and display typical phenomena such as E-cadherin loss, switch to N-cadherin, increased matrix metalloproteinase activity, and cellular motility (6), and multipotent stromal cell (MSC)-like cells can be produced via EMT from epithelial sheets of embryonic stem cells (3). We found that EMT can be quantitatively induced in cultured AECs by exposing them to TGF-β1, so that they displayed the typical features of EMT including a loss of epithelial continuity in culture, a more spindle-shaped morphology, and increased cellular mobility. In addition to the typical loss of E-cadherin protein expression, the global transcriptional profile also mirrored the significant change in phenotype. Our hypothesis for the in vivo experiments was that EMT would improve the cardiac regeneration capacity of amniotic epithelial cells by increasing their mobility and extracellular matrix-modulating capacity. Indeed, 4 weeks after LAD ligation, heart function was best preserved in mice that were treated with EMT—AECs, associated with a markedly reduced infarct size. Naive AECs also improved LV function compared with untreated controls, but clearly less so than after preoperative EMT induction. However, neither angiogenesisnor arteriogenesis-related in vivo parameters were measurably influenced by EMT induction, so a relevant EMT-induced support of actual regeneration processes appears to be unlikely. Neo-cardiomyogenesis based on similar cell products has been shown to be extremely unlikely, if not impossible, and would be ruled out as a different regeneration mechanism. On the other hand, Fang et al. recently reported that a small percentage of the surviving human amniotic epithelial cells expressed myosin heavy chain 4 weeks after transplantation in the infarcted myocardium of immunodeficient rats (7). A more likely explanation for the reduced infarct size and better LV function is augmentation of cardioprotective phenomena in this acute infarction model, and this is reflected by the smaller number of TUNEL+ cells as late as 4 weeks after infarction. In vitro, EMT—AECs displayed increased Akt phosphorylation, which is in line with the notion that EMT suppresses apoptosis in epithelial cells (8), while, without EMT, TGF-β1 induces apoptotic cell death [reviewed in Schuster and Krieglstein (27)]. Recently, it has been shown that mesenchymal stem cells pretreated with TGF-β1 display enhanced cardioprotective effects in isolated perfused rat hearts resulting in improved postischemic contractility (18). These findings are in line with our data, although EMT should not matter when MSCs are used as source cells. The extracellular matrix (ECM) and its components also play an important role in the postischemic heart, and somatic stem cells, naive or modified, have been shown to directly influence ECM turnover (11,16,19,31). The role of the matricellular protein periostin has been outlined during embryogenesis (4,14) as well as during pathological conditions (17,29). Myocardial infarction induces the expression and secretion of periostin by cardiac fibroblasts, activating fibroblast proliferation/migration and supporting ECM remodeling through the activation of integrin-mediated focal adhesion kinase signaling (10,28). Our data support the notion that increased expression of periostin in AEC-treated hearts is associated with reduced infarct size, and this phenomenon is further exacerbated by EMT-AECs. A more detailed analysis of ECM components, matrix metalloproteinases, and their tissue inhibitors in infarcted hearts with or without EMT—AEC transplantation may be warranted. Finally, although immunologic aspects were not the focus of this investigation, the finding of markedly increased IL-8 secretion by EMT—AECs deserves to be discussed. IL-8 is upregulated in ischemic myocardium and correlates with adverse outcomes in human heart failure (15,25). On the other hand, IL-8 has been shown to regulate myocardial homing and angiogenic actions of bone marrow angioblasts (13). However, we did not observe an effect of EMT—AECs on blood vessel density; neither did we specifically study the persistence of IL-8 secretion by EMT—AECs after transplantation. Although the allogenic immunoprivilege of AECs has been demonstrated in humans more than 30 years ago (1), we did not detect surviving AECs after 4 weeks in our xenogenic model. Limited survival of transplanted progenitor cells in the heart has been shown even in syngenic models (23), but does not preclude that cell therapy yields functional benefits at least temporarily (26).
Taken together, EMT-induced loss of epithelial phenotype and improved cell mobility resulted in enhanced cardioprotective effects of human amniotic epithelial cells. Ultimately, the concept of targeted EMT induction may facilitate the development of clinical cell therapy strategies using placenta-derived cells.
Footnotes
Acknowledgments
We would like to thank Dr. Jeong-Chan Ra and RNL Bio for supporting our study, Dr. Sarah Nordmayer for her assistance with MRI data acquisition, Harald Stachelscheid for analysis of the microarray data, and Matthias Pippow for the excellent technical assistance. This project was supported by the German Bundesministerium für Bildung und Forschung (BMBF) (FKZ 01GN0948 to C.S.) as well as by Deutsche Forschungsgemeinschaft (DFG, FKZ GSC 203) through the Berlin-Brandenburg School for Regenerative Therapies. BCRT received funding from Charité Universitätsmedizin (FKZ 1315848A), Helmholtz-Zentrum Geesthacht (FKZ 1315848B), and BMBF (FKZ 0315848A). RNL Bio provided AECs for preliminary experiments and financial support. Sung Keun Kang is an employee of RNL Bio and hold shares of stock. R.R., Y.H.C., C.S.: study design; R.R.: animal experiments; R.R., M.K., D.M.: data analysis and interpretation; R.R., C.S.: preparation of the manuscript; M.K.: echocardiography studies; D.M.: cardiac MRI studies; D.K.: FACS analysis; D.K., C.S.: data interpretation; A.B., K.K.: in vitro assays and interpretation; S.G.: zymography assay and interpretation; P.M.B.: apoptosis assay and interpretation; S.K.K.: cell preparation protocol, quality control, AEC cultivation protocols; Y.H.C., C.S.: study design; Y.H.C.: angiogenesis assays. The authors declare no conflicts of interest.