
Abstract
In solid tumors, a decreased oxygen and nutrient supply creates a hypoxic microenvironment in the central region. This hypoxic condition induces molecular responses of normal and cancer cells in the local area, including angiogenesis, metabolic changes, and metastasis. In addition, other cells including mesenchymal stem cells (MSCs) have been reported to be recruited into the hypoxic area of solid tumors. In our previous study, we found that hypoxic condition induces the secretion of growth factors and cytokines in MSCs, and here we demonstrate that elevated secretion of transforming growth factor-β1 (TGF-β1) by MSCs under hypoxia promotes the growth, motility, and invasive ability of breast cancer cells. It was found that TGF-β1 promoter activity was regulated by hypoxia, and the major hypoxia-regulated element was located between bp −1030 to −666 in front of the TGF-β1 promoter region. In ChIP assay, the results revealed that HIF-1 was bound to the hypoxia response element (HRE) of TGF-β1 promoter. Collectively, the results indicate that hypoxia microenvironment can enhance cancer cell growth through the paracrine effects of the MSCs by driving their TGF-β1 gene expression and secretion. Therefore, extra caution has to be exercised when considering hypoxia pretreatment of MSCs before cell transplantation into patients for therapeutic purposes, particularly in patients susceptible to tumor growth.
Introduction
The tumor microenvironment is composed of noncancer cells and stroma, which influence cancer development and dissemination. Growth factors and cytokines produced by stromal cells support and stimulate tumor cell growth and allow the recruitment of noncancer cells to the solid tumor. In the tumor stroma, fibroblasts are the major component and have an active phenotype similar to that in wound healing. When active, fibroblasts secrete extracellular matrix (ECM) proteins, growth factors, and chemotactic factors that include fibroblast growth factor 2 (FGF2), epidermal growth factor (EGF), transforming growth factor (TGF)-βs, matrix metalloproteinases (MMPs), and other growth factors (30). Recent studies have revealed that macrophages as well as many other immune cells are recruited to and reside in the tumor stroma. Inside the tumor, macrophages differentiate into tumor-associated macrophage (TAMs) and release various factors that influence endothelial cell behavior (13, 18, 23).
Mesenchymal stem cells (MSCs) are also known to migrate and become part of the tumor site in cancers such as breast cancer, glioma, and melanomas (7, 16, 18). These MSCs interact with stromal cells and/or cancer cells through cell–cell contact or via paracrine effects. Recently, it was demonstrated that MSCs can be attracted to and migrate toward medium derived from MCF-7/Ras or MDA-MB-231 cancer cell cultures through transwell pores. It was also shown that admixed MSCs have metastasis-enhancing powers that promote mammary carcinoma cell metastasis in a xenograft model (10).
Hypoxia is a major feature of solid tumors. In fast growing tumors, oxygen and nutrients supply is decreased at the central core of the tumor, and this leads to tumor cell death. Recent clinical studies have found that tumor hypoxia is an indicator of poor prognosis and is associated with metastasis (15, 32), and hypoxic tumors are more resistant to radiation or chemotherapy (2). Hypoxia-inducible factors (HIFs) are the major sensor related to oxygen alterations in the cellular microenvironment. The HIFs (HIF-1, HIF-2, and HIF-3) are transcription factors and regulate various transcription programs at low oxygen level (1, 8, 20). More recently, Zhang et al. reported that hypoxia induces TGF-β2 gene expression and causes a TGF-β2 autocrine regulation loop (31). In 2004, Nishi et al. also demonstrated that hypoxia increases TGF-β3 promoter activity and enhances endogenous TGF-β3 expression through HIF-1 binding (19). Many studies have also indicated that TGF-βs are the major inducer of epithelial–mesenchymal transition (EMT) in breast cancer (6). However, little is known about how hypoxia regulates TGF-β gene family expression and the relationship between hypoxia, TGF-βs, and tumor growth.
In our previously reported work, we found that hypoxia induced TGF-β1 expression and secretion in MSCs (9). The purpose of this study is to further investigate the effect of hypoxia on the progression of breast cancer via the HIF-1α-dependent expression of TGF-β1 in human MSCs. We hypothesize that TGF-β1 gene expression is regulated by hypoxic stress, and TGF-β1 induced by hypoxic environment further enhances the malignant properties of cancer cells.
Materials and Methods
Isolation of MSCs
Human bone marrow-derived MSCs (BM-MSCs) were harvested by negative immune selection and limiting dilution as previously reported (9, 12, 14). An approval from the Institutional Review Board and the informed consent of the bone marrow donors were obtained prior to the commencement of the study. Bone marrow aspirates were collected from the donors during surgery as a result of orthopedic trauma. All donors were healthy surgical patients due to traffic accidents (n = 3; 16 years old, male; 22 years old, male; 50 years old, male). Expansion medium consists of Iscove's modified Dulbecco's medium (IMDM; Gibco, Grand Island, NY, USA) and 10% fetal bovine serum (FBS; Hyclone, Logan, UT, USA) supplemented with 10 ng/ml bFGF, 100 U penicillin, 1,000 U streptomycin, and 2 mM l-glutamine (Gibco). To obtain single cell-derived, clonally expanded MSCs, isolated plate-adhering cells were serially diluted and plated onto 96-well plates (Becton Dickinson, Franklin Lakes, NJ, USA) in expansion medium, at a final density of 0.3 cell per well (30 cells per 96-well plate). After the clonally derived MSCs were obtained, medium changes were carried out twice weekly thereafter. Colonies that grew were further culture expanded and tested for their surface immune phenotype and trilineage differentiation potential, as previously described, before these cells were used for subsequent experiments (12).
MSC Maintenance and Culture Expansion
Once adherent cells reached approximately 70–80% confluence, they were detached with 0.25% trypsin-EDTA (ethylenediaminetetraacetic acid; Gibco) and replated at 1:3 under the same culture conditions. BM-MSCs were then cultured in IMDM supplemented with 10% FBS, 10 ng/ml bFGF, 100 U penicillin, 1000 U streptomycin, and 2 mM l-glutamine. Cells at passages 11–13 were used for the experiments.
Hypoxia Treatment
MSCs were seeded on culture dishes in culture expansion medium and left to adhere for 18–24 h. Hypoxia (1% O2) was simulated using a water-saturated gas mixture of 1% O2, 5% CO2 and 94% N2 at 37°C. In additional experiments, cells were exposed to hypoxia using previously reported methods (9), namely CoCl2 (100 mM; Sigma-Aldrich, St. Louis, MO, USA) and deferoxamine mesylate (DFO; 10 mM; Sigma-Aldrich), which were used to mimic hypoxia in the normoxic environment. In the normoxic control group, MSCs were cultured in water-saturated atmospheric air supplemented with 5% CO2 at 37°C.
Maintenance of MDA-MB-231 and MCF-7 Breast Cancer Cells and 293T Cells
MDA-MB-231 and MCF-7 human breast cancer cell lines and 293T cells were obtained from the Bioresource Collection and Research Center, Hsinchu, Taiwan. MDA-MB-231 and MCF-7 cells were cultured in IMDM. The 293T human embryonic kidney cells were cultured in Dulbecco's modified Eagle's medium (DMEM; Gibco). The medium was supplemented with 10% FBS, 100 U penicillin, 1,000 U streptomycin, and 2 mM l-glutamine.
TGF-β1 and TGF-β Type I Receptor (TGF-βRI) Inhibitor (SB431542 and LY364947) Treatment
The TGF-β1 signaling pathway in MSC conditioned medium-induced breast cancer cell proliferation was explored as follows. TGF-β1 (10 mM; Sigma-Aldrich) and TGF-βRI inhibitors (SB431542 and LY364947; 10 mM; Sigma-Aldrich) were added into the culture medium. After 3 days of culture, the cell number and colony number were counted to determine how promotion and inhibition of the signaling pathway affect breast cancer cell proliferation.
Immunocytochemical Staining
MSCs were grown on six-well tissue culture plates (Corning, Corning, NY, USA). After fixation in 2% paraformaldehyde/phosphate-buffered saline (PBS; both Sigma-Aldrich) for 30 min and permeabilization for 30 min with 1% Triton X-100 (Sigma-Aldrich)/PBS, the cells were hybridized with anti-p-mothers against decapentaplegic homolog 2 (Smad2) antibody (1:200, Santa Cruz Biotechnology, Santa Cruz, CA, USA) or anti-Smad4 antibody (1:200, Santa Cruz Biotechnology) overnight at 4°C. Secondary antibody staining was done with fluorescein-labeled antibody (1:250, Sigma-Aldrich), and the nuclei were stained with 4′,6-diamidino-2-phenylindole (DAPI; 5 ng/ml; Santa Cruz Biotechnology). The various immunofluorescence experiments were photographed using an Olympus FV1000 Laser confocal microscope (Olympus, Tokyo, Japan).
Western Blot Analysis
MSCs were cultured in 1% or 21% O2 condition for different time courses. Total lysate was prepared using RIPA buffer supplemented with a protease inhibitor cocktail (Sigma-Aldrich). In total, 40 μg of proteins from each sample was separated on 10–12% sodium dodecylsulfatepolyacrylamide gels (Life Technologies, Eggenstein, Germany), transferred onto nitrocellulose membranes (Amersham Biosciences UK Ltd., Little Chalfont, Buckinghamshire, UK), and then probed with mouse anti-fibronectin antibody (1:1,000, BD Biosciences, San Jose, CA, USA), rabbit anti-E-cadherin antibody (1:1,000, Cell Signaling, Danvers, MA, USA), mouse anti-cyclin-dependent kinase inhibitor p27 antibody (1: 1,000, Sigma-Aldrich), mouse anti-Smad2, rabbit anti-p-Smad2, mouse anti-Smad4 antibody (1:1,000, all Santa Cruz Biotechnology), mouse anti-HIF-1α (1:500; BD Biosciences), mouse anti-TGF-β1 (1:1,000, Santa Cruz Biotechnology), or mouse anti-β-actin antibody (1:2,000, Sigma-Aldrich), at 4°C overnight, followed by incubation with horseradish peroxidase (HRP)-conjugated anti-goat antibodies, HRP-conjugated anti-mouse (1:10,000; Sigma-Aldrich) or HRP-conjugated anti-rabbit IgG (1:10,000; GE Healthcare, Bucks, UK) as appropriate. Protein visualization was achieved by enhanced chemiluminescence (PerkinElmer Life and Analytical Sciences, Boston, MA, USA) according to the manufacturer's protocol.
Enzyme-Linked Immunosorbent Assay (ELISA)
TGF-β1 levels in conditioned medium were measured using sandwich ELISA reagent kits (R&D Systems, Minneapolis, MN, USA). The detailed experimental procedures have been described elsewhere previously (3).
RNA Isolation and Quantitative Real-Time RT-PCR
RNA extraction was carried out with RNEasy (Qiagen, Stanford, Valencia, CA, USA) according to the manufacturer's instructions. The concentrations of the RNA samples were quantified using a spectrophotometer (Eppendorf, Hamburg, Germany) at OD 260/280. The mRNA samples were reversely transcribed to cDNA using Advantage RT-for-PCR (Clontech, Palo Alto, CA, USA) by following the manufacturer's instructions. cDNA was amplified using Roche LightCycler 480 (Roche Applied Sciences, Mannheim, Germany) real-time PCR system. Real-time PCR was performed using the following cycle parameters: initial enzyme activation at 95°C for 10 min and then 45 cycles of 95°C for 10 s, 60°C for 20 s, and 65°C for 30 s; after the amplification phase, a cooling step was performed to 0°C for 10 s (ramp rate of 1.5°C/s). Acquisition of the fluorescence signal was performed using the Mono Hydrolysis Probe setting (483–523 nm) during the 65°C extension phase of each cycle. The primer sequences were designed using the Universal Probe Library (Roche Applied Sciences). The primers used for amplification are listed in Table 1.
Primer Sequences Used in the Real-Time PCR Analysis

MMP, matrix metalloproteinase; HIF, hypoxia-inducible factor; TGF, transforming growth factor; Oct4, octamer binding transcription factor 4; C-Myc, V-Myc myelocytomatosis viral oncogene homolog.
Colony Forming Assay
MDA-MB-231 cells were seeded on 100-mm culture plates (Corning) at 100 cells per plate concentration for 20 days, in order to evaluate colony forming efficiency of the BM-MSC condition media. After 20 days, colonies that had formed from single cells were visualized by light microscopy and then counted after staining with 0.5% crystal violet (Sigma-Aldrich) in methanol for 5 min, after being fixed in 4% formaldehyde. Cells were washed twice in distilled water, and the number of colonies per dish was determined. Colonies >2 mm in diameter were counted, and faintly stained colonies were ignored.
Cell Migration Assay
Migration assays were performed using the culture inserts (ibidi GmbH, Martinsried, Germany). The culture inserts were transferred to six-well plates (Corning); MDA-MB-231 cells were seeded at a density of 3,000 cells/well of culture insert and grown to confluence. The confluent cells were incubated with 20 mM mitomycin C (Sigma-Aldrich) for 2 h to inhibit cell proliferation. The culture insert was then removed by which a 0.5-mm cell-free gap was created. Different MSC conditioned medium were added into wells, put into incubator, and then cultured at 37°C. Three independent experiments were performed, and the results were photographed (7–10 pictures for each time point) with a digital camera system (Nikon, Tokyo, Japan) after different incubation times (12, 24, and 36 h). The cell-covered areas after 24 h of incubation were quantified and analyzed by ImageJ software (Release Alpha 4.0 3.2, NIH, Bethesda, MD, USA).
Transwell Invasion Assay
A Transwell insert (8-μm pore; Millipore, Carrigtwohill, Ireland) was used for the in vitro invasion assay. The upper side of the insert was precoated with Matrigel (1:3 dilution with IMDM; BD Bioscience). MDA-MB-231 cells (2×10⁴) in 0.5% serum-containing IMDM were then seeded into the upper chamber, and MSC conditioned media were added to the lower chamber as a chemoattractant. After 48 h, the cells on the upper side of the filter were removed, and cells that had invaded to the underside of filter were fixed in 3.7% formaldehyde (Sigma-Aldrich) at room temperature 15 min. The Transwell insert was then washed twice with PBS and stained with DAPI (Santa Cruz Biotechnology) at room temperature for 10 min. Ten random views of each sample were photographed under a fluorescence microscope (Nikon). The number of invaded cells was counted based on the presence of a DAPI-positive nucleus.
Plasmids, Transient Transfection, and Luciferase Assays
The HIF-1α (WT; full length) and HIF-1α [ΔODD; missing oxygen-dependent degradation (ODD) domain] plasmids were those used by Yang et al. (28). For over-expression of HIF-1α, the HIF-1α (WT) and HIF-1α (ΔODD) plasmids were transiently transfected into MSCs using Lipofectamine 2000 reagent (Invitrogen). The TGF-β1 promoter region (-1500 to +300 bp) surrounding the transcription start site was cloned by PCR amplification of genomic DNA from MSCs and inserted into the HindIII– KpnI sites of the pGL4.2 vector (Promega, Madison, WI, USA) to generate the 1.8-, 1.1-, and 0.7-kb TGF-β1 promoter (TGF-β1 pro 1.8, 1.1, and 0.7) constructs. The reporter constructs were cotransfected with different expression vectors and internal control plasmids into 293T cells under normoxic or hypoxic conditions. Cellular luciferase activity was measured within the cell lysate by a luciferase assay system (Promega). All transfection experiments were performed on at least three occasions.
Chromatin Immunoprecipitation (ChIP) Assays
ChIP assay was performed as described previously (28). The lysates were incubated either without or with antibodies specific for HIF-1 (Santa Cruz Biotechnology). PCR reaction generated a 306-bp product (location 1) or 304-bp product (location 3) from the distal region without hypoxia response element (HRE) or a 364-bp product (location 2) from the TGF-β1 proximal promoter containing HRE. A 262-bp product from the vascular endothelial growth factor (VEGF) proximal promoter was used as a positive control. The primers used in ChIP assays are listed in Table 2.
Primer Sequences Used in the ChIP Assay

ChIP, chromatin immunoprecipitation; VEGF, vascular endothelial growth factor.
Statistical Analysis
Statistical analysis was performed using the Statistical Package for Social Science-10 software (SPSS Inc., Chicago, IL, USA). The data are presented as means ± SD from three or four independent experiments. Results were analyzed by ANOVA tests with Tukey's post hoc tests or two-tailed nonpaired t tests. A value of p < 0.05 was considered statistically significant. Different letters of the alphabet represent different levels of significance in the figures.
Results
Human Mesenchymal Stem Cell Conditioned Medium Increases Breast Cancer Cell Growth
Previously, we found that hypoxia induces the secretion of cytokines and growth factors by MSCs (9). To assess the effects of these secreted factors on breast cancer cells, MDA-MB-231 cells were cultured in MSC conditioned medium that was prepared by normoxic or hypoxic culture. Overall, MDA-MB-231 cells cultured for 3 days in MSC conditioned medium yielded significantly higher cell numbers than the control group. Also, MDA-MB-23 1 cells cultured in hypoxic conditioned medium grew faster than those cultured in normoxic conditioned medium (Fig. 1A, B). The phenomenon of hypoxic conditioned medium-enhanced proliferation could also be observed in MCF-7 cells (Fig. 1C, D). By colony forming assay, it was shown that the number and size of colonies of MDA-MB-231 cells from the hypoxic conditioned medium group were increased (Fig. 1E, F).
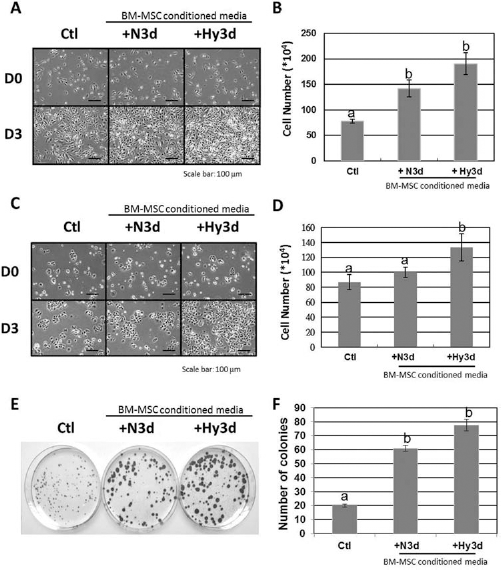
Effects of MSC conditioned media on breast cancer cell growth. (A) Morphology of the MDA-MB-231 cells after mesenchymal stem cell (MSC) conditioned media culture for 3 days. (B) The cell number of MDA-MB-231 cells was increased after MSC conditioned media culture for 3 days, particularly in the hypoxic condition group. (C) Morphology of the MCF-7 cells after MSC conditioned media culture for 3 days. (D) The cell number of MCF-7 cells was increased after MSC conditioned media culture for 3 days, particularly in the hypoxic condition group. (E) Photograph of the colony forming assay of MDA-MB-231 cells. The colonies were stained with 0.5% crystal violet and photographed. (F) Colonies having a diameter of more than 2 mm was counted. Compared to the control group, the number of colonies in the hypoxia conditioned media group was significantly increased. Scale bar: 100 μm. Ctl, control; N3d, MSC conditioned media collected from 3-day normoxic cultures; Hy3d, MSC conditioned media collected from 3-day hypoxic cultures. Data are shown as mean ± SD; n = 3. The different letters of the alphabet represent different levels of significance.
Hypoxia-Treated Mesenchymal Stem Cell Conditioned Medium Increases Breast Cancer Cell Migration and Invasion
MSC conditioned medium enhanced the migratory ability of MDA-MB-231 cells, as shown in the photomicrographs taken at 24 and 36 h after insert removal, especially in the hypoxic conditioned medium group (Fig. 2A). Twenty-four hours after removal of the culture insert, the cell-covered area was significantly greater in the hypoxic conditioned medium group (86.42+1.71%) than both the normoxic conditioned medium group (57.94 ± 2.27%) and the control group (42.36+1.83%) (Fig. 2B). However, the invasive ability of MDA-MB-231 cells cultured with MSC conditioned medium was increased regardless of the oxygen tension during conditioning (Fig. 2C). Hypoxic conditioned medium also enhanced the migratory and invasive abilities of MCF-7 cells (Fig. 3).

MSC conditioned media increased the migratory and invasive abilities of MDA-MB-231 cells. (A) Migration assays were performed and photographed after culture insert removal and incubation for 12, 24, and 36 h. MSC conditioned media in hypoxic cultures obviously increased the migratory capabilities of MDA-MB-231 cells, as more cells migrated toward the open space in this group compared to the control group. (B) Comparison of cell-covered area of MDA-MB-231 cells cultured with MSC conditioned media after culture-insert removal for 24 h. (C) Pictures of the MDA-MB-231 cells that had invaded across the Matrigel and transwell membrane to the other side of the filter. The nuclei of the invaded cells were stained with 4′,6-diamidino-2-phenylindole (DAPI; left panel). The number of invaded cells was counted per field (right panel). Scale bar: 100 μm. Ctl, control; N3d, MSC conditioned media collected from 3-day normoxic cultures; Hy3d, MSC conditioned media collected from 3-day hypoxic cultures. The results are shown as mean ± SD; n = 3; *p < 0.05; **p < 0.001.

MSC conditioned media increased the migratory and invasive abilities of MCF-7 cells. (A) Migration assays were performed and photographed after culture insert removal and incubation for 24 h. MSC conditioned media in hypoxic culture obviously increased the migratory capabilities of MCF-7 cells, as more cells migrated toward the open space in this group compared to the control group. (B) Comparison of cell-covered area of MCF-7 cells cultured with MSC conditioned media after culture insert removal for 24 h. (C) Pictures of the MCF-7 cells that had invaded across the Matrigel and transwell membrane to the other side of the filter. The nuclei of the invaded cells were stained with DAPI (left panel). The number of invaded cells was counted per field (right panel). Scale bar: 100 μm. Ctl, control; N3d, MSC conditioned media collected from 3-day normoxic cultures; Hy3d, MSC conditioned media collected from 3-day hypoxic cultures. The results are shown as mean ± SD; n = 3; *p < 0.05; **p < 0.001.
MSC-Derived Medium Induced EMT Marker and Stemness Gene Expression in Breast Cancer Cells
We found that hypoxic conditioned medium increases breast cancer cell migration and invasion, as shown in Figures 2 and 3. Then, we wanted to investigate the influence of MSC conditioned medium on EMT gene expression. E-cadherin, one of the hallmarks of epithelial cells, was downregulated at RNA level after incubation in MSC conditioned medium for 3 days. EMT markers, such as fibronectin, twist, and snail, were expressed in MDA-MB-231 cells after MSC conditioned medium incubation. Furthermore, MMP9 and MMP13 were also upregulated by MSC conditioned medium incubation (Fig. 4A). On the other hand, the stemness genes such as Nanog, octamer binding transcription factor 4 (Oct4), and V-Myc myelocytomatosis viral oncogene homolog (C-Myc) were upregulated in MDA-MB-231 cells after MSC conditioned medium incubation (Fig. 4B). After incubation for 7 days, fibronectin was also increased at the protein level in the MDA-MB-231 cells in MSC conditioned medium (Fig. 4C, left panel). E-cadherin was downregulated significantly in the MDA-MB-231 cells at the protein level after 2 weeks of incubation in MSC conditioned medium (Fig. 4C, right panel).

MSC conditioned media affected EMT marker expression at the mRNA and protein levels in MDA-MB-231 cells. (A) Real-time PCR analysis of the mRNA expression levels of E-cadherin, fibronectin, Twist, Snail, matrix metalloproteinase 9 (MMP9), and MMP13 in MDA-MB-231 cells after MSC conditioned media incubation for 3 days. (B) Real-time PCR analysis of mRNA expression levels of Nanog, octamer-binding transcription factor 4 (Oct4), and V-Myc Myelocytomatosis viral oncogene homolog (c-Myc) in MDA-MB-231 cells after MSC conditioned media incubation for 3 days. (C) Western blot analysis of fibronectin after MSC conditioned media incubation for 1 week and E-cadherin after MSC conditioned media incubation for 1 and 2 weeks in MDA-MB-231 cells. Ctl, control; N3d, MSC conditioned media collected from 3-day normoxic cultures; Hy3d, MSC conditioned media collected from 3-day hypoxic cultures; T, added transforming growth factor (TGF)-β1 (10 mM) in culture medium and cultured for 3 days. The results are shown as mean ± SD (n = 3). Different letters of the alphabet represent different levels of significance, *p < 0.05. EMT, epithelial-mesenchymal transition.
Hypoxia-Treated MSC Conditioned Medium Induced SMAD Signaling Pathway Activation in Breast Cancer Cells
To determine the downstream effects of MSC conditioned medium on breast cancer cells, phosphorylation of Smad proteins was investigated and nuclear translocation of p-Smad2 and Smad4 was studied by immunostaining. In the control group, the level of p-Smad2 was low and Smad4 was predominantly localized in the cytoplasm. When MDA-MB-231 cells were exposed to MSC conditioned medium for 2 h, phosphorylated Smad2 (p-Smad2) and Smad4 were translocated to the cell nucleus (Fig. 5A). The level of p-Smad2 was increased in the MSC conditioned medium treated group, especially in the hypoxic conditioned medium group (Fig. 5B). These results support that MSC conditioned medium activates the TGF-β signaling pathway in MDA-MB-231 cells, and this effect is more pronounced for the hypoxic conditioned medium group than for the normoxic conditioned medium group.

Effects of MSC conditioned media on SMAD signaling in MDA-MB-231 cells. (A) MSC conditioned media induced nuclear translocation of mothers against decapentaplegic homolog 4 (Smad4) and p-Smad2 in MDA-MB-231 cells. (B) MSC conditioned media induced changes in the level of phosphorylated Smad2 in MDA-MB-231 cells, which were measured by Western blot analysis. Scale bar: 20 μm. Ctl, control; N3d, MSC conditioned media collected from 3-day normoxic cultures; Hy3d, MSC conditioned media collected from 3-day hypoxic cultures. The results are shown as mean ± SD; n = 3; *p < 0.05.
TGF-β Receptor I Inhibitors Block the MSC Conditioned Medium-Induced Proliferation of Breast Cancer Cells
In order to assess the relationship and effects of MSC conditioned medium on the TGFβ-SMAD signaling pathway during MDA-MB-231 cell growth, MDA-MB-231 cells were cultured in MSC conditioned medium in the presence of TGF-β receptor I (TGF-βRI) inhibitors such as SB431542 and LY364947. After 3 days of culture, cell number had decreased significantly in TGF-βRI inhibitor treatment groups (Fig. 6A). By colony forming assay, the colony size and colony number had also decreased in TGF-βRI-inhibitor treatment groups (Fig. 6B). Furthermore, upon TGF-βRI-inhibitor treatment, the expression of the cyclin-dependent kinase (Cdk) inhibitor p27 increased gradually in normoxic conditioned medium, but this did not occur in the hypoxic conditioned medium group (Fig. 6C). These results clearly indicate that TGF-β signaling is involved in MSC condition medium-induced breast cancer cell proliferation.
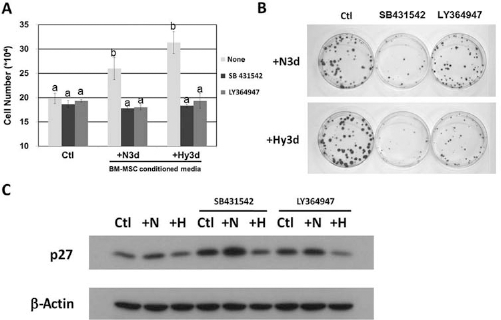
TGF-β signaling is involved in MSC conditioned medium-induced MDA-MB-231 cell proliferation. (A) Transforming growth factor-β receptor I (TGF-βRI) inhibitors (SB431542 and LY364947) reduced MSC conditioned medium-induced MDA-MB-231 cell proliferation and (B) colony formation. (C) Western blot analysis of the Cdk inhibitor p27 during MSC conditioned medium-induced MDA-MB-231 cell proliferation after TGF-βRI inhibitor treatment. Ctl, control; N3d, MSC conditioned medium collected from 3-day normoxic cultures; Hy3d, MSC conditioned medium collected from 3-day hypoxic culture. The results are shown as mean ± SD; n = 3. Different letters of the alphabet represent different levels of significance.
Hypoxia Upregulates TGF-β1 Expression in Mesenchymal Stem Cells
We previously reported that hypoxia increased the expression and secretion of a variety of growth factors and cytokines, including TGF-β1 (9). In this study, we further demonstrated that MSC conditioned medium induced Smad2 phosphorylation in MDA-MB-231 cells (Fig. 5). Therefore, we reasoned that hypoxia might regulate TGF-β1. First, we analyzed the TGF-β1 level in MSC conditioned medium by ELISA; indeed, a higher level of bioactive TGF-β1 was present in hypoxic conditioned medium compared with normoxic conditioned medium (Fig. 7A). These findings were confirmed by Western blot analysis, and the protein levels of HIF-1α and TGF-β1 were found to be positively correlated with hypoxia treatment of MSCs (Fig. 7B). Under normoxia, TGF-β1 gene expression was upregulated by stabilization of HIFs with CoCl2 or DFO treatment (Fig. 7C) and by overexpression of HIF-1α (Fig. 7D). These results indicate that TGF-β1 expression is upregulated by hypoxia.

Hypoxia induced TGF-β1 expression on MSCs. (A) The levels of bioactive TGF-β1 in MSC conditioned media were analyzed by ELISA. (B) Western blot analysis of HIF-1α and TGF-β1 in MSCs after hypoxia treatment (Hy). (C) Real-time PCR analysis of TGF-β1 mRNA expression after treatment of MSCs with HIF stabilizers [CoCl2 and deferoxamine mesylate (DFO)]. (D) Fold changes in HIF-1α and TGF-β1 mRNA levels measured by real-time PCR in HIF-1α WT- or HIF-1α (ΔODD)-overexpressing MSCs. The results are shown as mean ± SD; n = 3. Different letters of the alphabet represent different levels of significance, *p < 0.05; **p < 0.001.
HIF-1α Drives TGF-β1 Expression by Regulating TGF-β1 Promoter Activity
To identify whether HIF-1α is an important factor in the regulation of TGF-β1 expression under hypoxia, luciferase plasmids containing TGF-β1 pro 1.8 or various deletions of TGF-β1 upstream DNA fragments (TGF-β1 pro 1.1 and TGF-β1 pro 0.7) (Fig. 8A) were transiently cotransfected with a β-galactosidase expression plasmid into 293T cells. The 1.1-kb TGF-β1 promoter fragment resulted in an approximately 19-fold increased promoter activity in 293T cells under hypoxia treatment compared to the normoxic control group (Fig. 8B). Treatment of the transfected 293T cells with CoCl2, an HIF stabilizer, also increased the promoter activity (Fig. 8C). Moreover, transient transfections were performed to investigate whether the TGF-β1 promoter was activated by overexpression of HIF-1α. The results showed that HIF-1α overexpression was able to activate the TGF-β1 promoter constructs (TGF-β1 pro 1.8 and TGF-β1 pro 1.1) by about 15-fold (Fig. 8D). In ChIP assay, the data indicated that HIF-1 was bound to the HRE region (location 2) of the TGF-β1 promoter. PCR amplification of the anti-HIF-1α antibody immunoprecipitants showed that the fragment of the TGF-β1 promoter containing the HRE (location 2) existed in hypoxia-treated MSCs. Control experiments in this chromatin immunoprecipitants from the same set of samples were amplified by PCR showed the positive control band (262 bp) in the VEGF promoter (Fig. 8E). Such results suggest that the major HIF-regulatory element is located between bp −1030 to −666 in front of the TGF-β1 promoter region. These findings confirmed that TGF-β1 promoter activity is regulated by hypoxia.
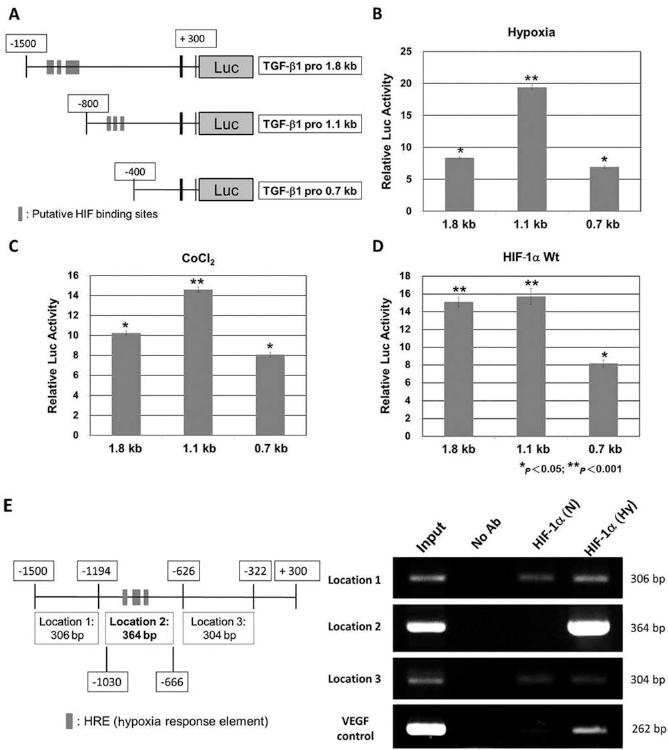
Effects of hypoxia on the transcriptional activity of the TGF-β1 promoter. (A) Schematic representation of the promoter region of TGF-β1 and the reporter constructs used in experiments targeting hypoxia-regulated TGF-β1 transcriptional activity. (B) Activation of TGF-β1 reporter constructs after hypoxia treatment for 48 h, (C) after treatment with 100 mM CoCl2 for 48 h, or (D) after cotransfection with HIF-1α WT for 48 h. (E) ChIP analysis of TGF-β1 promoter in BM-MSCs after hypoxic culture. Schematic representation of the PCR products of TGF-β1 promoter region used in ChIP assay (left panel). Chromatin was incubated either without or with anti-HIF-1α antibody. The 364-bp fragment (location 2) contains the HRE, while the 306-bp (location 1) and 304-bp (location 3) fragments do not contain HRE in the TGF-β1 promoter. The 262-bp PCR product of VEGF promoter is the positive control (right panel). The results are shown as mean ± SD; n = 3; *p < 0.05; **p < 0.001.
Discussion
In this study, we demonstrate that MSC conditioned medium collected from normoxic or hypoxic culture is able to promote breast cancer cell proliferation and enhance cancer cell migration and increases cell invasive ability (Figs. 1–3). Central hypoxia is the major feature of solid tumors; this condition increases resistance to patient treatment and promotes tumor progression. Evidence indicates that some stromal cells, such as adipocytes, macrophages, and mesenchymal stem cells, are associated with tumors. The microenvironment in a solid tumor closely resembles the environment in injured tissue, and the developing tumor seems to recruit MSCs through the released endocrine or paracrine signals (24). In our previously published work, we reported that hypoxia induces the secretion of a variety of growth factors and cytokines (including TGF-β1, TGF-β2, and VEGF) in MSCs (9). We also have checked the other secreted members of the TGF-β superfamily under hypoxic conditions in MSCs. The gene expression of some members of TGF-β superfamily was also changed under hypoxia (data not shown). In 2003, Zhang et al. reported that hypoxia increased TGF-β2 expression and induced its downstream effectors (31). Those MSC-secreted growth factors can induce angiogenic activity and mediate vascular development in tumors (5). It is not impossible that MSCs localize within the tumor hypoxic area and secrete cytokines or growth factors that induce angiogenesis to nourish tumor cells and promote tumor progression. The current study focused on hypoxia-induced TGF-β1 expression and secretion in human MSCs and investigated the effects of MSC condition medium on breast cancer cells. We demonstrated that condition medium collected from hypoxic culture significantly increased the migratory and invasive abilities of breast cancer cells. MSC condition medium also induced expression of genes related to metastasis and downregulated E-cadherin expression (Fig. 4). Karnoub et al. reported that MSCs increase the metastatic potency of cancer cells through chemokine (C-C motif) ligand 5 (CCL5) secretion via MSC contact with nearby cancer cells (10), and our findings provide further evidence supporting the proposed effect of MSCs on cancer cell progression through a paracrine effect involving cytokines.
The TGF-β signaling pathway plays an important role in regulating cell growth, differentiation, tissue repair, and carcinogenesis. In normal tissues, TGF-β1 is a strong growth inhibitor and tumor suppressor. However, it has been reported in previous studies that, in malignant tumors, TGF-β1 promotes cancer progression and increases metastasis and invasiveness (6, 17). On the contrary, other lines of evidence have indicated that TGF-βs exhibit tumorsuppressive potentials through inhibiting the functions of antigen-presenting cells and inhibiting T-cell activation (5, 11). Parallel studies have confirmed that TGF-β1 activates SMAD signaling during the EMT and regulates the transcription program that involves the snail and Zinc finger E-box-binding homeobox (ZEB) transcription families (26, 29). In this study, MSC conditioned medium activated SMAD signaling and induced p-Smad2 translocation to the nucleus in MDA-MB-231 cells (Fig. 5). TGF-βRI inhibitors blocked MSC condition medium-induced MDA-MB-231 cell proliferation and colony formation (Fig. 6). All of these results support the hypothesis that the proliferation program of MDA-MB-231 cells is activated through TGF-β1 secreted by MSCs.
This study is the first to demonstrate that hypoxia can regulate TGF-β1 expression by regulating TGF-β1 promoter activity in human MSCs (Figs. 7 and 8). We also demonstrated the major hypoxia regulatory sequences located between nucleotides −800 and −400 in the upstream TGF-β1 promoter region. To analyze the nucleotide sequence, there are extensive regions similar to the hypoxia response element (HRE; 5′-RCGTG-3′) consensus sequence that are located in nucleotides −1500 to −400 of the upstream TGF-β1 promoter. Based on our presented data, the 1.1-kb TGF-β1 promoter fragment had the strongest luciferase activity under hypoxia or mimic hypoxia treatment in normoxic conditions (Fig. 8B–D). In ChIP assay, the result indicated that the PCR product of location 2 (which contain HRE sequence) existed in hypoxia-treated samples. This suggested that the major response region of hypoxia is situated at nucleotides −1030 to −666 in front of the TGF-β1 promoter (Fig. 8E). In 2007, Potier et al. reported that TGF-β1 expression was not affected by temporary exposure of human MSC to hypoxia (21). In the study by Potier et al., conclusions were drawn based solely on RT-PCR without verification by assays to validate the finding at protein levels by Western blotting, which is insufficient to support the findings claimed. In the present study, upregulation of TGF-β1 by exposure to hypoxia conditions was demonstrated using quantitative PCR, and the result was further verified at the protein level by Western blotting, which more conclusively demonstrates the effect of hypoxic conditioning.
Stem cells have the ability to migrate and engraft into host tissue or injured tissue; this property has a possible application in cell transplantation or gene therapy. It has been reported that hypoxia preconditioning of MSCs or progenitors enhanced engraftment and their therapeutic efficacy. Recent evidence has indicated that hypoxia enhancement of homing or engraftment occurs through HIF-1α-induced stromal cell-derived factor 1 (SDF-1) expression and binding to its receptor chemokine (C-X-C motif) receptor 4 (CXCR4) (4, 22, 25, 27). In contrast, our results suggest that hypoxia can induce TGF-β1 secretion in MSCs, and hypoxic conditioned medium can promote MDA-MB-231 cell proliferation and enhance invasive ability. This indicated that preconditioning of MSCs under hypoxia seems to enhance engraftment, and it is possible that the homing of MSCs in undesirable targets, such as tumor microenvironment, would also be enhanced.
In this study, we found that MSC conditioned medium can promote breast cancer cell growth and that the migratory and invasive abilities of the cancer cells were also enhanced, especially in the hypoxia-treated MSC group. The results support the hypothesis that hypoxia upregulates TGF-β1 expression and that the SMAD signaling pathway is involved in the MSC conditioned medium induction of cancer cell proliferation. This study also provides evidence that hypoxia-induced cytokines secreted by MSCs are able to promote cancer cell progression in vitro. The phenomenon may occur in solid tumor tissues in vivo. In the future, the relationship between a hypoxic environment, solid tumors, and mesenchymal stem cells will be explored in vivo.
Footnotes
Acknowledgments
This work was supported in part by the UST-UCSD International Center of Excellence in Advanced Bioengineering sponsored by the Taiwan National Science Council I-RiCE Program under grant number NSC100-2911-I-009-101. The authors also acknowledge financial support from the Taipei Veterans General Hospital (VGH101E1-012, VGH101C-015, and VN101-07), the National Science Council, Taiwan (NSC101-2120-M-010-002, NSC100-2314-B-010-030-MY3, NSC101-2321-B-010-009, NSC 101-2911-I-010-503, and NSC 99-3114-B-002-005), the Ministry of Economic Affairs, Taiwan (101-EC-17-A-17-S1-203), and a grant from the National Research Program for Biopharmaceuticals (DOH101-TD-PB-111-NSC014), as well as the National Yang-Ming University/Cheng Hsin General Hospital Grant (101F195CY07). This study was also supported by the Aim for the Top University Plan from the Ministry of Education. The authors declare no conflict of interest.