
Abstract
In human neonates, immature GABAergic interneurons are markedly affected by an excitotoxic insult. While in adults the interest of cell transplantation has been demonstrated in several neurological disorders, few data are available regarding the immature brain. The low survival rate constitutes a strong limitation in the capacity of transplanted neurons to integrate the host tissue. Because i) autophagy is an adaptive process to energetic/nutrient deprivation essential for cell survival and ii) literature describes cross-talks between autophagy and apoptosis, we hypothesized that regulation of autophagy would represent an original strategy to favor long-term survival of GABAergic precursors grafted in the immature neocortex. Morphological, neurochemical, and functional data showed that in control conditions, few grafted Gad67-GFP precursors survived. The first hours following transplantation were a critical period with intense apoptosis. Experiments performed on E15.5 ganglionic eminences revealed that Gad67-GFP precursors were highly sensitive to autophagy. Rapamycin and 3-MA impacted on LC3 cleavage, LC3II translocation, and autophagosome formation. Quantification of Bax, mitochondrial integrity, caspase-3 cleavage, and caspase-3 immunolocalization and activity showed that 3-MA induced a significant decrease of Gad67-GFP precursor apoptosis. In vivo, 3-MA induced, within the first 24 h, a diffuse LC3 pattern of grafted Gad67-GFP precursors, an increase of precursors with neurites, a reduction of the density of caspase-3 immunoreactive cells. A twofold increase in the survival rate occurred 15 days after the graft. Surviving neurons were localized in the cortical layers II–IV, which were still immature when the transplantation was done. Altogether, these data indicate that inhibition of autophagy represents an original strategy to allow GABAergic interneurons to overpass the first critical hours following transplantation and to increase their long-term survival in mice neonates.
Introduction
Neonate brain lesions affect both preterm and term infants and cause motor impairments, cognitive disorders, and neuropsychiatric disabilities (56). Despite marked progress in intensive care, these lesions represent the main cause of cerebral palsy in industrialized countries, and their prevalence has remained stable since the 1950s (22). In the immature brain, the excitotoxic process, resulting from a massive release of glutamate, is a major contributor of neonate brain lesions. In particular, because of its high permeability to calcium, the N-methyl d-aspartate (NMDA) receptor has been shown to play a crucial role on excitotoxicity (34). Several studies performed in animal models showed that glutamate is excitotoxic for γ-aminobutyric acid (GABA)ergic neurons in cell cultures as well as in brain slices from postnatal day 2 (P2) mice (10,36). In addition, Robinson and coworkers showed a massive loss of GABAergic neurons in human cortices after a perinatal brain injury (47). Altogether, these results support the hypothesis that GABAergic interneurons are markedly affected by an excitotoxic insult in the neonatal brain.
Because grafted cells may replace lost or dysfunctional host cells, the transplantation of cell precursors is a promising strategy used for the treatment of neurological disorders (48). However, an important loss of transplanted cells occurs within the first hours/days following the graft, and this high mortality rate constitutes a limitation in the capacity of transplanted neurons to integrate the host tissue (51). Several approaches have been tested to improve the survival of newly grafted cells. For example, because apoptosis has been shown to be a predominant mechanism leading to grafted cell death (1), several groups investigated the effects of the repression of caspases or the overexpression of antiapoptotic members of the B-cell CLL/lymphoma 2 (Bcl2) family to favor survival of grafted cells (7,26). In addition, other strategies focused on the transplantation of immortalized/modified cells or precursors overexpressing trophic factors (14,21). However, all these strategies required molecular modifications of the cells, such as virus transfections that could generate long-term side effects (20).
(Macro)autophagy is a degradation process that mediates the clearance of long-lived proteins and organelles (43). In addition to its roles in maintaining normal cellular homeostasis, autophagy is also an adaptative process of the cells to energetic/nutrient deprivation allowing the generation of substrates essential for cell survival (43). This process requires the formation of double-membrane structures called autophagosomes that will fuse with lysosomes to generate autophagolysosomes (37). Autophagy has been also shown to play a key role in pathological conditions. For example, it acts as an important defense mechanism against infections by sequestering and degrading pathogens (45). On the other hand, several studies reported pathological conditions related with defective or excessive autophagy (6,49,52). For example, in some neurodegenerative diseases, such as Alzheimer disease, autophagy has been shown to be disrupted at the level of the autophagosome clearance (52). At a mechanistic level, it has been demonstrated that there are cross-talks between the autophagic and apoptotic pathways suggesting that unregulated autophagy may result in a switch of the cell to the apoptotic death (29). In particular, the antiapoptotic proteins Bcl2/Bcl-extra large (Bclxl) can interact with both BCL2-associated X protein (Bax) and Beclin-1, two proteins involved in the induction of the mitochondria-dependent apoptotic pathway and in autophagy, respectively (33,59).
Transplantation represents a major stressor event for the grafted precursors (e.g., loss of cell–cell interactions, privation of trophic inputs, energetic deficits, etc.), and apoptosis is clearly associated with the death of grafted precursors, so we hypothesized that i) a regulation of autophagy would represent an original strategy to allow grafted GABAergic precursors to overcome the first critical hours following transplantation and ii) such strategy would optimize the long-term survival of GABAergic precursors transplanted in the immature cortex of mouse neonates.
Materials and Methods
Animals
Naval Medical Research Institute (NMRI) mice purchased from Janvier (Le Genest Saint Isle, France) were kept in a temperature-controlled room (21 ± 1°C) with a 12-h/12-h light/dark cycle (lights on from 7 AM to 7 PM) and free access to food and tap water. Friend Virus B (FVB)-Tg (GadGFP) 45704Swn transgenic mice (#003718) were obtained from The Jackson Laboratory (Bar Harbor, ME, USA). In these transgenic mice, GABAergic interneurons arising from the ganglionic eminences express enhanced green fluorescent protein (eGFP) under the control of the mouse glutamate decarboxylase 1 (Gad1) gene promoter (38). Mice of both sexes were used and the experiments required for NMRI mice: five pregnant adult females, 20 embryonic day 15.5 (E15.5) fetuses, and 220 neonates (P0) obtained from a breeding of 1,000 mice; for Gad67–GFP mice: 23 pregnant adult females and 250 E15.5 fetuses obtained from a breeding of 100 mice. Animal care and manipulations were complied with recommendations issued by the French and European guidelines for the care and use of laboratory animals (Council Directive 86/609/EEC, license No. 21CAE035) and under the supervision of authorized investigators (B.J.G., authorization No. 7687 from the Ministère de l'Agriculture et de la Pêche).
Chemicals
Acrylamide/bis acrylamide (A3574), bovine serum albumin (BSA; A5611), Bradford reagent (B6916), CaCl2 (C4901), 3-[(3-cholamidopropyl)dimethylammonio]-1-propanesulfonate (CHAPS; C9426), cresyl violet (C1791), D-glucose (G5400), dithiothreitol (DTT; D0632), ethylene-diaminetetraacetic acid (EDTA; ED2SS), glutamate (G1251), glutaraldehyde (G5882), glycerophosphate (G9422), Ham's F-12 (56659C), 4-(2-hydroxyethyl)-1-piperazineethanesulfonic acid (HEPES; H3375), Hoechst 33258 (B2883), KCl (P3911), lead citrate (15326), mercaptoethanol (M3148), MgSO4 (M7506), NaCl (S7653), NaF (S7920), NaHCO3 (55761), NaH2PO4 (S8282), nonfat milk (M7409), osmium tetroxide (O5500), phosphatebuffered saline (PBS; P4417), phenylmethanesulfonyl fluoride (PMSF; 93482), protease inhibitor cocktail (P8340), rapamycin (R0395), toluidine blue (P9640), Tris (T1503), Triton X-100 (T9284), trypan blue (T6146), Tween 20 (P1379), 3-methyladenine (3-MA; M9281), and 7-aminoactinomycin D (7-AAD; A9400) were from Sigma Aldrich (Lyon, France). The ratiometric intracellular calcium probe Fura-2 acetoxymethyl ester (AM) (F1201), the pluronic F-127 (P3000NP), the LIVE/DEAD® Viability/Cytotoxicity Kit for mammalian cells (L3224), and the CellTracker Green (C7025) were from Invitrogen (Cergy-Pontoise, France). The neurobasal medium (21103–049) and the B27 supplement (17504044) were from Gibco (Cergy-Pontoise, France). Alexa Fluor 488 donkey anti-rabbit IgG (A-21206), and Alexa Fluor 594 donkey anti-goat IgG (A-11058) were from Invitrogen. Enhanced chemiluminescence (ECL) kit (RPN 2108) for Western blot experiments was from Amersham Biosciences Europe GmbH, (Freiburg, Germany). The JC-1 probe (T-3168) was provided by Molecular Probes/Invitrogen. The 24-well CoStar plates (662160), the 35-mm dishes (100044), and the nylon mesh (490002) were from Greiner Bio-one (Courtaboeuf, France). The substrate CaspACE fluorescein isothiocyanate N-benzyloxycarbonyl-Val-Ala-Asp(O-Me) fluoromethyl ketone (FITC-VAD-FMK) in situ marker (G7461), and the ApoONE homogeneous caspase-3/7 kit (G7760) were from Promega (Charbonnieres les Bains, France). The resin epoxy (21844) and uranyl acetate (21447) were from Polysciences (Le Parray-en-Yvelines, France). Paraformaldehyde (PFA; sc281692) was from Santa Cruz Biotechnology (Heidelberg, Germany), and sodium dodecyl sulfate (SDS; 198123) was from Biosolve (Dieuze, France).
Primary Antibodies
The rabbit polyclonal antibody against cleaved caspase-3 (#9661) was used for immunohistochemistry, whereas the rabbit polyclonal antibody (#9662), which recognizes both caspase-3 and cleaved caspase-3 was used for Western blot experiments, and both were purchased from Cell Signaling Technology (Leiden, Netherlands). Antibodies against Bax (#sc493), Gad65/67 (#sc7513), and glial fibrillary acidic protein (GFAP; #sc6170) were from Santa Cruz Biotechnology. The antibody against microtubule-associated protein 1 light chain 3 b (LC3; Nb2220) was from Novus Biological (Cambridge, UK). By Western blot, this antibody discriminates between LC3I and II, whereas, by immunohistochemistry, LC3I labeling appears diffuse versus dotted for LC3II. Antibodies against cytochrome C (#ab90529), distal-less homeobox 1 (Dlx1; #ab111202), GABA transporter 1 (GAT1; #ab426), and postsynaptic density protein 95 (PSD-95; #ab76115) were from Abcam (Paris, France). Antibodies against GABA (#A2052) and β-actin (#A5441) were from Sigma-Aldrich. The antibody against Beclin-1 (#PD017) was from MBL (Woburn, MA, USA).
Preparation and Treatment of Organotypic Brain Slices from Gad67–GFP Mice
Cortical brain slices were obtained from E15.5 Gad67–GFP mice. At this stage, GABAergic interneuron precursors are actively generated into the ganglionic eminences (30). Briefly, homozygous Gad67–GFP pregnant mice were killed by cervical dislocation at gestational day 16. Embryos were collected by cesarean section of the dam and rapidly placed in HAM F-12. Brains were rapidly removed and placed into an ice-cold artificial cerebrospinal fluid (aCSF) containing (in mM) NaCl, 125; KCl, 3; CaCl2, 2; NaH2PO4, 1.2; MgSO4, 1.2; NaHCO3, 26; d-glucose 10; pH 7.4. Transverse slices (250 μm) were cut at 4°C by using a vibratome Leica VT1000S (Reuil-Malmaison, France), then transferred into 24-well Costar plates containing aCSF and incubated for a 30-min recovery period at 37°C in a humidified incubator under a controlled atmosphere of 5% CO2/95% air. Then, the slices were washed with fresh aCSF and treated for 6 h at 37°C with 200 nM rapamycin or 30 mM 3-MA. The model of cultured brain slices from E15.5 embryos was used i) to characterize the impact of rapamycin and 3-MA on autophagy modulation in ganglionic eminences and ii) to pretreat GABAergic precursors in situ before their dissociation and transplantation.
Preparation of Gad67–GFP Precursor Suspensions and Standardization of the Transplantation Protocol
Suspensions of Gad67–GFP precursors were prepared from E15.5 fetuses. Glutamic acid decarboxylase (Gad) immunohistochemistry (1:200) confirmed the presence of GABAergic precursors generated from ganglionic eminences at this developmental stage (Fig. 1A–C). At high magnification, two migratory routes and migrating precursors were clearly visualized in the developing neocortex (Fig. 1A, B). Briefly, 250-μm transverse sections were done using a VT1000S vibratome. As illustrated in Figure 1D after a cresyl violet staining of the slice, ganglionic eminences were microdissected under a Leica stereomicroscope (Rueil-Malmaison, France) and immediately placed in neurobasal/B27 medium. Ganglionic eminences from four fetuses with no gender distinction were gently dissociated by mechanical trituration (20 passages in a Pasteur pipette) in 1 ml neurobasal/B27 medium. Cell suspensions were pooled and centrifuged 2 min at 200 × g, rinsed twice in neurobasal/B27 medium, and resuspended in 20 μl of neurobasal/B27 medium in the absence or presence of 30 mM 3-MA. An aliquot was collected for cell quantification, and cell density was fixed at 100,000 precursors/μl prior to transplantation. In order to standardize the injection point of precursors into the host animals, newborn mice (P0), previously anesthetized by isoflurane inhalation, were subjected to 2 μl intracranial injections of 0.4% trypan blue solution in 0.8% NaCl, 0.6% KCl using a 10-μl Hamilton syringe (Reno, NV, USA). Each pup was rapidly sacrificed, and brains were immediately sliced in 250-μm sections and observed under a light microscope in order to characterize the position of the injection sites. Histological analysis revealed that the injection site was located in the somatosensory cortex (Fig. 1E). The following stereotaxic coordinates (relative to the λ structure) were selected: AP −2 mm, ML +1 mm, DV −2 mm (Fig. 1F). Before transplantation, an aliquot of the precursor suspension was labeled with CellTracker Green and 7-AAD to determine the viability rate of transplanted precursors. No colocalization of both signals was found (Fig. 1G–K). The cell suspensions consisted of 79 ± 3% living cells (Fig. 1K).

Standardization of the microdissection and injection procedures used for transplanting GABA precursors obtained from Gad67–GFP E15.5 ganglionic eminences and characterization of the survival rate of cell suspensions. (A–C) Microphotographs showing at different magnifications, the γ-aminobutyric acid (GABA) precursors labeled by immunohistochemistry using a glutamate decarboxylase 65/67 (Gad65/67) antibody. Arrows indicate the tangential migratory routes used by the precursors to reach the neocortex. (D) Cresyl violet staining visualizing the ganglionic eminences dissected at E15.5 (dashed circle). (E) Visualization with trypan blue solution of the injected cortical area in P0 neonates. (F) Position of the injection point corresponding to the stereotaxic coordinates AP −2 mm, ML +1 mm, DV −2 mm relatively to bregma in mice neonates. (G–J) High (insets) and low magnification microphotographs visualizing the total population of dissociated cells by phase contrast, the living cells labeled with CellTracker Green (arrows) and the dead cells labeled with 7-aminoactinomycin D (7-AAD; arrowheads). The overlay of the three signals visualizes the absence of 7-AAD/CellTracker (CellT) Green colabeling. (K) Quantification of the proportion of living precursors within the cell suspension. GFP, green fluorescent protein.
Quantification of the Live/Dead Ratio in Gad67–GFP Precursor Suspensions
The survival of dissociated precursors from the ganglionic eminences was visualized and quantified just prior to transplantation using the LIVE/DEAD® Viability/Cytotoxicity Kit for mammalian cells according to the instruction manual. Briefly, cells were washed with aCSF and then incubated for 15 min with the solution containing 2 μM calcein (producing green fluorescence in living neurons) and 4 μM ethidium homodimer (producing orange fluorescence in the nuclei of dead cells). Images were acquired in a TIF format using a Leica DMI 6000B microscope. Green fluorescence was visualized at the excitation and emission wavelengths 485 and 530 nm, and orange fluorescence at 530 and 585 nm, respectively. For cell counting, images were subsequently opened in the Mercator Software (Explora Nova, La Rochelle, France), and regions of interest (ROI) were drawn. Afterward, a counting frame was defined into the ROI. The number of calcein- and ethidium-positive cells was expressed as a percentage of the total number of precursors present in the ROI.
Quantification of the Density of Gad67–GFP Grafted Cells, Neurite Length, and Primary Neurite Number
For measurement of Gad67–GFP cell density, images were acquired and saved in a TIF format with a confocal laser-scanning microscope (Noran Instruments, Middleton, WI, USA) using INTERVISION software (Noran Instruments). Images were subsequently opened in the Mercator Software, and ROI was drawn. Afterward, a counting frame was defined in the ROI, and a threshold was set in order to differentiate GFP-positive cells from the background. By a segmentation process, the computer calculated the number and the cumulated area of objects within the ROI, giving access to cell number and cell density, respectively. Quantification was done at different stages ranging from 6 h to 30 days posttransplantation. For measurement of Gad/GFP-positive processes, a referent focal plane corresponding to the Gad/GFP cell body was defined. Then, Z-series images were acquired with a 2-μm step on both sides of the referent plane and saved in TIF format. Afterward, acquired images were compiled for 3D reconstruction and quantification of the neurite number and neurite length.
Immunohistochemistry
Brain slices from E15.5 ganglionic eminences and P0 to P30 animals were previously fixed overnight with 4% PFA in PBS and incubated overnight at 4°C with different primary antibodies diluted in incubation buffer [PBS containing 1% bovine serum albumin (BSA) and 3% Triton X-100]. Then, the slices were rinsed twice with PBS for 20 min and incubated with the same incubation buffer containing the appropriate secondary antibody. Cell nuclei were visualized by incubating the slices for 5 min with 1 μg/ml Hoechst 33258 in PBS. Fluorescent signals were observed with a Leica DMI 6000B microscope. For confocal microscopy, images were acquired using the Leica laser-scanning confocal image system TCS SP2 AOBS. For immunohistochemistry experiments, all primary antibodies were used at 1/200, and all secondary antibodies were used at 1/400. The specificity of the immunoreactions was controlled by substituting the primary antibodies by PBS.
Intracellular Calcium Measurements
Transverse slices obtained from grafted P5 mice were incubated for 15 min in aCSF containing 10 μM Fura-2 AM and 0.03% pluronic F-127. The slices were then washed twice for 5 min in fresh aCSF, and each slice was transferred in a 35-mm dish containing 1 ml of aCSF and immobilized using a nylon mesh. The temperature of the aCSF was kept constant at 37°C, and the slice was rinsed with aCSF. A twofold concentrated solution of glutamate prepared in aCSF was perfused in an equal volume of aCSF bathing the slice in order to reach a final concentration of 400 μM (10). The fluorescent signals associated with calcium-free and calcium-bound Fura-2 were measured by alternatively exciting the slices at 340 and 380 nm using a fluorescent Leica DM microscope equipped with a rapid shutter wheel. The emitted fluorescence was collected at 510 nm, and a ratio of both signals was calculated by the Metamorph software (Roper Scientific, Evry, France). The data were exported to the biostatistic software Prism (GraphPad, Inc., San Diego, CA, USA), which was used to compute the maximal fluorescence intensity (MFI) and the area under the curve (AUC).
Visualization and Quantification of the Mitochondrial Integrity
Mitochondrial membrane potential was observed by using the ratiometric probe JC-1. In healthy cells, the intact membrane potential allows the lipophilic dye JC-1 to enter into the mitochondria where it accumulates and aggregates, producing an intense orange signal. In cells where the mitochondrial membrane potential collapses, the monomeric JC-1 remains cytosolic and stains the cytosol in green. E15.5 ganglionic eminences were treated for 6 h at 37°C with 200 nM rapamycin or 30 mM 3-MA, incubated for 30 min with 3 μl/ml JC-1, and finally washed twice for 5 min with PBS at the same temperature. Fluorescence was visualized immediately without prior fixation at the excitation 485 nm and emission 530 nm (green) wavelengths and the excitation 550 nm and emission 590 nm (orange) wavelengths. Green and orange signals were acquired and saved in TIF format using a computer-assisted image analysis station Metamorph. The fluorescence intensity profiles corresponding to the nonaggregated and aggregated stages of the JC-1 probe were used to quantify the 590/530 ratio in the ROI. For each fluorescent signal, a background level was defined in a negative region of the images.
Caspase Activity Assays
For caspase-3 activity measurements, E15.5 ganglionic eminences were resuspended in 200 μl of ice-cold hypotonic lysis buffer (HEPES 50 mM, NaCl 100 mM, DTT 10 mM, CHAPS 0.1%, EDTA 1 mM), and 10 μl were collected for immediate determination of protein content by Bradford assay. Twenty micrograms of protein were incubated at 30°C with 100 μl of caspase-3 buffer containing 1 μl of the caspase substrate (Z-Asp-Glu-Val-Asp) 2-Rhodamine 110 (Z-DEVD-R110) provided within the ApoONE homogeneous caspase-3/7 kit. Fluorescence intensity was quantified every 5 min for 2 h at excitation and emission wavelengths of 485 and 520 nm, respectively, using a Chameleon plate reader (Mustionkatu, Turku, Finland).
In Situ Labeling of Caspase Activity
Caspase activity was detected and visualized using the substrate CaspACE FITC-VAD-FMK in situ marker. This fluorescent caspase inhibitor penetrates within the cell, where it binds to activated caspases, thereby serving as an in situ marker of apoptosis. Briefly, slices were incubated with 10 μM CaspACE FITC-VADFMK for 20 min at 37°C, and then washed three times with PBS. Green fluorescence was visualized at the excitation and emission wavelengths 485 and 520 nm, respectively. CaspACE FITC-VAD-FMK fluorescent probe was used on fresh brain slices. Some of the slices exposed to CaspACE FITC-VAD-FMK were fixed with 4% PFA in PBS overnight and then used for LC3 immunohistochemical studies.
Electron Microscopy
Ultrastructural studies were carried out according to standardized protocols. Briefly, ganglionic eminences previously exposed to aCSF alone, 200 nM rapamycin, or 30 mM 3-MA were fixed in a 3% glutaraldehyde solution, postfixed with osmium tetroxide, and embedded in resin epoxy. Semithin sections were stained with toluidine blue. Ultrathin sections were contrasted with uranyl acetate and lead citrate and examined under a PHILIPS CM10 electron microscope (Amsterdam, Netherlands).
Western Blot Analysis
After a 6-h treatment with 200 nM rapamycin or 30 μM 3-MA, ganglionic eminences were washed with fresh aCSF and homogenized in 250 μl of lysis buffer [50 μM HEPES, pH 7.5; 150 mM NaCl; 10 mM ethylenediaminetetraacetic acid (EDTA); 10 mM glycerophosphate; 100 mM natrium fluoride; 1% Triton X-100; 1 mM phenylmethylsulfonyl fluoride (PMSF) and protease inhibitor cocktail]. After centrifugation of the homogenate (20,000 × g × 15 min), the supernatants were used for Western blotting. Fifty micrograms of proteins were suspended in Laemmli buffer (100 mM HEPES, pH 6.8; 10% β-mercaptoethanol; 20% SDS) and boiled for 5 min. They were then loaded onto 15% SDS-polyacrylamide gels. After electrophoresis, proteins were transferred to nitrocellulose membranes (10600003; Amersham Biosciences Europe GmbH). Membranes were then incubated with the blocking solution [1× Tris-buffered saline (TBS; Tris 10 mM; Nacl 150 mM; pH 8); 0.05% Tween 20; 5% nonfat milk or 5% BSA] at room temperature for 1 h and incubated overnight with primary antibodies raised against Bax, Beclin-1, LC3, and caspase-3. Primary antibodies were used at 1/1,000. After incubation with the corresponding secondary antibodies (1/5,000) coupled to peroxidase (Santa Cruz Biotechnology), proteins were visualized using an enhanced chemiluminescence (ECL) Plus immunoblotting detection system (Amersham Biosciences Europe GmbH). The intensity of the immunoreactive bands was quantified using a blot analysis system (BioRad Laboratories, Marne la Coquette, France), and data were normalized with actin.
Statistical Analysis
For calcimetry experiments, comparisons of the MFI and AUC were done using an unpaired t test. For comparison of the short-term effects of 3-MA in vivo on neurite outgrowth and on apoptotic cell density, the long-term effects of 3-MA on grafted cell survival, the effects of rapamycin or 3-MA on LC3 cleavage, Beclin-1, Bax, and cleaved caspase-3 levels by Western blots, and the statistical analysis were done using the unpaired t test. For quantification of the mitochondria integrity, the stage-dependent comparison of neurite length, cleaved caspase-3 immunoreactivity and density of grafted cells, and the statistical analysis were done by using a one-way ANOVA followed by Tukey's post hoc test. For comparison of the distribution of primary neurites per grafted cells, statistical analysis was done using the chi-square test. For all these tests, the a level was fixed at 5%.
Results
Morphological Characterization and Survival of Transplanted Precursors from Gad67–GFP Ganglionic Eminences
The morphology and the density of grafted precursors were quantified within the first 30 days following transplantation (Fig. 2). In the first 6 h, precursors were aggregated in the injection site, and they were characterized by a round shape and an absence of neurites (Fig. 2A). Two days after the transplantation (P2), cell density was reduced (Fig. 2B, H). Grafted cells, which were characterized by a fusiform shape, invaded the cortical plate (Fig. 2B). Most of the precursors had no processes or presented a single short neurite (Fig. 2D, I). At P5, the density of grafted cells was strongly reduced (Fig. 2H). Regarding neurite length, no marked differences were observed when compared to P2 (Fig. 2E, I). From P5 to P30, the neuritic growth dramatically increased (Fig. 2I), and most of the Gad67–GFP neurons were characterized by a complex dendritic arborescence (Fig. 2F, G) and varicose fibers (Fig. 2G, insert). The density of grafted cells did not significantly change from P5 to P15 (Fig. 2H) and remained unchanged from P15 to P30 (data not shown). Quantification of the number of primary neurites was performed after 3D reconstruction (Fig. 3A–C). Chisquared analysis revealed no difference in the distribution of neurite number between P2 and P5 (Fig. 3D). In contrast, at P15 and P30, cell morphology was significantly different from P2, and all surviving neurons were multipolar (Fig. 3C, D). Altogether, these results suggested that cell loss massively occurred within the first days following transplantation. To test this hypothesis, apoptotic cells were visualized using cleaved caspase-3 immunohistochemistry (Fig. 4). From 6 h to P2, GFP under the Gad promoter was poorly detected in transplanted cells, so the precursors were labeled with the CellTracker Green dye, which is stable for up to 5 days in vivo (33). Double labeling showed that several grafted precursors were caspase-3 positive 6 h (Fig. 4A–C) and 5 days (Fig. 4D–F) after cell transplantation. Quantification of colabeled cells indicated that the proportion of apoptotic cells was similar at 6 h and P5 (Fig. 4G). In contrast, from P15, all the surviving grafted Gad67–GFP neurons were negative for cleaved caspase-3 (Fig. 4G).

Morphometric characterization of the transplanted Gad67–GFP precursors in the neocortex of mice neonates. (A–G) Visualization of grafted precursors at low and high magnifications at 6 h, P2, P5, P15, and P30 (P = days after grafting). Note the intense development of the neuritic network and the presence of varicose fibers from P15 (inset F). (H) Quantification of the density of Gad67–GFP grafted cells in the mice neocortex from 6 h to 15 days posttransplantation (30 days was not different from 15 days). ns, not statistically different. Each value represents the mean (±SEM) of nine pups from three independent experiments. ***p lt; 0.001 versus 6 h using an one way ANOVA + Tukey's post hoc test. (I) Quantification of neurite lengths in grafted cells from 6 h to 30 days posttransplantation. ***p lt; 0.001 versus 6 h using a one-way ANOVA + Tukey's post hoc test. Each value represents the mean (±SEM) of at least 20 cells from three independent experiments.

Time course quantification of primary neurites in transplanted Gad67–GFP precursors. (A–C) 2D microphotograph and 3D reconstruction of a Gad67–GFP neuron showing an additional primary neurite after a Z-stack acquisition. Numbers refer to number of neurites. (D) Chi-squared statistical analysis of the distribution of primary neurites per grafted cells from 2 to 30 days posttransplantation. Distribution of primary neurite number was quantified from 50 cells per stage.
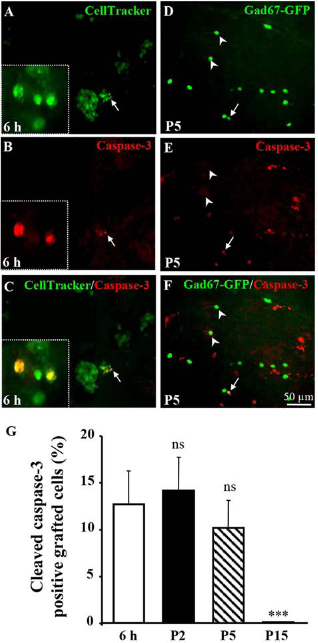
Visualization and quantification of apoptotic grafted cells. (A–C) Visualization of grafted Gad67–GFP cells (previously labeled with CellTracker Green) and cleaved caspase-3 (red) immunoreactive cells 6 h after the transplantation. Overlay and arrows visualize colabeled cells. Insets: high magnification microphotographs showing two apoptotic grafted cells. (D–F) Visualization of grafted Gad67–GFP cells and cleaved caspase-3 immunoreactive cells 5 days after the transplantation. Overlay and arrows visualize colabeled cells. Arrowheads indicate caspase-3-negative grafted cells with short processes. (G) Quantification of the proportion of grafted cells immunoreactive for the cleaved caspase-3 from 6 h to P15. ns, not statistically different. Each value represents the mean (±SEM) of five pups per stage from at least three independent experiments. ***p lt; 0.001 versus 6 h using a oneway ANOVA + Tukey's post hoc test.
Phenotypic and Functional Characterization of Grafted Cells from Gad67–GFP Ganglionic Eminence
An immunohistochemical study was performed to characterize the proportion of GABAergic neurons within the graft (Fig. 5). At P2, 68 ± 3% of the transplanted cells were immunoreactive for GABA (Fig. 5A–C–G) while very few precursors (6 ± 4%) were GFAP positive (Fig. 5D–G), and 22 ± 3% of the grafted cells were not immunoreactive for GABA or GFAP (Fig. 5G). From 5 days posttransplantation, Gad67–GFP expressing cells were easily detected (data not shown), and several double labeling experiments were performed to determine whether grafted GABAergic neurons presented characteristics of mature neurons. Confocal microscopy revealed that GAT1, a GABA transporter, colocalized with the cell bodies and the processes of grafted Gad67–GFP cells (Fig. 6A–D). High-resolution acquisition revealed the presence of numerous dendritic spines along the grafted Gad67–GFP neurons, a morphological indication of synapses (Fig. 6E). This result was supported by PSD-95 immunolabeling, which revealed a close association of the fluorescent signal with the dendritic spines (Fig. 6F), reinforcing the notion of a functional integration of the grafted cells into the host tissue. Consistent with these data, cultured brain slices from P5-grafted pups were incubated with the ratiometric fluorescent calcium probe Fura2 (Fig. 7). Overlapping of Fura2 and GFP signals indicated that several grafted Gad–GFP neurons (arrowheads), as well as host cells (arrows), loaded the calcium probe (Fig. 7A–C). Administration of glutamate (400 μM) induced a type-dependent increase of intracellular calcium levels, suggesting that grafted Gad67–GFP cells expressed functional glutamate receptors (Fig. 7D–F; arrowheads).

Characterization of the GABAergic phenotype of grafted cell 2 days after the transplantation. (A–C) Visualization of CellTracker Green precursors and GABA immunoreactive cells (red) in brain slices 2 days after the transplantation. Arrows indicate colabeled cells. Arrowheads indicate GABA immunoreactive cells from the host tissue. (D–F) Visualization of CellTracker Green precursors and glial fibrillary acidic protein (GFAP) immunoreactive cells (red) in brain slices 2 days after the transplantation. Note that most of the precursors are GFAP negative. Arrowheads indicate GFAP immunoreactive fibers from the host tissue. (G) Quantification of the proportion of CellTracker Green precursors immunoreactive for GABA or GFAP.

Neurochemical characterization of the integration of Gad67–GFP grafted cells in the host neocortex. (A–C) High magnification photographs acquired by confocal microscopy showing the GABA transporter 1 (GAT1) immunolabeling in Gad67–GFP grafted cells 15 days after the transplantation. Arrows indicate GAT1 puncta (A) colocalizing with Gad67–GFP neurites (B, C). (D) Low magnification photograph showing the overlap in yellow of the GAT1 immunolabeling and the GFP signal. (E) Microphotograph visualizing dendritic spines (arrows) in a Gad67–GFP grafted cells 15 days after the transplantation. (F) High magnification photographs showing the labeling of the synaptic marker postsynaptic density 95 (PSD-95; red) and the GFP signal in a neuritic process from a grafted Gad67–GFP cell. Note the presence of PSD-95 immunolabeling along the process and at the extremity of the spines (arrows).

Effect of glutamate on intracellular calcium levels in grafted cells. (A–C) Microphotographs showing Gad67–GFP precursors and Fura2-loaded cells in the neocortex of cultured brain slices 5 days after the transplantation. The overlay shows grafted (arrowheads) and host (arrows) cells, which loaded the calcium probe. (D) Microphotographs visualizing the increase in intracellular calcium levels in both grafted and host cells after exposure to glutamate (400 μM) over 5 min 30 s. The color bar is representative of low (blue) and high (yellow) levels of calcium. (E) Mean recording quantifying intracellular calcium levels after exposure of Gad67–GFP cells to glutamate (400 μM). (F) Statistical analysis of the area under the curve (AUC) and the maximal fluorescence intensity (MFI) quantified in Gad67–GFP cells in the absence (Ctrl) or presence of glutamate (400 μM). Each value represents the mean (±SEM) of at least 20 cells from three independent experiments. *p lt; 0.05; **p lt; 0.01 versus control with the unpaired t test.
Effects of Rapamycin and 3-MA on the Regulation of Autophagy in Precursors from Gad67–GFP Ganglionic Eminence
Prior to testing the effect of autophagy on the apoptotic death of grafted cells, we first investigated if autophagy regulators impacted precursors from Gad67–GFP ganglionic eminences. Western blot experiments showed that rapamycin (200 nM), an autophagy activator (5), significantly increased the level of LC3II in E15.5 ganglionic eminences (Fig. 8A). On the contrary, 3-MA (30 mM), an autophagy inhibitor (28), markedly reduced LC3II levels (Fig. 8A). Similarly, quantification of Beclin-1 revealed a slight, but not significant, increase in the protein levels when ganglionic eminences were treated by rapamycin (Fig. 8B), while, on the contrary, 30 mM 3-MA induced a reduction by 33 ± 5% of Beclin-1 expression (Fig. 8B). Dlx-1/LC3 colabeled cells confirmed the GABAergic lineage of the precursors present in the ganglionic eminence at E15.5 (Fig. 8C). In control conditions, LC3 immunohistochemistry revealed a strong labeling in the lateral ganglionic eminences (Fig. 8D). Several cells presented a dotted fluorescent pattern. When ganglionic eminences were pretreated with 3-MA, the immunolabeling appeared clearly diffuse (Fig. 8E). In contrast, a 6-h treatment with rapamycin (200 nM) resulted in a marked dotted pattern (Fig. 8F). Electron microscopy was performed to determine if Western blot and immunohistochemical data were correlated with modifications of autophagosome formation. Under control conditions, few autophagosomes, characterized by double-membrane vesicles containing heterogeneous sequestered materials, were observed within precursors of the ganglionic eminences (Fig. 9A, B; arrow). Exposure of E15.5 to rapamycin (200 nM) strongly altered the ultrastructural morphology of cells that was characterized by a marked increase in autophagosomes and preautophagosomes (Fig. 9C, D; arrows). In contrast, after a 6-h exposure to 3-MA (30 mM), autophagosomes were not detected in the lateral ganglionic eminence (Fig. 9E, F).

Effects of rapamycin and 3-MA on LC3 cleavage and immunolocalization in ganglionic eminences from E15.5 Gad67–GFP mice. (A) Quantification by Western blot of the effects of rapamycin (Rapa; 200 nM) and 3-methyladenine (3-MA; 30 mM) on microtubule-associated protein 1 light chain 3 β (LC3)(I/II) levels after a 6-h treatment. (B) Quantification by Western blot of the effects of rapamycin (200 nM) and 3-MA (30 mM) on Beclin-1 levels after a 6-h treatment. (C–F) Visualization by confocal microscopy of the localization of LC3 and distal-less homeobox 1 (Dlx1) immunoreactivities. The Dlx1 protein is both cytosolic and nuclear and colocalized with LC3 (arrows; C). Under control condition, cells from E15.5 ganglionic eminences present a diffuse or dotted LC3 immunolabeling (D). Note the modification of the LC3 immunolabeling (puncta vs. diffuse) after a 6-h treatment with 30 mM 3-MA (E) or 200 nM rapamycin (F). Inset, visualize a ganglionic eminence at low magnification. Each value represents the mean (±SEM) of three independent experiments. *p lt; 0.05 versus control with the unpaired t test.

Effects of rapamycin and 3-MA on autophagosome formation in ganglionic eminences from E15.5 Gad67–GFP mice. (A, B) Electron microscopy photographs at low and high magnifications obtained from ganglionic eminences cultured in control conditions. (C, D) Electron microscopy photographs at low and high magnifications obtained from ganglionic eminences treated for 6 h with 200 nM rapamycin. (E, F) Low and high magnification electron microscopy photographs obtained from ganglionic eminences treated for 6 h with 30 mM 3-MA. The dotted squares (A, C, E) visualize the areas detailed at a higher power in B, D, F. Arrows indicate preautophagosomes and autophagosomes. m, mitochondria; n, nucleus.
Effect of Rapamycin and 3-MA on the Regulation of Apoptosis in Precursors from Gad67–GFP Ganglionic Eminences
Cross-talk has been described between autophagy and apoptosis (16), so we investigated the impact of rapamycin and 3-MA on the apoptotic cell death in E15.5 ganglionic eminences. Western blot experiments showed that a 6-h treatment with rapamycin (200 nM) resulted in a small, but nonsignificant, increase in the caspase-3 cleavage, while, in contrast, 3-MA (30 mM) significantly reduced the level of cleaved caspase-3 (Fig. 10A). Visualization of apoptotic cells in ganglionic eminences by immunohistochemistry showed numerous cleaved caspase-3 immunoreactive cells after 6 h of culture in control condition (Fig. 10B). A similar distribution pattern was found when cells were incubated in the presence of rapamycin (200 nM) (Fig. 10C). On the contrary, as found using the Western blot approach, 3-MA (30 mM) strongly reduced the density of cleaved caspase-3 immunoreactive cells in the ganglionic eminences (Fig. 10D). Overlay of fluorescent signals from LC3 immunohistochemistry and FITC-VAD-FMK, a fluorescent substrate of caspases, confirmed that the antiapoptotic effects of 3-MA (30 mM) observed in the ganglionic eminences was associated with a diffuse LC3 immunolabeling (Fig. 11A–C). In addition, fluorimetry experiments showed that 3-MA (30 mM) induced a significant reduction (22 ± 1%) of the caspase-3 activity (Fig. 11D). Consistent with these data, rapamycin (200 nM) induced a slight, but not significant, increase in Bax expression after a 6-h treatment (Fig. 11E), while 3-MA (30 mM) reduced by 28 ± 2% of the level of the Bcl2 homology 3 (BH3)-only proapoptotic protein (Fig. 11E).

Effects of rapamycin and 3-MA on caspase-3 cleavage in ganglionic eminences from E15.5 Gad67–GFP mice. (A) Visualization and quantification by Western blot of the cleaved caspase-3 fragment (CCasp-3) after a 6-h culture of ganglionic eminences in control, 200 nM rapamycin, and 30 mM 3-MA conditions. (B–D) Microphotographs visualizing by immunohistochemistry the cleaved caspase-3 in ganglionic eminences cultured in control, 200 nM rapamycin, and 30 mM 3-MA conditions. GE, ganglionic eminence. Each value represents the mean (±SEM) of three independent experiments. *p lt; 0.05 versus control with the unpaired t test.

Effects of rapamycin and 3-MA on caspase-3 activity and Bax expression in ganglionic eminences from E15.5 Gad67–GFP mice. (A–C) Photographs visualizing the LC3 immunoreactivity and the fluorescein isothiocyanate N-benzyloxycarbonyl-Val-Ala-Asp(O-Me) fluoromethyl ketone (FITC-VAD-FMK) signal in ganglionic eminences after a 6-h culture in control, 200 nM rapamycin, and 30 mM 3-MA conditions. Note that the diffuse pattern of LC3 immunolabeling is associated with a low caspase activity. (D) Quantification by fluorimetry of the effects of 200 nM rapamycin and 30 mM 3-MA on caspase-3 activity. (E) Quantification by Western blot of the effects of 200 nM rapamycin and 30 mM 3-MA on B-cell CLL/lymphoma 2 (BCL2)-associated X protein Bax expression. Each value represents the mean (±SEM) of three independent experiments. **p lt; 0.01 versus control with the unpaired t test.
The ratiometric probe JC-1 was used to visualize and to quantify the effect of rapamycin and 3-MA on the mitochondrial integrity (Fig. 12A–C). A 6-h treatment with rapamycin (200 nM) markedly reduced the proportion of healthy mitochondria visualized in red (aggregated form of JC-1, 590 nm) (Fig. 12A, B). In contrast, 3-MA (30 mM) increased the density of healthy mitochondria in ganglionic eminences (Fig. 12C). The ratiometric quantification of the aggregated versus cytosolic forms of JC-1 showed that rapamycin tended to exacerbate mitochondrial suffering, while 3-MA significantly favored the mitochondrial integrity (Fig. 12D). Consistent with these data, the cytochrome C immunolabeling in control condition was both diffuse and dotted (Fig. 12E). A similar fluorescent pattern was found for rapamycin (data not shown), while 3-MA induced a dotted cytochrome C labeling (Fig. 12F).

Effects of rapamycin and 3-MA on the mitochondria integrity in ganglionic eminences from E15.5 Gad67–GFP mice. (A–C) Visualization of the aggregated (590 nm) and nonaggregated (530 nm) forms of the mitochondrial probe JC-1 in control, 200 nM rapamycin, and 30 mM 3-MA conditions. (D) Ratiometric quantification of the fluorescent signals associated with the aggregated (590 nm) and nonaggregated (530 nm) forms of the mitochondrial probe JC-1 in control condition and after a 6-h treatment with 200 nM rapamycin and 30 mM 3-MA. (E, F) Visualization by confocal microscopy of the cytochrome C (Cyt C; red) immunolabeling in control condition and after a 6-h treatment with 30 mM 3-MA. Note the different pattern of labeling (diffused vs. puncted), suggesting that 3-MA favored the mitochondria integrity. Each value represents the mean (±SEM) of three independent experiments. *p lt; 0.05 versus control using a one-way ANOVA + Tukey post hoc test.
Effect of 3-MA on Long-Term Survival of Grafted Precursors from Gad67–GFP Ganglionic Eminences
On one hand, rapamycin appeared to be proapoptotic for Gad67–GFP precursors, while on another hand, 3-MA was able to favor mitochondrial integrity and to reduce Bax expression, caspase-3 cleavage, as well as caspase-3 activity. We therefore focused on the effect of a 3-MA treatment on the survival rate of grafted GABAergic precursors (Fig. 13). Six hours after the transplantation, grafted precursors from the control condition were characterized by a dotted LC3 fluorescent pattern (Fig. 13A, C; arrows). When cells were pretreated and coinjected with 3-MA (30 mM), several grafted cells had a diffuse LC3 labeling (arrow heads), while a dotted pattern (asterisk) was observed in host cells (Fig. 13B, D). Twenty-four hours after the transplantation, an intense LC3 dotted pattern was observed both in grafted (arrows) and host (asterisks) cells in the control condition (Fig. 13E, G). Some grafted cells presented a fusiform shape and small neurites (arrowheads). In contrast, in the 3-MA pretreated and coinjected condition, the LC3 immunolabeling remained diffuse in grafted cells, and several grafted cells presented a fusiform shape and small neurites (Fig. 13F–H; arrowheads). Surprisingly, numerous host cells also presented a diffuse LC3 pattern, while few had a dotted pattern (Fig. 13H; asterisk). 3-MA significantly increased the proportion of cells presenting small neurites 24 h after the transplantation (Fig. 13I), while no significant effect of 3-MA was found regarding the neurite length (Fig. 13J). The effect of 3-MA on apoptotic death was investigated by visualizing and quantifying the cleaved caspase-3 immunoreactivity (Fig. 14). In the control condition, 6 h after the transplantation, 15 ± 3% of the grafted cells were immunoreactive for the cleaved caspase-3. This proportion was similar 24 h after the graft (Fig. 14A). Interestingly, a cleaved caspase-3 immunoreactivity was also retrieved in host cells after 24 h (Fig. 14B; asterisk). 3-MA treatment significantly reduced the proportion of caspase-3 immunoreactive cells both 6 and 24 h after the transplantation (Fig. 14A, C–E). This effect of 3-MA also affected the caspase-3-positive host cells (Fig. 14C). Figure 15 shows the effects 5 and 15 days after transplant. Five days after the transplantation, the density of grafted cells in the neocortex was significantly increased (34 ± 8%) in mouse neonates transplanted with precursors treated by 30 mM 3-MA (Fig. 15A, B, E). Most of the transplanted cells were localized in the differentiating layers I–IV, and no modifications were found in terms of cell morphology (Fig. 15A, B). The beneficial effect of 3MA (30 mM) on the density of Gad67–GFP neurons persisted over time and was still found 15 days after the transplantation (Fig. 15C, D). As observed at P5, surviving Gad67–GFP were localized in the superficial cortical layers (Fig. 15C, D). Quantification showed an 80% increase of cell density in the 3-MA group (Fig. 15E).

Effect of a 3-MA pretreatment and coinjection on the LC3 immunoreactivity in grafted Gad67–GFP precursors. (A, B) Visualization of the grafted precursors labeled with CellTracker Green in control (A) and 3-MA (B) conditions 6 h after the transplantation. (C, D) Visualization of the LC3 immunoreactive pattern of grafted precursors in control (C) and 3-MA (D) conditions 6 h after the transplantation. Note the dotted (arrows) and diffuse (arrowheads) patterns of LC3 labeling in control and 3-MA conditions, respectively. (E, F) Visualization of the grafted precursors labeled with CellTracker Green in control (E) and 3-MA (F) conditions 24 h after the transplantation. (G, H) Visualization of the LC3 immunoreactive pattern of grafted precursors in control (G) and 3-MA (H) conditions 24 h after the transplantation. Arrows indicate grafted precursors presenting a dotted pattern. Arrowheads indicate grafted precursors presenting a diffuse pattern. Note that, contrasting with the control condition, few host cells presented a dotted LC3 labeling in the 3-MA conditions (asterisks). (I, J) Quantification of the effect of 3-MA on the number of cells with neurites (I) and neurite length (J) 6 and 24 h after transplantation. Each value represents the mean (±SEM) of 20 cells from five independent experiments. *p lt; 0.05 versus control with the unpaired t test.

Effect of a 3-MA pretreatment and coinjection on the caspase-3 immunoreactivity in grafted Gad67–GFP precursors. (A) Quantification of the effect of 3-MA on the density of caspase-3 immunoreactive cells. *p lt; 0.05 versus control with the unpaired t test. Each value represents the mean (±SEM) of 20 cells from five independent experiments. (B, C) Visualization at low magnification of the caspase-3-negative (arrows) and -positive (arrowheads) grafted precursors 24 h after transplantation in control (B) and 3-MA (C) conditions. Note that in the control condition, caspase-3-positive cells were also retrieved in host cells (asterisk). (D, E) Details of caspase-3 immunoreactive grafted cells in the 3-MA condition (dotted square).

Effects of 3-MA on long-term survival of Gad67–GFP precursors transplanted in mice neonates. (A, B) Visualization of Gad67–GFP precursors in the neocortex 5 days after the transplantation. Precursors were dissociated and injected in artificial cerebrospinal fluid (aCSF) in the absence (Ctrl) or in the presence of 30 mM 3-MA. Note that surviving precursors are localized in the superficial cortical layers. (C, D) Visualization of Gad67–GFP precursors in the neocortex 15 days after the transplantation. Precursors were dissociated and injected in aCSF in the absence (Ctrl) or in the presence of 30 mM 3-MA. Circled numbers indicate grafted precursors in the neocortex at low magnification. Insets: High-magnification microphotographs showing some Gad67–GFP neurons. (E) Quantification of the effect of 3-MA on the density of Gad67–GFP grafted cells in the mice neocortex 5 and 15 days after transplantation. Each value represents the mean (±SEM) of nine pups per group. *p lt; 0.05 versus control with the unpaired t test.
Discussion
The First Hours/Days Posttransplantation: A Critical Period for the Survival of Gad67–GFP Interneurons in the Immature Neocortex
Cell or tissue transplantation is a strategy already applied in several pathologies to supply cell loss and prevent functional deficits. For example, the transplantation of embryonic ventral mesencephalic cells as a potential alternative means of restoring dopamine levels in Parkinson's patients has been applied in humans (51). In the same way, transplantation of neural stem cells has been shown to improve functional recovery after spinal cord injury in rats (26,42). However, the restricted ability of grafted cells to survive and to properly integrate the host tissue represents a major limitation of the transplantation efficacy. Indeed, data from Sortwell et al. indicated that only 5% to 10% of dopaminergic precursors effectively survived after transplantation in the striatum (51). Numerous reasons could be advanced to explain this massive cell death. Among them, the loss of cell–cell interactions, the privation of trophic inputs, and the energetic stress contribute to the compromised survival rate of grafted cells (12,13). In the present study, we found that most of the grafted Gad67–GFP precursors obtained from ganglionic eminences at E15.5 died within the first days following transplantation. However, several Gad67–GFP GABAergic interneurons survived up to 30 days, and these cells presented morphological, neurochemical, and functional characteristics of integrated cells. Interestingly, after the transplantation at birth, grafted cells were localized in all the depth of the cortex, long-term surviving Gad–GFP cells were essentially retrieved in the superficial layers (II to IV). Several hypotheses would be suggested to discuss this point: i) grafted cells were found in developing layers II–IV, a favorable trophic environment for their functional integration, and ii) they used the tangential migratory route as well as endogenous interneurons. Indeed, GABAergic interneurons from the host cortex are still migrating at birth in neocortex of mouse neonates (11). In addition, because apoptosis was previously shown to be a major mechanism involved in death of different grafted cell types (1,14,51), we visualized and quantified cleaved caspase-3 immunoreactive cells and found that apoptotic cell death occurred in the first hours/days following the transplantation. Altogether, these data indicate that while grafted GABAergic interneurons are clearly able to integrate into the host tissue, the first hours following the graft represent a critical period for the life/death fate of these cells, and this period represents a pivotal window to increase the long-term survival rate.
Mechanistic Modulation of Autophagy in Gad67–GFP Precursors and Impact on Apoptosis
Even if autophagy is a primordial and highly conserved intracellular process (43), there is more and more evidence suggesting selective regulatory mechanisms depending on cell types and/or cell fates (44). In order to clarify this point, a pharmacological, morphological, and molecular study was performed to determine if autophagy regulators impacted on E15.5 ganglionic eminences used to prepare the suspension of precursors. Four parameters representative of autophagy were analyzed, that is, the LC3 cleavage by Western blot, the cytoplasmic localization of LC3 by immunohistochemistry, the regulation of Beclin-1 levels, and the presence of autophagosomes by electron microscopy (35). Data demonstrated strong and opposite effects of rapamycin and 3-MA, indicating that precursors present in the ganglionic eminences at E15.5 are highly sensitive to autophagy regulators (Fig. 16A). In addition, because numerous studies reported crosstalks between autophagy and apoptosis (16,28,31,57), we investigated the impact of rapamycin and 3-MA on the apoptotic death of Gad67–GFP precursors in E15.5 ganglionic eminences. In the literature, the results describing interactions between modulators of autophagy and apoptosis are controversial. Indeed, some research groups showed that inhibition of autophagy was associated with an increase in apoptosis (19,25,50), while others found that an inhibition of autophagy was antiapoptotic (4,39,58). In the present study, results obtained in neuronal precursors indicated that rapamycin tended to be proapoptotic, while inhibition of autophagy with 3-MA was clearly antiapoptotic. Even if the interpretation of these discrepancies remains unclear, it is well established that autophagy plays a key role in the regulation of the metabolic status of cells (57). Interestingly, most of the studies showing that inhibition of autophagy would increase apoptosis referred to cancer and tumor cells. In tumors, the basal metabolism, the oxidative machinery, and the mitochondria activity are differently regulated than in healthy tissues (9); therefore, the energetic status of a given cell would be a possible explanation to reconcile these controversial results. At a mechanistic level, the effect of autophagy modulators on apoptosis was investigated by quantifying four parameters, that is, Bax level, mitochondria integrity, caspase-3 cleavage, and caspase-3 activity (Fig. 16A). Indeed, while caspase-3 belongs to the executioner class of caspases and is engaged in all caspase-dependent pathways, Bax expression, a proapoptotic member of the Bcl-2 family, and measurements of the mitochondrial potential are two criteria that are more specifically associated with the mitochondrial apoptotic pathway (60). While rapamycin tends to be proapoptotic, 3-MA significantly reduced caspase-3 cleavage, as well as caspase-3 activity. This marked antiapoptotic effect of 3-MA would also reflect the cell suffering resulting from in vitro slice cultures. Double labeling LC3/FITC-VAD-FMK confirmed that inhibition of autophagy and apoptosis by 3-MA occurred in the same cells. In addition, Western blot experiments indicated that 3-MA was able to reduce both Beclin-1 and Bax protein levels, while rapamycin exerted the opposite effect. Bcl-2 and/or BclxL have/has been shown to inhibit both autophagy and apoptosis by dimerizing with Beclin-1 and Bax, respectively (31), so the present data suggest that, in Gad67–GFP precursors, 3-MA would modify the ratio of Bcl2/Beclin-1 and Bcl2/Bax dimers (Fig. 16C). Additional experiments such as immunoprecipitation studies should be performed to test this hypothesis.

Scheme summarizing the effects of rapamycin and 3-MA on autophagy, apoptosis, and survival of Gad67–GFP precursors. (A) In cultured ganglionic eminences from E15.5 embryos, 3-MA decreased the expression of Beclin-1, the cleavage of LC3, and the formation of autophagosomes. In addition, 3-MA reduced the expression of Bax, favored the mitochondria integrity, and inhibited the caspase-3 cleavage and activity. On the contrary, rapamycin induced an opposite effect on autophagy and apoptosis even if both processes were already activated in control conditions (probably due to the culture-induced trophic deprivation stress). (B) In vivo, the treatment of Gad67–GFP precursors by 3-MA resulted in a reduction of grafted cells presenting a LC3-dotted pattern, a decrease in cleaved caspase-3 immunoreactive cells, and an improvement of cell survival. Surviving Gad67–GFP cells possessed characteristics of differentiated and functional GABAergic neurons. (C; gray square) Based on data from the literature and the present study, a new hypothesis involving members of the Bcl-2 family could be raised to establish a mechanistic link between the effects of 3-MA on autophagy and apoptotic death of Gad67–GFP precursors. ATG8, autophagy-related protein 8.
Regulation of Autophagy: A New Strategy to Promote the Survival of Grafted GABAergic Interneurons During the Posttransplantation Critical Period
On one hand, anoikis, the loss of cell–cell and extracellular matrix contact, is proposed to play a key role in the initiation of apoptosis of dissociated grafted cells (32). On the other hand, several data obtained in pathological models related to cancer have shown that regulation of autophagy would be a major process allowing the cancer cells to bypass anoikis (18). The consequence of such a process would be the ability for tumor cells to survive, migrate, and finally metastasize (17). The following three facts: i) transplanted cells are also isolated from their environment and submitted to energetic stress (46), ii) numerous Gad67–GFP grafted cells died by apoptosis within the first hours following transplantation (our results), and iii) mechanistic cross-talks have been described between autophagy and apoptosis (16), led to us speculating that the deleterious effects of autophagy regarding development of metastasis in cancer would be turned into an advantage to favor the survival of grafted cells (3). Preincubation and coinjection of precursors with 3-MA resulted in a LC3 diffuse immunoreactive pattern 6 and 24 h after transplantation, a significant decrease in apoptotic cells within the first 24 h, and finally, a significant increase in Gad67–GFP neurons 5 and 15 days after the transplantation (Fig. 16B). These promising results strongly support that modifying the metabolic homeostasis by inhibiting autophagy in grafted cells could have a beneficial impact on their survival rate. In addition, because regulation of autophagy is a transitory process, this approach would represent an alternative to other strategies, which consist of immortalizing or transfecting grafted cells. Indeed, such strategies have been shown to possess side effects like tumor genesis (20). Previous studies reported that hypothermia is able to reduce death of grafted embryonic nigral neurons (24). The mechanisms mediating the protective effects of hypothermia on grafted neurons are poorly understood, and hypothermia directly impacts energetic homeostasis, it would therefore be interesting to determine i) if hypothermia impacts autophagy and ii) if hypothermia would improve the 3-MA-induced survival rate of grafted cells.
Autophagy, Cell Transplantation, and Neonate Brain Lesions
In neonates, hypoxic-ischemic brain lesions represent the foremost cause of cerebral palsy, and treatments are few. In term infants, hypothermia has been shown to improve survival, while in early preterm infants, magnesium sulfate has been shown to reduce the risk of cerebral palsy (2). Within the last 10 years, cell therapy using different cell types, such as mesenchymal stem cells (55), umbilical cord blood stem cells (8), or neurosphere-derived precursors (54), appeared to be promising strategies to protect or eventually replace cell populations. However, as observed for adult models, numerous cells die posttransplantation (53). While molecules such as rapamycin or 3-MA have several intracellular targets, different groups have reported a beneficial effect of autophagy modulators in lesional conditions both in adults (15,23) and neonates (40). For example, Puyal et al. showed that postischemic intracerebroventricular injections of 3-MA were able to reduce the lesion volume (41). Considering our present data and those from the literature, it is tempting to speculate that the association of a modulation of autophagy with cell transplantation strategies would open new fields of translational applications.
Clinical and Neurodevelopmental Impacts
A postmortem study has described a massive loss of cortical GABAergic neurons in preterm infants presenting brain injuries (47). In addition, a previous in vitro study performed in cultured brain slices revealed a particular vulnerability of GABAergic interneurons to excitotoxicity in mouse neonates (10). This apparent “cell type” specificity would be related to a “time window” vulnerability. Indeed, during cortical development, numerous GABAergic neurons are generated in the subpallial telencephalon and reach the cortex by tangential migration (27). After entering the cortex, the immature GABAergic neurons reach their final destination via several routes located in the marginal zone, subplate, and lower intermediate zone (30). Even if, in mice, this process mainly occurred during prenatal life from E12 to E18, the maturation of GABAergic cells is not totally achieved until a few days after birth (11). In the same way, in humans, immature and migrating GABAergic neurons are still detected from 23 to 25 weeks of gestation, a developmental stage that overlaps with the age of preterm infants admitted in neonatal intensive care units (27). Consistent with this notion of “time window” vulnerability, in the present study, the Gad67–GFP precursors were injected in all the neocortex thickness at P0; however, the surviving grafted neurons observed at P15 and P30 were always retrieved in the cortical layers II to IV (three layers that were not yet differentiated at P0), suggesting that Gad67–GFP precursors found in these layers a favorable trophic environment. In conclusion, the present study showed that i) the graft of Gad67–GFP precursors in the immature neocortex of mouse neonates results in a long-term survival and functional integration of the GABAergic interneurons in cortical layers II–IV. However, the survival rate is low, and numerous precursors die by apoptosis in the first hours/days following the graft, ii) the treatment of ganglionic eminences from Gad67–GFP mice with 3-MA results in inhibition of several parameters of autophagy and apoptosis both in vitro and in vivo, and iii) the transplantation of Gad67–GFP precursors preincubated with 3-MA significantly increased the number of surviving neurons 15 days after the graft. Altogether, these data indicate that the use of autophagy modulators represents a promising strategy to allow grafted precursors to overpass the first critical hours following transplantation and to increase their long-term survival rate.
Footnotes
Acknowledgments
This work was supported by the University of Rouen, INSERM, the Conseil Régional de Haute-Normandie, ANR Neuro 2007 (NeoVasc), the European funds FEDER and INTERREG Perene, the LARC-Neuroscience network, and the Regional Platform for Cell Imaging (PRIMACEN). C.R. is a recipient of a fellowship from the Région Haute-Normandie. The authors declare no conflicts of interest.