
Abstract
We report that cells from human fetal dermis, termed here multipotent fetal dermal cells, can be isolated with high efficiency by using a nonenzymatic, cell outgrowth method. The resulting cell population was consistent with the definition of mesenchymal stromal cells by the International Society for Cellular Therapy. As multipotent fetal dermal cells proliferate extensively, with no loss of multilineage differentiation potential up to passage 25, they may be an ideal source for cell therapy to repair damaged tissues and organs. Multipotent fetal dermal cells were not recognized as targets by T lymphocytes in vitro, thus supporting their feasibility for allogenic transplantation. Moreover, the expansion protocol did not affect the normal phenotype and karyotype of cells. When compared with adult dermal cells, fetal cells displayed several advantages, including a greater cellular yield after isolation, the ability to proliferate longer, and the retention of differentiation potential. Interestingly, multipotent fetal dermal cells expressed the pluripotency marker SSEA4 (90.56 ± 3.15% fetal vs. 10.5 ± 8.5% adult) and coexpressed mesenchymal and epithelial markers (>80% CD90+/CK18+ cells), coexpression lacking in the adult counterparts isolated under the same conditions. Multipotent fetal dermal cells were able to form capillary structures, as well as differentiate into a simple epithelium in vitro, indicating skin regeneration capabilities.
Introduction
Human embryonic stem cells (ESCs), induced pluripotent stem cells (iPSCs), and mesenchymal stromal cells (MSCs) have all emerged as potential sources of regenerative medicine and tissue engineering applications (2,17). Among these, MSCs appear to have several advantages, including an obviation of ethical concerns and an excellent safety record when transplanted into humans (26,36). Given the number of successful, ongoing clinical trials, there is increasing interest in utilizing MSCs in a broad range of cell-based therapies. MSCs were originally isolated from adult bone marrow (13). However, since obtaining large numbers of MSCs from bone marrow has proven unsuccessful because of low frequencies, invasive collection procedures (34), and limited expansion capacity of cells (30,31,39,40,44), alternative cell sources that could be more favorable for large-scale applications have been pursued.
Cells with a multilineage differentiation potential have recently been isolated from human adult dermis (45). These cells are localized in close proximity to hair follicles (18,21,37) and display mesenchymal characteristics, including the ability to differentiate into mesodermal cell types (28,29). However, research on dermal stem-like cells is in only the early stages of recognizing the importance of their potential for organ regeneration and repair. In fact, adult dermal cells have been shown to support in vitro bone and cartilage formation (42), though no clinical trials have been conducted. In contrast, cells from fetal dermis have been proven to be safe and efficacious in the treatment of pediatric burns (1,8,19), but proper characterization in vitro of these cells has not been provided.
The aim of our study was to investigate the human fetal skin as an alternative abundant source of multipotent stem-like cells of therapeutic interest. We believe that cells isolated from fetal skin offer several advantages over those from adult skin. The greater growth capacity of fetal skin cells (8) means that it would be easier to expand and generate large numbers of cells for clinical delivery. Additional advantages of fetal cells over adult cells include lower immunogenicity (19) and a higher resistance to oxidative stress (8).
In line with the aim of the study, we herein provide a protocol for the isolation and expansion of large numbers of multipotent fetal dermal cells (MFDCs). Isolation and characterization of adult dermal cells (ADCs) were also performed in parallel comparative analysis. We tested cell immunogenicity and the effects of culture expansion on cell immunophenotype and functionality, including proliferative and differentiation capacities. We also proved their capacity for epithelial and endothelial differentiation in vitro and hypothesize their role in skin repair and regeneration.
Materials and Methods
Tissue Procurement
Fetal skin tissues (six samples; two males and four females) were taken from 20- to 22-gestational-week human fetuses obtained in cases of therapeutic abortions, in accordance with a protocol approved by ISMETT's Institutional Research Review Board (IRRB) and ethics committee. Informed consent was obtained for each donor. Adult skin biopsies (six samples, four males and two females, 40–65 years old; Istituto Humanitas, Rozzano, Milan) were obtained from skin (surgical waste) from patients who underwent corrective surgery. Tissue samples were washed with phosphate-buffered saline (PBS; Lonza, Basel, Switzerland) containing antibiotics (Lonza) before cell isolation.
Cell Isolation
Cells were isolated using the outgrowth technique from 1.5-cm2 skin fragments. The fragment was minced into smaller pieces, placed on the bottom of a plastic six-well culture dish (Nunc, Rochester, NY, USA) with the dermis face down, and allowed to air dry for 20 min to increase attachment to the bottom of the dish. Dulbecco's modified Eagle's medium (DMEM, Lonza) supplemented with 10% fetal calf serum (FCS) (Lonza), antibiotics, and l-glutamine (Lonza) was added gently to completely cover the tissue. The cultures were incubated at 37°C in a humidified atmosphere with 5% CO2, and the medium was changed every 3 days. Cell migration from fragments was regularly monitored using an inverted microscope (Olympus CKX41, Tokyo, Japan) coupled with a camera (Nikon DS-Fi1, Melville, NY, USA) and Digital Sight for image acquisition (Nikon). After reaching confluence, cells were transferred to tissue flasks for subculturing.
Cell Cultures
MFDCs and ADCs were cultured in 75-cm2 tissue flasks (SARSTEDT, Numbrecht, Germany) in DMEM/10% FCS. Cells were incubated at 37°C in a humidified atmosphere with 5% CO2 and the medium replaced every 3 days. At 80% confluence, cultured cells were detached using 2 mM ethylenediaminetetraacetic acid (EDTA; Sigma-Aldrich, St. Louis, MO, USA) in PBS and replated in two flasks (1:2 split ratio). Every three passages, cells were subjected to immunophenotype testing.
Immunophenotype Analysis
Cells were washed in PBS without Ca2+/Mg2+. Approximately 5 × 10⁵ cells were used for each antibody staining. Fixation and permeabilization of cells were performed with the Cytofix/Cytoperm kit (Becton Dickinson Biosciences, Franklin Lakes, NJ, USA) according to manufacturer's instructions. Flow cytometry data were acquired on FACSAria II and analyzed with FACS Diva version 6.1.2 and Cell Quest Pro software version 6.0.2 (BD Biosciences). The primary antibodies are listed in Table 1.
Primary Antibodies for Flow Cytometry

IgG1, immunoglobulin G1; FITC, fluorescein isothiocyanate; PE, phycoerythrin; CD45, cluster of differentiation 45; APC, allophycocyanin; Cy7, cyanine 7; N/A, not applicable; TERT, telomerase; SSEA4, stage-specific embryonic antigen 4; STRO-1, stromal molecule-1; CK18, cytokeratin 18; HLA, human leukocyte antigen; VEGFR-2, vascular endothelial growth factor receptor-2.
Immunofluorescence on Cells
Cultured cells were fixed according to the antibody manufacturer's instructions and stained directly in eight-or four-well chamber Permanox slides (Nunc). Cells were blocked [PBS 0.5% Tween 20, 3% bovine serum albumin (BSA; both from Sigma-Aldrich)] for 1 h at room temperature and incubated with primary antibodies overnight at 4°C. Then, cells were incubated with the appropriate fluorochrome-conjugated secondary antibodies (Alexa Fluor; Invitrogen, Carlsbad, CA, USA) for 1 h at room temperature in the dark. Subsequently, cells were mounted with Prolong Gold Antifade (Invitrogen), which includes the 4′,6-diamidino-2-phenylindole (DAPI) for the nuclear counterstaining, and stored in the dark. Cell imaging was done with a fluorescence microscope (Nikon Eclipse 50i) coupled with a camera (Olympus XM10) and CellF software for image acquisition (Olympus). The primary antibodies are listed in Table 2.
Primary Antibodies for Immunofluorescence

Immunofluorescence on Skin Sections
Skin fragments were fixed in 10% paraformaldehyde (Electron Microscopy Sciences, Hatfield, PA, USA) and embedded in paraffin. Semithin sections (3 mm) were rinsed with water, and a heat-induced antigen retrieval step with citrate buffer (Dako, Carpinteria, CA, USA) was performed. After washing with PBS, sections were processed for immunofluorescence as described above.
In Vitro Osteogenic, Adipogenic, Chondrogenic Differentiation
As per differentiation protocol, we used the BulletKits (Lonza), according to manufacturer's instructions. To determine whether MFDCs could be expanded over a long period and retain their differentiation potential, we performed the differentiation assays at early and late passages and compared the results with ADCs.
Osteogenic Differentiation
Cells were plated onto six-well plates at 2 × 10⁵/well density in DMEM (control) or osteogenic induction medium containing β-glycerophosphate (Lonza). The medium was changed every 3 to 4 days, and cells were differentiated for 22 days. Cells were stained with alizarin red (Sigma-Aldrich) and subjected to alkaline phosphatase (AP) assay. For alizarin red, stained cells were observed under an inverted CKX41 microscope (Olympus) coupled with a DS-Fi1 camera and Digital Sight (Nikon) for image acquisition. For AP assay, cells were lysed (CelLytic M; Sigma-Aldrich), and the supernatant was subjected to analysis with a luminescence kit (Cayman Chemical Company, Ann Arbor, MI, USA) to measure secreted AP activity, according to the manufacturer's instructions.
Adipogenic Differentiation
Cells were plated onto a six-well plate at 2 × 10⁵/well density and cultured in DMEM. After the cells reached confluence, the medium was kept as DMEM (control) or changed to adipogenic induction medium supplemented with IBMX (3-isobutyl-1-methylxanthine; Lonza). After 3 days, the medium was replaced with adipogenic maintenance medium. After three complete cycles of induction/maintenance, intracellular lipid droplets were stained with Oil Red O (Sigma-Aldrich), and image acquisition was done as described in the Osteogenic Differentiation subsection, above.
Chondrogenic Differentiation
Cells (3 × 10⁵) were washed with incomplete chondrogenic induction medium (Lonza) and then resuspended in 0.5 ml of complete chondrogenic induction medium [supplemented with 10 ng/ml of transforming growth factor-β3 (TGF-β3; Lonza)] or DMEM (control). Cells were cultured as a pellet in 15-ml polypropylene culture tubes (BD Falcon). The medium was replaced every 3 to 4 days, and the cell pellet was cultured for 24 days. Cells were stained with Alcian blue solution (Sigma-Aldrich) and counterstained with nuclear fast red solution (Sigma-Aldrich). Image acquisition was done as described in the Osteogenic Differentiation subsection, above.
Reverse Transcription Polymerase Chain Reaction (RT-PCR)
Total RNA was extracted from cells with the RNeasy Mini Kit (Qiagen, Hilden, Germany) and quantified by spectrophotometric measurement. DNase digestion was carried out by treating the RNA with the Amplification Grade DNase 1 (Invitrogen). First-strand cDNA was synthesized from approximately 1 μg of RNA using the SuperScript III First-Strand Synthesis Super Mix (Invitrogen). All steps were undertaken according to manufacturers' instructions. The resulting cDNA was used as a template for amplification in PCR. The primer sequences (Invitrogen) are listed in Table 3.
Primers for RT-PCR
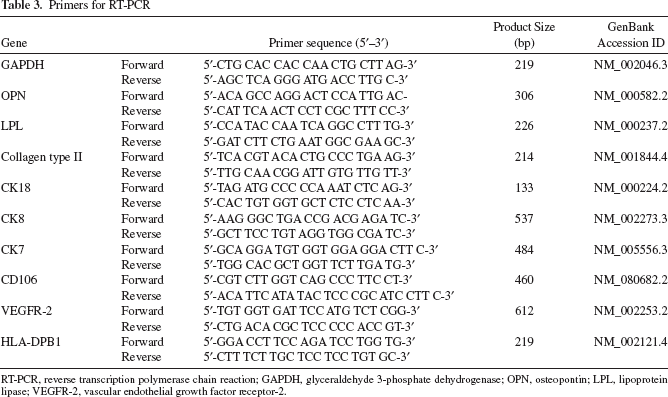
RT-PCR, reverse transcription polymerase chain reaction; GAPDH, glyceraldehyde 3-phosphate dehydrogenase; OPN, osteopontin; LPL, lipoprotein lipase; VEGFR-2, vascular endothelial growth factor receptor-2.
Growth Kinetics
A growth curve describing culture kinetics was generated as follows. The growth area occupied by a primary dermal cell culture in a flask was assumed as 1. When the cells were >80% confluent, the second passage took place at the split ratio of 1:2. The procedure was repeated for each passage at the constant split ratio of 1:2, and we counted the days to the next passage, thus obtaining a theoretical growth curve that was directly proportional to the number of passages and to the growth rate of the samples.
In Vitro Epithelial Differentiation
MFDCs were plated onto a six-well plate and cultured in DMEM containing recombinant human insulin (Humulin; Lilly, Indianapolis, IN, USA), l-glutamine, 0.05 mM dexamethasone (Hospira, Lake Forest, IL, USA), 0.3 mM ascorbic acid (Sigma-Aldrich), and 0.1% dimethyl sulfoxide (DMSO; Sigma-Aldrich), or in DMEM as control medium. Epithelial differentiation was assessed on the basis of morphological modifications of induced cells compared with noninduced cells and by evaluating the protein expression of vimentin to E-cadherin switch as an index of mesenchymal–epithelial conversion.
In Vitro Angiogenesis Assay
To explore whether transplanted MFDCs may improve wound healing outcomes by promoting revascularization of wounded tissue, we assessed their capacity for capillary formation by using an in vitro angiogenesis kit (Millipore, Billerica, MA, USA), according to the manufacturer's instructions. We performed the assay using both untreated cells and cells treated for 10 days with 50 ng/ml vascular endothelial growth factor (VEGF; PromoCell, Heidelberg, Germany). Briefly, 50 μl of gel matrix (Millipore) were applied on a 96-well sterile plate (Costar Corning Incorporated, Corning, NY, USA) and incubated at 37°C for 1 h. Then, 5 × 10³ cells were suspended in 150 ml of DMEM, plated onto the gel matrix, and incubated at 37°C in a humidified atmosphere with 5% CO2. Cells were observed every 3 h under an inverted microscope. ADCs and Huh 7.5 hepatoma cell lines (male donor 57 years old; cell line kindly donated by R. Bartenschlager, Heidelberg, Germany) were used as control cells.
Lymphocyte Proliferation Assay and Mixed Lymphocyte Reaction (MLR)
We tested the proliferation of peripheral blood mononuclear cells (PBMCs) in response to both fetal and adult dermal cells. We used the CellTrace carboxyfluorescein diacetate succinimidyl ester (CFSE) and performed a Cell Proliferation Kit assay (Molecular Probes, Invitrogen) according to the manufacturer's instructions. PBMCs were isolated in accordance with a protocol approved by ISMETT's Institutional Research Review Board (IRRB) and Ethics Committee. A written, informed consent was obtained from each donor. Blood samples were obtained from healthy donors (two female donors, 35 and 40 years old, and two male donors, 34 and 35 years old). Twenty milliliters of blood was added to EDTA tubes (Vacutainer K2E; BD Pharmingen), and an equal volume of sterile PBS was subsequently added. Centrifugation at 200 × g for 15 min at room temperature was followed by removal of the supernatant (plasma and platelets). An equal volume of PBS and Ficoll (3 ml/10 ml of suspension) (Cederlane Labs, Hornby, ON, Canada) was added to the pellet (containing erythrocytes and leukocytes). Centrifugation was performed for 25 min at 900 × g at room temperature, without brake. After plasma removal, the layer of mononuclear cells was transferred in a second 15-ml centrifuge tube (Costar Corning), washed with three volumes of HBSS (Lonza) and centrifuged for 10 min at 525 × g at room temperature. This procedure was repeated twice to wash the pellet. Aliquots of CFSE-labeled PBMCs (1 × 10⁴) were cocultured into 96-well plates with serially diluted dermal cells (1:2 to 1:16) in Roswell Park Memorial Institute (RPMI; Lonza) 10% FCS for a period of 3 to 4 days. MLR was performed as positive control. For MLR, CFSE-labeled PBMCs (4 × 10⁴) were cocultured with allogenic PBMCs (1 × 10⁴) for 3 to 4 days. At the end of incubation, the suspended cells were collected, and PBMC proliferation was determined as a percentage of CFSE-fluorescent cells by flow cytometric analysis. To quantify the proliferating cells, we evaluated the proliferation index (PI) value at each reaction.
Telomerase Activity Using Quantitative Telomerase Detection (QTD) Real-Time PCR Assay
Telomerase activity in MFDCs was detected with the QTD Kit (US Biomax Inc., Rockville, MD, USA) according to the manufacturer's instructions. Briefly, 3 × 10⁶ cells were lysed to determine telomerase activity in protein cell extracts. We used 1 ml of cell extract/reaction. We calculated the amount of template (amol/ml) with telomeric repeats (TTAGGG sequences) by using a standard curve from a TSR oligonucleotide with a sequence similar to a telomere repeat. The resulting extended product was subsequently amplified by the real-time PCR using SYBR Green. Telomerase is a heat-sensitive enzyme, so we tested each sample for heat sensitivity by incubation at 85°C for 10 min prior to the assay as negative control. We included the Huh-7.5 hepatoma cells (ATCC) as a positive control. Furthermore, Annexin-V-FLUOS Staining kit (Roche Diagnostics GmbH, Mannheim, Germany) was used according to manufacturer's instructions to detected apoptotic cells.
Chromosome Preparation and Cytogenetic Analysis
Cytogenetic analysis was performed on cell lines, according to techniques previously described (5). Cultured cells were trypsinized (trypsin–EDTA solution; Sigma-Aldrich), and cell suspension transferred into two new small Petri dishes containing slides. The cells grown on the slides were processed when a sufficient number of mitoses were detected under an inverted microscope. Cultures were exposed to Colcemid (Sigma-Aldrich) for 2 h. Slides were then soaked in hypotonic solution KCl 0.56% (Sigma-Aldrich) for 10 min and, subsequently, in fixative solution methanol–glacial acetic solution (Sigma-Aldrich) for 30 min. QFQ banding techniques (Sigma-Aldrich) were applied at 450–500 banding resolution. Briefly, the slides were incubated for 15 min at room temperature in a 1× quinacrine mustard solution (50 mg/ml; Sigma-Aldrich), rinsed in Sorensen's buffer pH 6.8 (0.133 M Na2HPO4, 0.133 M KH2PO4; Sigma-Aldrich) (6), and mounted in the same buffer. The slides were examined under a fluorescent microscope by using a filter for quinacrine mustard, and metaphases were photographed. Numerical and structural changes were defined according to the International System for Human Cytogenetic Nomenclature (ISCN) (41). For each sample at passages 3 and 9, 25 metaphases were analyzed in detail by two different operators, using an automatic analysis system (Nikon, Cytovision).
Statistics
Statistical analyses for cell yield after isolation at passage 1 and for the in vitro expansion were applied to MFDCs from six different donors and ADCs from six different donors. Statistical analyses for immunophenotype by flow cytometry were applied to MFDCs from five different donors and ADCs from three different donors. Osteogenic, adipogenic, and chondrogenic differentiation, angiogenesis assay, and lymphocyte proliferation assay were applied to MFDCs from five different donors and ADCs from three different donors. Karyotype analysis was done on two fetal and one adult samples from passages three, six, and nine. Epithelial differentiation and telomerase activity were performed on five fetal samples. All data were expressed as average ± standard deviation. Data from two different groups were compared using the Student's t test. Differences between the groups were considered significant at a value of p < 0.05. All the experiments were conducted on both freshly isolated and cryopreserved cells.
Results
Cell Isolation
MFDCs showed the first outgrowth from the skin biopsy on day 2, while migration was slower for ADCs, the first outgrowth being observed from days 6 to 10, among the different samples. As soon as the cells occupied most of the dish surface between the explants (Fig. 1A), they were transferred to tissue culture flasks that represented P1 and subcultured for expansion. From fetal skin, the cell yield was 3.6 ± 0.25 × 10⁶ cells/1.5 cm2 of biopsy at P1, while it was approximately threefold lower from adult skin (1.06 ± 0.16 × 10⁶ cells/1.5 cm2 of biopsy at P1) (Fig. 1B). Phenotypical and functional differences between MFDCs and ADCs are listed in Table 4.

Isolation procedure, cell yield, and tissue localization of multipotent dermal cells. (A) Outgrowth of cells from a 21-week-gestation fetal skin fragment. (B) Cell yield after isolation calculated for MFDCs and ADCs isolated under the same conditions at P1; plotted values (mean ± SD) represent fetal (n = 6) and adult (n = 6) samples, respectively (p < 0.001*). (C) Immunofluorescence showing localization of CD105 (red), CD90 (red), and CD71 (green) positive cells on fetal skin tissue. Blue: DAPI nuclear counterstaining. Scale bar: 25 μm (skin outgrowth, CD105 and CD71); 50 μm (CD90). MFDCs, multipotent fetal dermal cells; ADCs, adult dermal cells; P1, passage 1; SD, standard deviation; CD105, cluster of differentiation 105; DAPI, 4′,6-diamidino-2-phenylindole.
Comparison of Cultured MFDCs and ADCs

MFDCs, multipotent fetal dermal cells; ADCs, adult dermal cells; SD, standard deviation; PBMCs, peripheral blood mononuclear cells.
Values (mean ± SD) represent fetal (n = 6) and adult (n = 6) samples, respectively (p < 0.001).
Values (mean ± SD) represent fetal (n = 5) and adult (n = 3) samples, respectively (p < 0.05).
Identification of MFDC Compartments in Human Fetal Skin
We performed immunofluorescence analysis on fetal skin sections by using anti-CD105, anti-CD90, and anti-CD71 antibodies. CD105-positive cells were located in the dermal structures (Fig. 1C), considered a niche for endogenous skin-derived precursors (12,22). CD90- and CD71-positive cells were localized in both the epidermal basal layer and the dermal structures (Fig. 1C).
Immunophenotypic Analysis of Expanded MFDCs
Cell immunophenotype was analyzed every three passages, and for the whole duration of the expansion, by using a panel of markers chosen on the basis of published reports on human MSCs (10). Flow cytometric analysis showed that the outgrowth technique yielded a homogeneous MSC-like population with the indicated percentage of positivity calculated for a representative sample at P3: CD90 (95.6 ± 2.6%), CD105 (91.4 ± 3.3%), CD73 (90.7 ± 2.3%), CD71 (89.7 ± 8.9%), and vimentin (91 ± 2.1%) (Fig. 2A). MFDCs had a very low expression or lacked the hematopoietic lineage antigens CD34 (1.5%), CD45 and CD14 (<1%), and immunoreactivity marker human leukocyte antigen (HLA)-DR (<1%) (Fig. 2B). Approximately 30% of cells expressed stromal molecule-1 (STRO-1 27.83 ± 14%) (Fig. 2C). In addition, cells were positive for stem cell markers nestin (92.5 ± 3.17%), and for pluripotency marker stage-specific embryonic antigen-4 (SSEA4, 90.56 ± 3.15%) (17) and NANOG (92.8 ± 9.0%) (Fig. 2C). A low number of cells expressed the endothelial marker CD106 (4.1 ± 0.6%), CD117 (6.2 ± 0.5%) (Fig. 2D), and the epithelial marker CD49f (2.2 ± 1.1%, data not shown). Additional analyzed markers were CD29, CD166, CD49b, CD49e, CD44, and CD271 (93.3 ± 3.7%, 89.6 ± 2.6%, 90.7 ± 2.3%, 94.4 ± 0.35%, 95.6 ± 0.5%, 16.6 ± 10.09%, respectively; data not shown). ADCs displayed the same expression pattern (data not shown), except for the pluripotency marker SSEA4, which was expressed at a lower percentage (10.5 ± 8.5%; data not shown). The immunofluorescence analysis of some of the most representative markers at P3 confirmed the homogeneous phenotype of MFDCs (Fig. 2E, F).
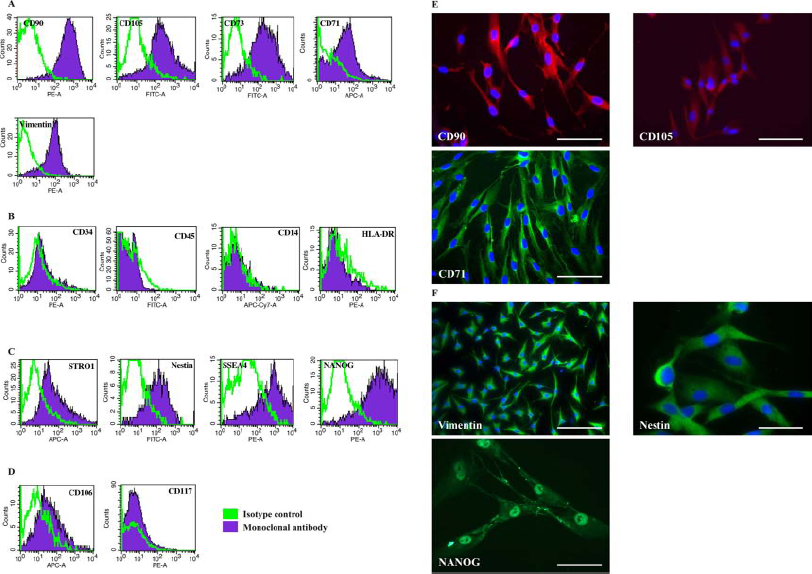
Immunophenotype of MFDCs at P3. (A) Flow cytometry histograms from representative samples for the mesenchymal markers CD90, CD105, CD73, CD71, and vimentin. (B) Flow cytometry histograms for the hematopoietic markers CD34, CD45, CD14, and immunoreactivity marker HLA-DR. (C) Flow cytometry histograms for STRO-1 and stem cell markers nestin, SSEA-4, and NANOG. (D) Flow cytometry histograms for CD117 and endothelial marker CD106. Representative immunofluorescence of cultured MFDCs at P3. (E) CD90 (red), CD105 (red), and CD71 (red). (F) Vimentin (green), nestin (green), and NANOG (green). Blue: DAPI nuclear counterstaining. Scale bar: 50 μm (CD90, CD105, and CD71), 100 μm (vimentin), and 25 μm (nestin, NANOG). PE, phycoeyrthrin; FITC, fluorescein isothiocyanate; APC, allophycocyanin; Cy7, cyanin 7; HLA, human leukocyte antigen; STRO-1, stromal molecule 1; SSEA-4, stage-specific embryonic antigen 4.
In Vitro Osteogenic, Adipogenic, Chondrogenic Differentiation
When cultured in osteogenic conditions, MFDCs acquired an osteoblastic phenotype, evidenced by deposition of a calcium-rich mineralized extracellular matrix, as revealed by alizarin red stain (Fig. 3A). Osteogenic differentiation determined by measurement of secreted AP activity was significantly higher in MFDCs from early passages than from late passages (200.3 ± 10 mU AP/mg total protein extract at P3; 33.6 ± 4.04 mU AP/mg total protein extract at P15; 32 ± 3.6 mU AP/mg total protein extract at P25). Secreted AP activity was significantly higher in MFDCs than in ADCs (20 ± 4.0 mU AP/mg total protein extract in ADCs at P3; p < 0.05). As with alizarin red stain, we could not detect any AP activity in ADCs after passage 4.
In adipogenic induction medium, lipid droplets appeared in the cytoplasm after 1 week and increased in a time-dependent manner (Fig. 3B). Cells cultured as pellets in chondrogenic conditions showed Alcian blue stain, an indicator of glycosaminoglycan-rich extracellular matrix (Fig. 3C). Figure 3D–F shows the negative controls of osteogenic, adipogenic, and chondrogenic differentiation. The in vitro differentiation was supported by the expression of the specific gene osteopontin (OPN) for osteoblasts, lipoprotein lipase (LPL) for adipocytes, and collagen type 2 (Coll II) for chondroblasts (Fig. 3G). Compared with ADCs, MFDCs maintained their osteogenic and adipogenic potential up to P25 (Fig. 3H), while ADCs lost the capacity for osteogenic and adipogenic differentiation after being passaged four and 10 times, respectively (Fig. 3I).
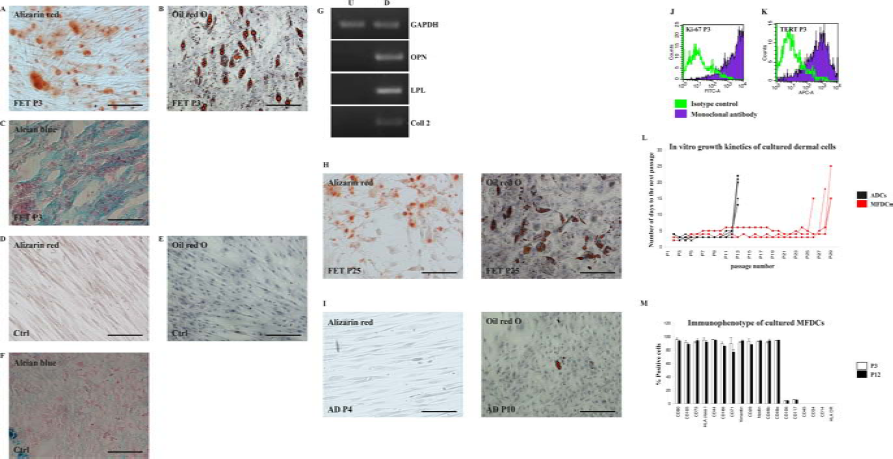
In vitro differentiation of MFDCs toward mesenchymal tissues evaluated at P3. Differentiation staining in MFDCs: (A) Alizarin red stain for osteogenesis. (B) Oil red O stain for adipogenesis. (C) Alcian blue staining for chondrogenesis. (D-F) Corresponding negative control cells. (G) RT-PCR showing the induction of genes connected with osteogenesis (OPN), adipogenesis (LPL), and chondrogenesis (Coll II). GAPDH was used as internal loading control. Differentiation potential of cultured MFDCs and ADCs. (H) Osteogenic and adipogenic differentiation of MFDCs at P25. (I) Osteogenic and adipogenic differentiation of ADCs at P4 and P10, respectively. FET, fetal; AD, adult; ctrl, negative control; P3, passage 3; P25, passage 25; P4, passage 4; P10, passage 10. Scale bar: 25 μm (A, B, D-F, H, I); 50 μm (C). RT-PCR, reverse transcription polymerase chain reaction; GAPDH, glyceraldehyde-3-phosphate dehydrogenase; OPN, osteopontin; LPL, lipoprotein lipase; coll II, collagen type II; U, undifferentiated cells; D, differentiated. Proliferative capacity of cultured MFDCs. (J) Ki-67 expression at P3 evaluated by flow cytometry. (K) TERT expression at P3 evaluated by flow cytometry. (L) Expansion potential of cultured MFDCs and ADCs expressed as a function of total number of passages and number of days to the next passage. (M) Immunophenotype of cultured MFDCs at P3 and P12. Values are shown as mean ± SD relative to fetal samples (n = 6). TERT, telomerase.
In Vitro Expansion
Both cultured fetal and adult dermal cells were highly proliferative and easily expandable in DMEM containing 10% FCS. Particularly, MFDCs from P3 were 97.4 ± 3.17% positive for the proliferation marker Ki-67 (Fig. 3J) and expressed the enzyme telomerase, TERT (approximately 70% positive) (Fig. 3K). To determine the extent to which MFDCs could be expanded, we subcultured the cells for several months in parallel with ADCs. Over this period, both MFDCs and ADCs maintained the same relatively constant growth rate, with cells being passaged every 3 to 4 days. MFDCs were subcultured up to 28 passages, except for one sample that underwent growth arrest at P25 (Fig. 3L), while ADCs underwent growth arrest after 12 passages. Interestingly, the expansion procedure did not alter the normal phenotype of either cell type (Fig. 3M, showing the immunophenotype of MFDCs at P3 and P12).
Immunological Profile and Allogenic Tolerance
MFDCs were positive for HLA-class I molecules (Fig. 4A), but lacked HLA-class II molecules (Fig. 2B, showing HLA-DR). In particular, we found that the expansion step did not alter HLA-DPB1 expression on cell surface examined up to P28 (Fig. 4B). Moreover, the HLA-DPB1 gene was expressed by adult cells but not by MFDCs (Fig. 4C), confirming previously reported findings (19). MFDCs lacked HLA costimulatory molecules CD40 and CD80 (Fig. 4D). However, according to previous reports (9), ADCs did not express HLA-DPB1 surface antigens and costimulatory molecules (data not shown).

Immunological profile of MFDCs evaluated by flow cytometry and RT-PCR. (A) HLA-ABC expression evaluated at P3. (B) HLA-DPB1 expression evaluated at P28. (C) RT-PCR showing HLA-DPB1 gene expression in MFDCs (FET) and ADCs (AD). (D) Expression of MHC costimulatory molecules CD40 and CD80 on MFDCs. Analysis of MFDCs and ADCs cocultured for 3 days with CFSE-labeled peripheral blood mononuclear cells (PBMCs). (E) Allogenic PBMCs cocultured with a representative MFDC sample 1:4 ratio. (F) Allogenic PBMCs cocultured with a representative ADC sample 1:4 ratio. (G) Negative control CSFE-labeled monocultured PBMCs after 3 days of culture. (H) Positive controls CSFE-labeled PBMCs cocultured with allogenic PBMCs for 3 days in an MLR. CFSE, carboxyfluorescein succinimidyl ester; PI, proliferation index; ctrl-, negative control; ctrl+, positive control; MLR, mixed lymphocyte reaction.
We observed that both MFDCs and ADCs did not elicit proliferative responses of PBMCs at any of the used cell densities (1:1–1:16 ratio PBMCs/dermal cells) (Fig. 4E, F). The proliferation index value was approximately 1.0, which was similar to negative control PBMCs that were monocultured for 3 days (Fig. 4G). Positive control MLR, CFSE-labeled PBMCs cocultured with allogenic PBMCs for 3 days, showed proliferative responses (proliferation index value 3.11) (Fig. 4H).
In Vitro Epithelial-Like Differentiation
It is not known whether MFDCs can differentiate into other skin cells, such as epidermal cells. We found epithelial markers cytokeratin 18 (CK18), CK8, and CK7 mRNAs in both MFDCs and ADCs (Fig. 5A). Interestingly, approximately 83% of MFDCs expressed the phenotype CD90+/ CK18+, indicating a coexpression of mesenchymal and epithelial markers that was lost by ADCs (Fig. 5B). To test the epithelial potential of MFDCs, we treated the cells with 0.1% DMSO and observed that MFDCs cultured for 6 days in the presence of 0.05 μM dexamethasone and 0.1% DMSO acquired a cobblestone pattern (Fig. 5C). Immunofluorescence analysis of cells after 6 days of treatment showed downregulation of the mesenchymal marker vimentin (Fig. 5D) accompanied by upregulation of the epithelial marker E-cadherin (Fig. 5E).

Epithelial-like differentiation of MFDCs. (A) Expression of cytokeratin mRN A transcripts (CK18, CK8, and CK7) in fetal and ADCs evaluated by RT-PCR. GAPDH was used as internal loading control. (B) Flow cytometry showing CD90/CK18 double staining in MFDCs and ADCs, respectively. (C) Untreated and DMSO-treated MFDCs on day 6. (D, E) Untreated and DMSO-treated MFDCs stained with anti-human vimentin antibody (D), and E-cadherin (E) on day 6. Blue, DAPI nuclear counterstaining. In vitro endothelial differentiation. (F) Expression of the endothelial markers CD106 and vascular endothelial growth factor receptor (VEGFR-2) mRNAs in MFDCs and ADCs evaluated by RT-PCR. (G) In vitro angiogenesis assay showing MFDCs on gel matrix 4 h after plating. (H) ADCs on gel matrix 6 h after plating. (I) Negative control human hepatoma cells (Huh 7.5) 4 h after plating. DMSO, dimethyl sulfoxide; Vim, vimentin; E-cad, E-cadherin; ctrl, negative control. Scale bar: 50 μm (C, D, G-I); 25 μm (E).
Expression of Endothelial Markers and In Vitro Angiogenesis Assay
As previously described for adult dermal cells (46), MFDCs expressed CD106 and VEGFR-2 mRNAs (Fig. 5F), but not the surface molecules (data not shown). The presence of endothelial mRNAs suggests that these cells may possess an angiogenic potential. Therefore, we treated the cells with 50 ng/ml of VEGF for 10 days prior to performing an angiogenesis assay in vitro. Interestingly, we found that VEGF-untreated MFDCs were able to form capillary-like structures with the same high efficiency as VEGF-treated cells (data not shown). In particular, untreated MFDCs achieved complete tube formation within 6–18 h of plating, with the earliest signs of tubular structure emerging after 3–4 h (Fig. 5G). Untreated ADCs were also able to form capillaries, though the process was slower compared with MFDCs (earliest signs at 6–7 h after plating) (Fig. 5H). Negative control Huh 7.5 hepatoma cells did not show capillary structures (Fig. 5I).
Karyotype Analysis
In primary cultures after three, six, and nine passages, MFDCs from two donors and ADCs from one donor all showed a karyotype (46,XY in two cell lines from fetal and adult; 47,XX,+21 in one fetal cell line derived from a human fetus with Down syndrome), with no acquired numerical and structural aberrations or chromosome/ chromatid breaks over normal laboratory range (data not shown). Note that the cells derived from the Down syndrome fetus did not behave differently from the other cells, particularly with regard to expansion or senescence.
Terminal Differentiation and Telomerase Activity in MFDCs
With the exception of very few markers, we observed no phenotypic differences between short-term-passaged and long-term-passaged MFDCs. However, we found a reduction of SSEA4+ cells at P16 (from 90.56 ± 3.15% to 36.6 ± 12% positive cells) (Fig. 6A), and STRO-1+ cells at P28 (from 27.8 ± 14% to 3.3 ± 0.3%; data not shown). Furthermore, we observed a spontaneous induction of osteopontin (OPN) gene expression after 15 passages (Fig. 6B). Five MFDC samples entered the senescence phase after 28 subcultivations, while one sample entered senescence at P25. The senescence period, during which cells underwent growth arrest, was accompanied by changes in cell morphology from elongated spindle shape to small and compact shape (Fig. 6C). Senescence lasted from 2 to 4 weeks. Subsequently, cells began to show signs of fragmentation (Fig. 6D), expressed annexin V (Fig. 6E), a marker of apoptosis, and showed detachment from the plates. We found detectable levels of telomerase activity in MFDCs from early passages (P4–P7, 0.127 ± 0.042 amol/ml), which was significantly reduced in cells from the late passages (P27–P28, 0.004 ± 0.00069 amol/ml; p < 0.005) (Fig. 6F). Positive control for telomerase activity, the Huh-7.5 cell lines, showed 1.05 ± 0.01 amol/ml of telomerase activity (data not shown). The reduction in telomerase activity was accompanied by a reduction in TERT enzyme expression (Fig. 6G).

Effects of spontaneous differentiation in late-passaged MFDCs. (A) SSEA4 at P16 (see also Fig. 2C for early passaged cells at P3). (B) RT-PCR showing OPN, LPL, and collagen type II gene expression at P3 and P16. In vitro senescence of cultured MFDCs. (C) Morphological modifications of MFDCs 2 weeks after their growth arrest at P28 showing small, compact cells. (D) Intracytoplasmic fragmentations at P28. Scale bars: 50 μm (C) and 25 μm (D). Apoptosis as mechanism of cell death. (E) Double staining with propidium iodide (PI) and annexin V 2 weeks after cell growth arrest. Telomere shortening as a possible mechanism responsible for cell growth arrest. (F) Telomerase activity in cultured MFDCs from early passages (P6) compared to late passages (P27). Plotted values (mean ± SD) represent fetal samples from early (n = 3) and late (n = 3) passages (p < 0.005*). (G) TERT enzyme at P28.
Discussion
In our study, we generated, propagated, and analyzed a proliferating population of cells derived from human fetal dermis taken at 20–22 weeks of gestation. The nonenzymatic isolation technique allows for a spontaneous selection of cells with higher motility and yields a nearly homogeneous cell population (>90% CD90+, CD105+, CD73+). As a result, no additional purification was required, making the whole process rapid and simple compared with the reported isolation methods for MSCs from different organs. Isolated MFDCs respond to the minimal criteria proposed by the International Society for Cellular Therapy (ISCT) to define human MSCs (10), including plastic adherence; expression of CD105, CD73, and CD90; a lack of CD45, CD34, CD14, and HLA-DR surface molecules; and the ability to differentiate into osteoblasts, adipocytes, or chondroblasts. Additionally, MFDCs were highly proliferative and successfully expanded up to 28 passages under standard culture conditions with no addition of growth factors, thus demonstrating one of the longest life spans in culture ever described for human MSCs (3,14,35,43,48), and a strong potential for clinical use, with a low manipulation level during the cell culture expansion phase.
Furthermore, unlike amnion MSCs, which progressively lose their differentiation capacity when cultured for more than 10 passages (43), MFDCs retained osteogenic and adipogenic differentiation for the duration of expansion, thus demonstrating their maintenance of a multilineage differentiation potential and other favorable characteristics for a potential large-scale production aimed at clinical use.
Our preliminary data on cell functionality (i.e., proliferation and differentiation capacity) indicate that thawed cells exhibit features similar to those of cells that were never frozen, thus suggesting the possible transplantation of banked cells that may be well tolerated. Indeed, the immunogenicity of MFDCs should not be a concern because our results suggest that these cells, in theory, will not be recognized as allogeneic targets in case of transplantation. In fact, MFDCs lack the expression of HLA class II and HLA costimulatory molecules on the cell surface (10,19), particularly of the locus HLA-DPB1, associated with tissue rejection, and whose expression in fetal skin cells has been described (19). However, our study focused on later gestation ages with respect to the previous study investigating HLA-DPB1 in 14th week-gestation fetal skin cells (19). More importantly, human fetal skin cells have been transplanted to treat children with burns, with no need for immunosuppression, thus demonstrating their safety (19).
In support of a potential therapeutic use of MFDCs, our results on cultured MFDCs analyzed at P3, P6, and P9 by classical cytogenetic approaches showed a normal karyotype. Furthermore, upon culture expansion, cells retained a stable phenotype that was accompanied only by minor changes detected in passages later than the 15th. We observed a decrease in pluripotency marker SSEA4 expression starting at P16, indicating that cells began to differentiate spontaneously (11). Their differentiation at late passages appeared to be regulated by STRO-1 expression as well, which gradually decreased after 18 passages. The exact function of the STRO-1 antigen is unknown, but its expression was gradually lost during culture expansion of mesenchymal cell lineages (16,25). Furthermore, the induction of OPN gene expression starting at P16, which has been reported during in vitro aging of MSCs (27), might also suggest a progressive commitment of the cell population toward the osteogenic lineage. These findings show that the impact of culture conditions on MFDC phenotype is minor but also reaffirm that only cells from early passages (no later than P10) should be considered for clinical delivery.
Cultured MFDCs did not replicate indefinitely in vitro and underwent senescence. After growth arrest, cells started to express annexin V, indicating a senescence followed by apoptosis, which has been described in other cell types (20). Like Pittenger et al. (34), who detected telomerase activity in human MSCs and fibroblasts, we found telomerase activity in MFDCs from early passages. The reduction of both TERT enzyme expression and telomerase activity in cells from late passages indicated that the in vitro growth arrest was likely caused by telomere shortening. Interestingly, downregulation of the TERT enzyme might be a mechanism that protects our cells from malignant transformation, as its overexpression in cultured adipose tissue-derived MSCs has been shown to induce chromosome alterations in 30% of cells (38).
Very little is known about the distribution of mesenchymal/progenitor cells in human fetal skin tissue. We observed that CD90 and CD71 have an expression pattern similar to that of keratinocyte stem cells (23,33,47), being located in both the epidermal basal layer and dermal appendages. These findings indicate that the expression of mesenchymal markers in the skin overlaps with keratinocytic lineage. However, the fact that CD105 was exclusively located in dermal appendages, and that more than 90% of the isolated MFDCs were CD105+ and displayed a fibroblastic morphology, supports the hypothesis of the mesenchymal nature of MFDCs.
With regard to the need to develop innovative approaches to skin repair (4,24), we hypothesized that local application of MFDCs may be sufficient to ensure skin wound healing. Our hypothesis was prompted by advances in stem cell research, which hold the promise of regenerating the complex organ that is skin. We showed, for the first time to the best of our knowledge, that MFDCs possess a unique characteristic that makes them distinct from other MSC types, with the exception of MSCs of hepatic origin (7): almost the entire cell population (83%) coexpresses mesenchymal and epithelial markers (CD90+/CK18+). A similar coexpression has been described for amnion-derived MSCs (37), though in that study, the percentage of cells was considerably lower (3.6%). This coexpression was lost by ADCs, suggesting a greater potency of fetal cells, one that is not maintained in adulthood, also evidenced by the reduced expression of the pluripotency marker SSEA4 in ADCs (90.56 ± 3.15% MFDCs vs. 10.5 ± 8.5% ADCs) (15). The appearance of the cobblestone pattern accompanied by the induction of E-cadherin expression after DMSO treatment indicates an epithelial plasticity of MFDCs and, together with the CD90+/CK18+ phenotype, suggests a predisposition of the cells toward epidermal differentiation. However, this aspect needs to be further investigated before concluding that MFDCs can act as bipotent skin precursor cell types.
We observed that MFDCs form capillary structures in vitro, indicating their ability to differentiate into endothelial cells. Interestingly, unlike other reports on mesenchymal-like cells (32,46), we found that MFDCs do not need pretreatment with VEGF to form a capillary network, suggesting a release of factors that may promote the angiogenesis beyond cell differentiation capacity. Therefore, we also hypothesize that MFDCs may improve the skin repair process by promoting revascularization of the wounded area, which is a key aspect of a successful wound healing (4,24).
In conclusion, the most interesting aspect of our study is the fact that multipotent cells can be successfully isolated from small fetal skin biopsies and maintained in culture for long periods, with retention of multipotency, stability, and low immunogenicity, thus generating large quantities of cells for clinical use. Alternative applications of MFDCs could also concern tissue engineering for bone reconstruction, and the ability of adult dermal cells to form bone mass in vitro with high efficiency has been reported (42). If we could obtain bone tissue starting from a small skin biopsy, this would dramatically facilitate the use of tissue engineering methods. Given these promising results, the future prospect is to translate the concept of MFDCs as cells of therapeutic interest into experimental models of tissue regeneration.
Footnotes
Acknowledgment
We thank Salvatore Pasqua for his technical support, the members of ISMETT's Pathology Laboratory for tissue processing (paraffin embedding and tissue slide preparation). We thank the Gynecology Unit of Ospedale Civico (Palermo, Italy) for providing the fetal tissues. We also thank Warren Blumberg of ISMETT's Language Services for his excellent language revision of the manuscript and Dr. Massimiliano Gaetani for his suggestions during the final revision of the manuscript. This work was supported by a grant from the Fondazione Ri.MED and from the University of Pittsburgh Medical Center. The authors declare no conflicts of interest.