
Abstract
Previous work by our group showed that transferring bone marrow cells transduced with an autoantigen into nonmyeloablated mice with experimental autoimmune encephalomyelitis induced immune tolerance and improved symptoms of the disease. Because this effect occurred in the absence of molecular chimerism, we hypothesized that the cells responsible did not have repopulating ability and that they were not mediating central but peripheral tolerance mechanisms. In the present study, we analyzed the immunophenotype of the cells that are generated in the transduction cultures and we evaluated the immunosuppressive activity of the main cell subpopulations produced. We show that both granulocytic (CD11b+ Gr-1hi) and monocytic (CD11b+Gr-1lo) myeloid-derived suppressor cells (G- and M-MDSCs, respectively) are generated during standard 4-day γ-retroviral transduction cultures (representing about 25% and 40% of the total cell output, respectively) and that the effectively transduced cells largely consist of these two cell types. A third cell population representing about 15% of the transduced cells did not express CD45 or hematopoietic lineage markers and expressed mesenchymal stromal cell markers. Transduced total bone marrow cells and sorted M-MDSCs expressed arginase and inducible nitric oxide synthase activities, produced reactive oxygen species, and inhibited antigen-induced T-cell proliferation in vitro. Transgene-expressing MDSCs could be exploited therapeutically to induce tolerance in autoimmune diseases and in gene therapy protocols.
Keywords
Introduction
Retroviral-mediated gene transfer into hematopoietic cells, which constitutes the most successful clinical gene therapy approach to date, has traditionally involved culturing the target cells for several days with vector-containing supernatants, under conditions aimed to induce the cycling of immature hematopoietic progenitors while minimizing cell differentiation. Such conditions include exposure to different combinations of cytokines and hematopoietic growth factors. For murine hematopoietic stem cell (HSC) transduction, these combinations have traditionally included the early acting cytokines, stem cell factor (SCF), interleukin (IL)-3, IL-6, and IL-11 (1,24), whereas for human hematopoietic progenitors the most common cocktails include SCF, thrombopoietin (Tpo), IL-6, and fms-related tyrosine kinase 3 ligand (Flt3L), among others. These cytokine combinations inhibit apoptosis and promote cell survival and cycling of the immature progenitors, and for this reason these cytokines have also been used in HSC expansion protocols (45,51). Yet, these conditions are not only associated with a loss of repopulating ability (20) but also drive, to a greater or lesser extent, a certain degree of myeloid differentiation (9). Indeed, the vast majority of cells that are generated under this type of culture conditions after several days express myeloid markers. However, the exact composition and the immunologic activity of these myeloid cell populations generated during retroviral transduction of murine bone marrow (BM) cells are not well known.
Different types of BM-derived cells, including B cells, dendritic cells (DCs), and other cell types, can function as tolerogenic antigen-presenting cells (APCs) (8,10). Immature myeloid cell populations with suppressive effects on T-cell responses were first reported four decades ago and were found to accumulate in the BM, spleen, and lymphoid tissues of tumor-bearing mice. Known as myeloid-derived suppressor cells (MDSCs) (12), they constitute a highly heterogeneous cell population that essentially has an immature phenotype and that, upon activation, suppresses adaptive immune responses. Murine MDSCs are defined as cluster of differentiation 11b positive [CD11b+ or macrophage antigen alpha polypeptide (Mac-1+)] and granulocyte receptor-1 positive (Gr-1+), and at least two different populations of MDSCs have been described: the CD11b+ Gr-1hi [lymphocyte antigen 6 complex, locus G+ (Ly6G+) Ly6Clo] or G-MDSCs and the CD11b+ Gr-1lo (Ly6G– Ly6Chi) or M-MDSCs. These two subtypes not only differ in their morphology and immunophenotype but also in their suppressive mechanisms (47): M-MDSCs are characterized by the production of nitric oxide (NO), whereas G-MDSCs produce high amounts of reactive oxygen species (ROS) (29,50). In addition to their nonspecific immunosuppressive properties, MDSCs are APCs that can present antigens in a tolerogenic manner (33).
We previously transduced murine BM cells with a viral vector encoding a peptide of the myelin oligodendrocyte glycoprotein (MOG40–55), an autoantigen used to induce experimental autoimmune encephalomyelitis (EAE), a model of multiple sclerosis. These cells induced tolerance and had a therapeutic effect upon transfer into mice with established MOG-induced EAE (5). The effect was dependent on transgene (antigen) expression in the transferred cells, and this was observed both in partially myeloablated and in nonablated recipients. Interestingly, the effect was seen very soon after BM cell infusion and it occurred in the absence of transduced cell engraftment. In fact, in these experiments, the cells transduced with the autoantigen were rejected in virtually all transplanted animals, including those undergoing sublethal myeloablation, most likely because of the previous immunization with the antigen used to induce the experimental disease. Thereafter, we hypothesized that the therapeutic effect was not dependent on central tolerance (which would necessarily be required for hematopoietic engraftment or repopulation), but rather was due to other types of transduced cells functioning as APCs, and was most likely mediated by peripheral tolerance mechanisms. In the present study, we have characterized the cell populations generated during retroviral transduction of murine BM cells. We show, for the first time, that the majority of the transduced cells generated during murine retroviral transduction are indeed MDSCs and that they comprise both MDSC subpopulations, and that, at least the M-MDSCs exhibit inducible NO synthase (iNOS) and arginase activity, produce ROS and are able to suppress T-cell responses in vitro.
Materials and Methods
Retroviral Vectors and Cell Lines
The generation of the pSF91-major histocompatibility complex (MHC) class II accessory molecule invariant chain-internal ribosome entry site-enhanced green fluorescent protein (pSF91-Ii-IRES-EGFP or Ii) and the pSF91-IiMOG-IRES-EGFP (or IiMOG) vectors is described elsewhere (5). We used the stable human vector-producing cell lines phoenix ecotropic (NX-e)/IiMOG and NX-e/Ii, which yield high viral titers (approximately 106 infectious particles per milliliter). These two cell lines were generated in our laboratory from the ecotropic NX-e packaging cell line (a gift from G. Nolan, Stanford University, CA, USA). Cells were maintained in Dulbecco's modified Eagle's medium (DMEM) that was supplemented with 10% fetal calf serum (FCS), 2 mM L-glutamine, 50 IU/ml penicillin, and 50 μg/ml streptomycin (all from PAA Laboratories GmbH, Pasching, Austria). The mouse myelomonocytic WEHI-3B cell line was used as a positive control in nitrite and ROS production and arginase activity assays. The murine fibroblastic NIH 3T3 cell line was used as a negative control in the ROS production assay. Both cell lines were purchased from the ATCC (Manassas, VA, USA).
Mice and EAE Induction
Thirty 6- to 8-week-old female congenic protein tyrosine phosphatase, receptor type, C allele a peptidase C allele B (B6/SJL-PtprcaPep3b/BoyJ) mice were bred in our animal facility from an original reproductive couple sourced from The Jackson Laboratory (Bar Harbor, ME, USA). The mice were housed under standardized light- and climate-controlled conditions and were fed with standard chow and water ad libitum. All experiments were performed in accordance with EU regulations and were approved by our Institutional Ethics Committee on Animal Experimentation. For EAE induction, anesthetized mice were immunized by subcutaneous injections of PBS containing 100 mg of MOG40–55 (Proteomics Section, Universitat Pompeu Fabra, Barcelona, Spain) that was emulsified in complete Freund's adjuvant (Sigma-Aldrich, St. Louis, MO, USA) containing 4 mg/ml of Mycobacterium tuberculosis H37RA (Difco Laboratories, Detroit, MI, USA). On days 0 and 2 postimmunization (p.i.), mice received 250 ng of pertussis toxin (Sigma-Aldrich) intravenously (7).
BM Cell Transduction
BM cells from donor mice were obtained by crushing the femurs, tibiae, and iliac crests of the donor mice 5 days after 5-fluorouracil (5-FU) treatment (100 mg/kg, intraperitoneally; Ferrer Farma, Barcelona, Spain) as previously described (3). Cells were seeded at a density of 106 mononuclear cells (MNCs)/ml on Retronectin® (Takara Bio Inc., Otsu, Japan) precoated plates (Nunc, Roskilde, Denmark). Cells were prestimulated for 48 h either with 10% conditioned medium (see the next section for how obtained) from the WEHI-3B cell line, as a source of mIL-3, and 8% conditioned medium from the baby hamster kidney-murine c-kit ligand (BHK-MKL) cell line (a gift from S. Tsai, Seattle, WA, USA), as a source of mSCF, as previously described (37). Alternatively, we used combinations of the following recombinant murine cytokines: mSCF, mTpo, mFlt3L, and mIL-3 (Immunotools, Friesoythe, Germany, all at 10 ng/ml). For two consecutive days, 90% of the culture medium was replaced daily by filtered (0.45 mm; Thermo Scientific Nalgene, Waltham, MA, USA) supernatants of the vector-producing cell lines plus the corresponding percentages of conditioned media or the recombinant cytokines and 4 mg/ml protamine sulfate (Rovi S.A., Madrid, Spain). On day 4 (24 h after the second infection cycle), the BM cells were harvested using Cell Dissociation Buffer (Invitrogen, Carlsbad, CA, USA) and transduction efficiency was assessed by flow cytometry. A fraction of the cells was labeled with monoclonal antibodies, and the two major myeloid cell populations were sorted (see the next section). Both unsorted and sorted cell populations were then used for further in vitro studies.
Obtaining Conditioned Media
For the BHK/MKL cell line, 106 cells were cultured in Roswell Park Memorial Institute 1640 (RPMI 1640; PAA) medium supplemented with 10% FCS, 2 mM glutamine and 50 UI/ml penicillin/50 μg/ml streptomycin on a T75 flask (Nunc). Once confluent, the cells were harvested and a 1/10 aliquot was cultured in at least four T175 flasks with 50 ml of medium for 7 days. The medium was then filtered (0.45 μm) and aliquots were stored at −80 C until used.
For the WEHI-3B cell line, 106 cells were cultured in Iscove's modified Dulbecco's medium (IMDM; PAA) supplemented with 10% FCS, 2 mM glutamine, 50 UI/ml penicillin/50 μg/ml streptomycin, and 0.05 mM β-mercaptoethanol (Sigma-Aldrich) on a T75 flask. Once confluent, the culture was split into at least four T175 flasks in 50 ml of medium. Once these cultures are confluent, the cells were harvested and a 1/10 aliquot was cultured in T175 flasks with 50 ml of medium for 7 days. The medium was then filtered (0.45 μm) and aliquots were stored at −80 C until used.
Immunophenotypic Analysis and Cell Sorting
Cell-surface staining was performed using the antimouse antibodies listed in Table 1. Labeled cells were analyzed using a FACSCanto flow cytometer (BD Biosciences, San Jose, CA, USA) and the FCS Express software (De Novo Software, Los Angeles, CA, USA). Cell sorting of the M-MDSC and G-MDSC populations was performed using a MoFlo cell sorter (Dako Cytomation, Glostrup, Denmark). Photomicrography pictures were taken under a 600× magnification using an Olympus DP70 camera adapted to an Olympus BX61 microscope, and the image capture software DP-BSW (Olympus, Tokyo, Japan). Lineage-negative (Lin) cells were analyzed using allophycocyanine (APC)-labeled Ab cocktail, which included CD3, CD4, CD8, CD11b, CD19, and Gr-1. Lineage-negative population was defined as CD45.1+ and negative for our Lin(-APC) cocktail. Dead cells were excluded by adding 7-amino-actinomycin (7-AAD) (Invitrogen) to the cell preparations prior to flow cytometric analyses at a final concentration of 5 μg/ml.
List of Antibodies Used

CD3, cluster of differentiation 3; PE, phycoerythrin; APC, allophycocyanin; bio, biotin; cy7, cyanine 7; PerCP, peridinin-chlorophyllprotein complex; FITC, fluorescein isothiocyanate; F4/80, mouse homolog of epidermal growth factor (EGF)-like module-containing mucin-like hormone receptor-like 1; Gr-1, granulocyte receptor 1; NK 1.1, natural killer 1.1; TER-119, lymphocyte antigen 76 (ly76); I-Ab, major histocompatibility complex (MHC) class II; H-2Kb, MHC class I; Ly6C, lymphocyte antigen 6 complex, locus C.
Suppression of MOG40-55 -Induced T-Cell Proliferation
Transduced total BM cells or the sorted MDSC populations were irradiated using a CisBio International IBL 437C gamma irradiator (Bagnols-Ceze, France), which uses a source of cesium 137 (137Cs) at a dose rate of 2.35 Gy/min (total, 25 Gy), and were added at different proportions to 105 splenocytes from mice with EAE (day 7 p.i.). The cells were then cultured in the presence or absence of 5 μg/ml MOG40-55 in 96-well U-bottom plates (Nunc) for 48 h. One microcurie of [3H]thymidine (Perkin Elmer, Waltham, MA, USA) was then added to each well, and cells were allowed to proliferate for 18 h before the amount of incorporated radioactivity was measured in a scintillation counter (1450 Microbeta LSC, Wallac Oy, Turku, Finland). The percentage of suppression of T-cell proliferation was calculated using the following formula: percent suppression = [1 – (cpm in the presence of MDSCs/cpm in the absence of MDSCs)] × 100%.
Nitrite Production Assay and Arginase Activity
A total of 105 transduced total BM cells, or the sorted cell subpopulations, were cultured in minimum essential medium with α modification (MEMα; Invitrogen) with or without lipopolysaccharide (LPS) (100 ng/ml) and interferon-γ (IFN-γ) (100 U/ml; both from Sigma-Aldrich) in 24-well plates (Nunc) for 24 h. iNOS activity was analyzed by measuring nitrite (NO2–) production in the supernatant using the Griess reaction (Sigma-Aldrich) in accordance with the manufacturer's recommendations. Arginase activity was measured as previously described (4). Briefly, 106 cells were lysed with 0.1% Triton X-100, and after 30 min, a buffer containing 25 mM Tris-HCl and 10 μM MnCl2 (pH 7.4) was added (all from Sigma-Aldrich). The reaction was halted by heating at 55°C for 10 min. Arginine hydrolysis was performed by incubating 50 μl of the activated lysate with 25 μl of 0.5 M L-arginine (pH 9.5; Sigma-Aldrich) at 37°C for 2 h. The reaction was stopped with 240 μl of an acidic mixture [H2O/H3PO4(85%)/H2SO4 (96%), 7:3:1 v/v; Sigma-Aldrich]. Urea concentration was calculated from the optical densities measured at 550 nm in a Triturus® Immunoassay System (Grifols, Barcelona, Spain) after the addition of 10 μl of 6% α-isonitrosopropiophenone (Sigma-Aldrich), and the entire mixture was dissolved in absolute ethanol and heated at 100°C for 30 min. One unit of enzyme activity was defined as the amount of enzyme that catalyzes the formation of 1 μmol of urea per minute. The WEHI-3B cell line was used as a positive control for both assays.
ROS Detection
ROS production by MDSCs was measured at day 4 of transduction culture using the oxidation-sensitive probe CellROX™ Deep Red Reagent (Invitrogen). Cells were incubated with the transduction media in the presence of 5 μM of CellROX™ for 30 min at 37°C according to the manufacturers' instructions. NIH 3T3 and WEHI-3B cell lines were use as negative and positive controls, respectively. Cells were washed with cold PBS, labeled with conjugated anti-CD11b and anti-Gr-1 antibodies, and analyzed using a FACSCanto flow cytometer.
Cell Morphology
The cells were cytospun onto microscope slides and stained using the May Grünwald-Giemsa method (Sigma-Aldrich) to allow the morphology of the cells to be visualized.
Statistical Analysis
Data are expressed as the mean (SD) unless otherwise stated. Comparisons between means were performed using a Student's t test (11), paired or unpaired, depending on the type of data, and with one or two tails, depending on the hypothesis. For multiple comparisons, one-way ANOVA with Bonferroni post hoc test correction was performed. Values of p < 0.05 were considered statistically significant. The statistical analysis was performed and the figures were generated using the software GraphPad Prism (GraphPad Software, Inc., La Jolla, CA, USA).
Results
BM Cell Transduction Cultures Drive Myeloid Differentiation
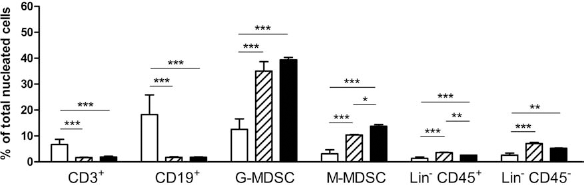
BM cells were obtained as a single-cell suspension from 5-FU-treated mice (100 mg/kg intraperitoneally on day −5) by crushing femora, tibiae, and the iliac crests in a mortar and sieving through a 70-μm sterile nylon filter. Immunophenotypic analyses were performed before and after transduction (days 0 and 4). On day 4, the proportions of B220+ (CD45R), CD4+, CD8+, and natural killer (NK) 1.1+ cells were greatly reduced, whereas those of nonhematopoietic [CD45– lineage (Lin)–] cells and cells expressing CD11b and Gr-1 myeloid markers were significantly increased compared with fresh BM cells (day 0). Indeed, the percentage of the two subtypes of G-MDSCs and M-MDSCs increased by two- and fivefold, respectively (Fig. 1a). The absolute number of cells of these subtypes also increased, indicating that they were generated de novo or were expanded during culture. On day 4, the transduction efficiency (measured as the percentage of EGFP+ cells) was 29.1% (0.9) [mean (SD)] for the MOG-encoding vector and 30.2% (1.2) for the control vector. The effectively transduced cells mainly consisted of populations of M-MDSCs, G-MDSCs, Lin– CD45+, and Lin– CD45– cells, which represented 37.9% (10.2), 26% (3.4), 6.1% (0.3), and 13.5% (4.2) of the total cells, respectively (Fig. 1b). To determine whether this differentiation pattern was specific to our culture conditions, which involved the use of conditioned media as a source of cytokines, we analyzed the phenotype of BM cells transduced using more standard and defined combinations of recombinant cytokines. Two cytokine combinations containing recombinant murine SCF (mSCF), murine Tpo (mTpo), and murine Flt3L (mFlt3L) in the presence and in the absence of murine IL-3 (mIL-3) resulted in similar proportions of cell subpopulations to those described above (Fig. 2). In this regard, the presence of mIL-3 resulted in a significantly higher percentage of M-MDSCs and a lower percentage of Lin– CD45+ (immature progenitors). Additionally, to determine whether the generation of MDSCs was dependent on retroviral transduction itself, we performed BM cultures using conditions similar to those of transduction but skipping the vector exposure steps. These cultures yielded similar percentages of myeloid cell subpopulations than those using viral vectors (data not shown).

Cell populations in fresh and MOG-transduced BM cells. (a) Bars indicate the percentage of the different cell subpopulations within the bone marrow (BM) cells of 5-fluorouracil (5-FU)-treated mice at day 0 (white bars) and after the 4-day transduction culture (black bars). (b) The percentage of cell subpopulations within the transduced cells was analyzed by gating on enhanced green fluorescent protein positive (EGFP+) cells. Error bars correspond to standard deviations (SD). *p < 0.05, **p < 0.01, ***p < 0.001 (n = 3). MOG, myelin oligodendrocyte glycoprotein; CD4, cluster of differentiation 4; NK, natural killer; MDSC, myeloid-derived suppressor cell; Lin–, lineage negative.
Cell populations in fresh and MOG-transduced BM cells using two different combinations of recombinant cytokines. Bars represent the mean percentages of the different cell subpopulations at day 0 (white bars) and after the 4-day transduction culture in the presence of mouse stem cell factor (mSCF), mouse fms-related tyrosine kinase 3 ligand (mFlt3L), and mouse thrombopoietin (mTpo; patterned bars) or this mixture plus mouse interleukin-3 (mIL-3; black bars). Error bars correspond to SD. Comparisons were made using the one-way ANOVA test with the Bonferroni posttest correction. *p < 0.05, **p < 0.01, ***p < 0.001 (n = 3).
A further phenotypic characterization of the two myeloid cell populations is summarized in Figure 3. Both types of MDSCs were largely CD14– cells expressing MHC class I (H-2Kb+) and low levels of class II (I-Ab+). However, in contrast to G-MDSCs, M-MDSCs expressed low levels of F4/80 [mouse homolog of epidermal growth factor (EGF)-like module-containing mucin-like hormone receptor-like 1], CD124 (IL-4 receptor α chain, IL-4Rα) and the costimulatory molecules CD80, CD86, and CD40 (Fig. 3a). CD11c expression was observed in only a small percentage of CD11b+ cells, but these cells were Gr-1–(data not shown). To determine whether labeling with the anti-Gr-1 antibody was equivalent to that using the Ly6G/Ly6C antibodies, we stained transduced BM cell samples with anti-CD11b and either anti-Gr-1 or the combination Ly6-G/Ly6C (see Table 1). The percentages of CD11b+Gr-1hi and CD11b+ Gr-1lo cell populations were analogous to those of CD11b+ Ly6G+ Ly6Clo and CD11b+ Ly6G– Ly6Chi cells, respectively, as previously reported (data not shown). Sorted G-MDSC and M-MDSC populations (mean purity > 98%) were cytospun onto microscope slides and were stained using the May Grünwald-Giemsa method. Morphologically, the G-MDSC population was enriched for cells with ring-shaped and segmented nuclei, which resembled granulocytes or granulocyte precursors, whereas M-MDSCs resembled monocytes (Fig. 3b).
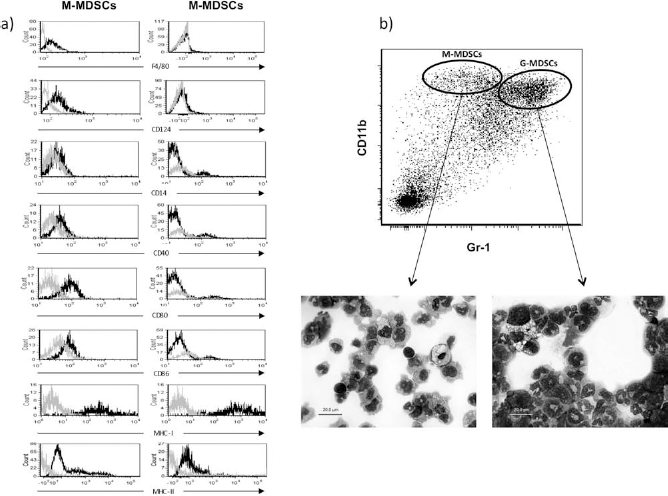
Immunophenotype and morphology of MOG-transduced MDSCs. (a) Histograms correspond to the immunophenotypic characterization of G-MDSC and M-MDSC subpopulations analyzed using a first forward scatter (FSS)-SSC gating and a second SSC-7 aminoactinomycin D (7-AAD) gating to exclude dead cells from the analysis. Gray lines represent the isotype control and black lines the specific labeling with phycoerythrin (PE)-conjugated specific antibodies. (b) Photomicrographs show the morphology of the sorted populations of representative M-MDSCs (left) and G-MDSCs (right) upon May Grünwald-Giemsa staining. Note their monocyte-like and granulocyte-like morphology, respectively. F4/80, mouse homolog of epidermal growth factor (EGF)-like module-containing mucin-like hormone receptor-like 1; Gr-1, granulocyte receptor 1; MHC-1, major histocompatibility complex 1 (H-2Kb); MHC-II, I-Ab.
To determine whether BM-derived Lin– CD45– cells were mesenchymal stromal cells (MSCs), BM cells transduced for 4 days were labeled with a cocktail of allophycocyanin (APC)-labeled antibodies against Lin markers [CD3, CD45R, CD11b, Gr-1, and TER-119 (lymphocyte antigen 76; ly76)] and a series of antibodies to MSC markers (see Table 1). Most Lin– CD45– cells were also CD29+CD44+, and they majorly expressed CD90, CD105, low levels of MHC class I, and no class II, a phenotype that is equivalent to that of MSCs (Fig. 4). Due to technical difficulties that we found in obtaining enough numbers of pure or highly enriched MSC populations, and because the immunosuppressive ability of such cells has been extensively reported by many authors (41), for the functional studies we decided to focus on the myeloid component that included the two major MDSC populations.

Phenotypic analysis of mesenchymal stromal cells (MSCs). BM cells were transduced for 4 days using the MOG-encoding vector, labeled with monoclonal antibodies, and analyzed by flow cytometry. Histograms show the gating strategy and the analysis of a representative sample. Cells were labeled with an anti-CD45 antibody, a combination of allophycocyanin (APC)-labeled antibodies against lineage (Lin) markers [anti-CD3, anti-CD45R, anti-CD11b, anti-Gr-1, and anti-TER-119 (lymphocyte antigen 76; ly76)], anti-CD29, and anti-CD44 antibodies (see Table 1). The labeled cells were then split into four tubes, and each sample was incubated with one of the following PE-labeled antibodies: anti-CD90, anti-CD105, anti-H2-Kb (MHC class I), or anti-I-Ab (MHC class II). Uniparametric histograms show the expression of these markers (gray line, isotype black line) on the gated Lin– CD45– CD29+ CD44+cell population. Cy7, cyanine 7; PerCP, peridinin-chlorophyll-protein complex; FITC, fluorescein isothiocyanate.
Total BM Cells and Purified Myeloid Cell Subpopulations Have Arginase and iNOS Activities and Generate ROS
The activities of the enzymes arginase and iNOS, which are two important mediators of the suppressive effects of MDSCs, were analyzed in transduced total BM cells and in the two myeloid cell subpopulations using colorimetric assays. As shown in Figure 5, total BM cells displayed the highest basal levels of arginase, but M-MDSCs were the only cell type that significantly increased the enzyme activity (twofold) upon stimulation with LPS and IFN-γ. As for iNOS activity, basal levels were negligible in all cell types, but they were significantly increased in total BM cells (sixfold) and M-MDSCs (10-fold) upon stimulation. This last cell population also showed a significantly higher level of ROS production in comparison with total BM cells or G-MDSC (Fig. 5).

Arginase and iNOS activities and ROS production by MOG-transduced MDSCs. M-MDSCs display higher levels of arginase (a) and induced nitric oxide synthase (iNOS) activity (b) upon stimulation with lipopolysaccharide (LPS) and interferon (IFN)-γ, and reactive oxygen species (ROS) production (c). A total of 105 transduced BM cells or sorted M-MDSCs or G-MDSCs were tested for arginase and iNOS activity. The levels of arginase activity (top chart) and iNOS activity (middle chart) corresponding to the different cell types are shown for nonstimulated cells (white bars) and upon stimulation with LPS and IFN-γ (black bars). The same numbers of mouse myelomonocytic WEHI-3B and mouse fibroblast NIH 3T3 cells were used as a positive and negative control, respectively. (c) ROS production (bottom chart) was measured by flow cytometry as described in Materials and Methods. M-MDSCs produced relatively higher amounts of ROS in comparison with G-MDSCs or total BM cells. BMC, bone marrow cells; MFI, mean fluorescence intensity. Error bars correspond to standard error of the mean (SEM). *p < 0.05, **p < 0.01 (n = 3).
Cultured BM Cells and Purified Myeloid Cell Subpopulations Suppress MOG40–55-Induced T-Cell Proliferation
To determine whether the cells generated during transduction suppressed T-cell responses, transduced total BM cells and the sorted myeloid cell subpopulations were irradiated (2500 cGy) and cultured at different ratios in the presence of MOG40–55 with splenocytes obtained from MOG-induced EAE mice, and proliferative responses were analyzed by tritiated thymidine incorporation assays. Transduced total BM cells and the two MDSC populations inhibited antigen-induced splenocyte proliferation. However, although G-MDSCs exhibited similar suppressive activity to that of M-MDSCs at low MDSC-splenocyte ratios, there was not a clear dose-dependent linear effect at higher ratios. As for BM cells and M-MDSCs, their suppressive effects were clearly dose dependent, and MOG-transduced cells suppressed antigen-specific proliferation to a higher extent than their sham-transduced controls, although the differences were not statistically significant at all the cell ratios tested (Fig. 6).
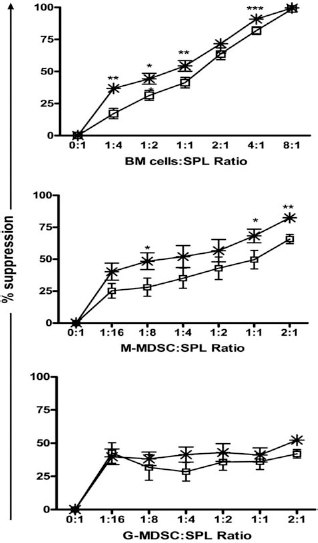
Transduced BM cells and sorted MDSCs subpopulations suppress antigen-induced T-cell proliferation. Charts show the percentage of suppression of MOG40–55-induced splenocyte proliferation by irradiated transduced total BM cells (top), purified M-MDSCs (middle), and purified G-MDSCs (bottom) transduced with either the vector encoding the MOG antigen (asterisks) or the control vector (empty squares). Error bars correspond to SEM. *p < 0.05, **p < 0.01, ***p < 0.001.
Discussion
In this work, we show that standard 4-day hematopoietic retroviral transduction cultures result in the generation of large amounts of M-MDSC and G-MDSC populations, which are able to suppress T-cell responses in vitro. Among the successfully transduced cells, the proportions of MDSCs are also very high, overall representing about half of the total. Sorted M-MDSCs display higher levels of arginase and iNOS activity, ROS production, and a stronger suppressive effect on antigen-induced T-cell proliferation in vitro than G-MDSCs.
In mice, CD11b+ Gr-1+ cells represent about 20–30% of the nucleated BM cells (13). In our BM donors, we found lower percentages of these cells, which could be attributed to the effect of 5-FU, a chemotherapeutic drug that is usually administered 2 to 5 days prior to the BM culture to deplete cycling cells. This treatment enriches the BM in immature hematopoietic progenitors and ultimately induces their proliferation, a requisite for an efficient retroviralmediated gene transfer. However, 5-FU has also been reported to kill MDSCs (44). Because γ-retroviral vectors can only transduce dividing cells, ex vivo gene transfer into hematopoietic cells generally relies on the exposure of cells to combinations of cytokines that promote cell survival and induce cell division. For murine hematopoietic cell transduction, the most common cytokine combinations include several of the following: SCF, IL-3, IL-6, IL-11, Tpo, and Flt3L (15). Some of these molecules have been implicated as contributing to the generation of MDSCs, including SCF (36), IL-6 (22), and Flt3L (23). Another factor that may facilitate the generation of MDSCs during retroviral transduction is the use of conditioned media derived from tumors or immortalized cell lines (38,46). Retroviral vectors are usually generated in packaging cell lines such as the human embryonic kidney (HEK)-293T, which is tumorigenic in mice. In addition, the supernatants that we used as a source of mSCF and mIL-3 were also conditioned from cultures of tumor-derived or tumorigenic cells (BHK-MKL and WEHI-3B cell lines, respectively). However, the use of these two conditioned media was probably not critical for MDSC generation because their substitution by recombinant cytokines also resulted in the generation of similar proportions of MDSCs. The presence of IL-3 was found to significantly increase the proportion of M-MDSCs and reduce that of Lin– CD45+ cells, in concordance with the reported effect of this cytokine in inducing myeloid differentiation and in favoring macrophage as opposed to granulocytic differentiation, especially when used in combination with Flt3L (18).
The myeloid cells generated in our transduction cultures fulfill many of the phenotypic and functional criteria that define MDSCs: They comprise a heterogeneous population of cells that express myeloid markers, including those characteristic of the two main subsets (G- and M-MDSCs), and, especially the M-MDSCs, express arginase and iNOS, produce ROS, and suppress adaptive immune responses. These MDSCs expressed MHC class I and low levels of class II molecules. In contrast to human MDSCs, which are more often defined as human leucocyte antigen (HLA)-DRlow/–, murine MDSCs were reported to have variable expression of MHC class II (25,32). Expression of MHC class II and CD40L was found to be induced in MDSCs upon activation, and this expression was required for mediating the generation of T regulatory (Treg) cells in vivo and for the induction of tolerance (35). The importance of MHC class II expression by MDSCs was also demonstrated by the fact that MDSCs from mice lacking such molecules failed to induce Treg cell expansion in vitro (48).
MDSCs may exert both nonspecific immune suppressive effects and antigen-specific suppression, thus leading to tolerance (14,19,21,30,33,39,40,42,48). However, because in our previous study MOG-induced EAE mice responded only to the transfer of BM cells transduced with the autoantigen (5), we can reasonably argue that tolerogenic antigen presentation is required for the therapeutic effect observed. This notion is also supported by the fact that the vector system used to express the antigen, in which the sequence encoding the class II invariant chain-derived peptide (CLIP) region of the Ii has been replaced by the sequence encoding the antigenic peptide (MOG40–55), has already demonstrated to efficiently target antigen presentation via MHC class II (2). We show that MDSCs express both class I and class II MHC molecules, which are required for antigen presentation to T cells, and this is in agreement with a recent report demonstrating that MHC class II expression by MDSCs was essential for inducing CD4+ T-cell tolerance (30). Finally, the higher level of suppression of splenocyte proliferation by total BM cells and M-MDSCs transduced with the antigen in comparison to that produced by their controls also support the notion of a tolerogenic antigen presentation by these cells to CD4+ T cells. As for G-MDSCs, suppression activities were similar for both MOG-transduced and controls. A potential reason that may contribute to this apparent discrepancy is the fact that M-MDSCs are transduced at a much higher rate than G-MDSCs, most likely because of their higher proliferative rates (their fold expansion after the culture is about five times vs. two times for G-MDSCs). Consequently, at the end of the culture, effectively transduced M-MDSCs double the percentage of transduced G-MDSCs, despite the fact that the percentages of total G-MDSCs are about 1.5-fold higher than those of M-MDSCs, as seen in Figure 1. When calculating the effector/suppressor cell ratios for the suppression assays, we considered the relative amounts of total MDSCs that were present in the unfractionated BM cell population, but not those of effectively transduced cells, for practical reasons, and this has to be taken into account when comparing the results.
Arginase-1+ MDSCs were reported to be present in the CNS-demyelinating lesions of mice with EAE in amounts that correlated with the clinical score, and these cells induced cell death when cocultured with splenocytes, suggesting that MDSCs could play a role in regulating autoimmune processes (28). Because different types of MDSCs can use different mechanisms of suppression, they may also have different tolerogenic potentials. Suppression by murine M-MDSCs is mediated by arginase-1, NO, prostaglandin E2 (PGE2) and cytokines and does not require cell-to-cell contact. In contrast, suppression by G-MDSCs was reported to be mediated by ROS production (50), requires physical contact with T cells and is more often associated with tolerance induction (31,49). Surprisingly, we found higher levels of ROS production by M-MDSCs than by G-MDSCs, which is not in agreement with previous reports. This discrepancy may be explained by the different experimental conditions we used, for example, the exposure to cytokines such as IL-3, which may induce ROS production in murine hematopoietic cells (17).
Ex vivo generation of MDSCs can be suitable for therapeutic applications in transplantation (14), graft-versushost disease (GVHD) (16,25), or autoimmunity (28,53). Different types of MDSCs can be generated by culturing monocytes or hematopoietic progenitors in the presence of cytokines and growth factors (22,25), or tumor-derived products such as tumor exosomes (46) and conditioned media (6,34). As an illustrative example, MDSCs were generated from murine BM cultures after exposure to high doses of granulocyte-macrophage colony-stimulating factor (GM-CSF) for 4 days, or to lower concentrations of the cytokine, and maintaining the cells in culture for 10 days. Different subsets of MDSCs including CD115+ Ly-6C+(M-MDSCs) and CD115+ Ly-6C– (G-MDSCs) populations can also be generated from mouse embryonic stem cells (ES) and adult BM cells. In vitro, ES- and BM-derived MDSCs suppressed T-cell proliferation induced by polyclonal stimuli or alloantigens via multiple mechanisms involving iNOS-mediated NO production and IL-10. In addition, they induced CD4+ CD25+ Foxp3+ Treg cell development. In vivo, these cells prevented alloreactive T-cell-mediated GVHD upon adoptive transfer (52).
For human MDSCs, the cytokines GM-CSF, G-CSF, and IL-6 were reported to allow a rapid generation of MDSCs from precursors present in the BM and that the immunoregulatory activity of BM-MDSCs was dependent on the cytidine-cytidine-adenosine-adenosine-thymidine (CCAAT)-enhancer-binding protein (C/EBP) transcription factor (27). More recently, the same group described a promyelocytic-like population that was responsible for the immune suppression mediated by BM-MDSCs (43). Interestingly, in another report, BM-derived MSCs were found to transform activated murine peritoneal macrophages into cells with an immunoregulatory phenotype, and this effect was partially mediated by PGE2 production (26).
To summarize, in this work we show that γ-retroviral transduction of murine hematopoietic cells using standard protocols generates transgene-expressing MDSCs that are suppressive in vitro. First and foremost, we believe that this immunomodulatory potential is of great relevance and could be clinically exploited as it may contribute to induce immune tolerance. Moreover, the possible generation of MDSCs with suppressive and/or tolerogenic activity should be prospectively addressed and taken into account in hematopoietic cell expansion protocols and in clinical gene therapy trials. In this regard, more experimental work including in vivo studies is required to validate or broaden these observations.
Footnotes
Acknowledgments
We thank C. Baum (Hannover Medical School, Hannover, Germany) for providing the retroviral vector backbone. This work was supported by grants from the European Union FP6 (LSHB CT2004-005242, CONSERT) and the “Fondo de Investigación Sanitaria” (FIS), “Instituto de Salud Carlos III” (ISCIII), Ministry of Economy and Competitivity (MEC), Spain (PI 09/00237). The authors thank the “Red Española de Esclerosis Múltiple,” from FIS (ISCIII), MEC, Spain (RD07/0060), and the “Ajuts per donar Suport als Grups de Recerca de Catalunya” (2009 SGR 793), which is sponsored by the “Agència de Gestió d'Ajuts Universitaris i de Recerca” (AGAUR), Generalitat de Catalunya, Spain. A.G. and S.P. were supported by a FI-AGAUR grant from the Generalitat de Catalunya. C.E., R.G., and J.B. are partially supported by the Miguel Servet program of the FIS (ISCIII), MEC, and by the Generalitat de Catalunya. H.E. is supported by the “Sara Borrell” program, FIS (ISCIII), MEC, Spain. The authors declare no conflict of interest.