
Abstract
Canine mesenchymal stem cells (cMSCs) have generated a great interest as a promising source for cell-based therapies. To understand the basic biological properties of cMSCs derived from bone marrow (cBM-MSCs), adipose tissue (cA-MSCs), and dermal skin (cDS-MSCs) from a single donor, the present study compared their alkaline phosphatase (AP) activity, expression of CD markers and stem cell transcription factors, differentiation ability into osteogenic, adipogenic, and chondrogenic lineages, in vivo ectopic bone formation, chromosomal stability, cell cycle status, telomere length, and telomerase activity. Expressions of AP activity and transcription factors (Oct3/4, Nanog, and Sox2) were either absent or extremely weak in all cMSCs. CD marker profile (CD45-, CD90+, and CD105+) and differentiation capacity were exhibited by all cMSCs, although cA-MSCs had enhanced cytochemical staining associated with expression of lineage-specific markers. In vivo bone formation of cMSCs was performed with demineralized bone matrix (DBM) by transplanting into the subcutaneous spaces of 9-week-old BALB/c-nu mice, followed by radiographic and histological analysis after 1 and 2 months. cA-MSCs and cDS-MSCs, in contrast to the in vitro observations, also displayed higher in vivo osteogenic abilities than cBM-MSCs. Ploidy analysis showed that cells were diploid and contained no noticeable chromosomal abnormalities. Furthermore, a relatively low percentage of cells was found at the G1 phase in all cMSCs, especially in DS-MSCs. Regardless of the different tissue sources, cMSCs from a single donor showed no differences in telomere lengths (~18–19 kbp) but exhibited varied telomerase activity. The above results suggest that tissue-specific cMSCs derived from a single donor possess slight differences in stem cell properties.
Keywords
Introduction
Mesenchymal stem cells (MSCs) have been identified as a promising cell source for tissue engineering and regenerative medicine due to their presence in several adult tissues, ability to self-renew, and potential for multilineage differentiation (9). Canine MSCs (cMSCs) have been isolated from various tissues, such as bone marrow (8), adipose tissue (4,8), umbilical cord blood (28), and umbilical cord vein (32). MSCs derived from these tissue sources have been shown to differentiate toward osteogenic, adipogenic, chondrogenic, and neurogenic lineages. In addition, canine adipose tissue-derived MSCs have demonstrated the immunomodulatory effects to make them suitable for treating immune-mediated diseases (13). It is well known that the prospective clinical applications of these MSCs would largely be based on abundance, expansion potential, and multilineage differentiation abilities.
Given the advantages of the most important tissue sources for MSCs, it is of high significance to evaluate and compare their basic biologictal characteristics in a highly relevant preclinical model, such as the dog. Canines are a promising biomedical model for the evaluation of stem cell-based therapies both in experimental and in spontaneous disease conditions, as they have long life span, outbreed, and types of diseases similar to humans (24). Preclinical studies conducted in canine model are highly valuable to human applications and provide evidence on the safety and efficacy of MSCs for cell transplantation.
In this direction, successful canine stem cell transplantation studies have been reported earlier (4). Furthermore, cMSCs have been shown to differentiate into selected lineages in vivo (2). Despite a promising potential of cMSCs in regenerative medicine, a few studies have been carried out to characterize in-depth studies using cells derived from a variety of sources. Moreover, differences in the proliferation rate and differentiation potential of cMSCs have been related to donor-associated variability. To overcome these limitations, a donor-matched comparison of cMSCs derived from different tissue origins is highly desirable for evaluating their potential applications.
Important biological factors relevant to cellular therapy are self-renewal, pluripotency, and senescence. Even though MSCs have transdifferentiation ability and broader plasticity than originally envisaged, no conclusion has been arrived on their expression of octamer-binding transcription factor 3/4 (Oct3/4), Nanog, and sex-determining region Y box 2 (Sox2) transcription factors, which are critical for the normal development and maintenance of self-renewal and pluripotency (16). Moreover, embryonic or undifferentiated cells, stem cells, and cancer cells have been known to possess relatively long telomere length and higher telomerase activity, preventing the reduction of telomere length to maintain chromosomal stability (20). Telomerase is a ribonucleoprotein complex consisting of an RNA subunit (TR) that contains a domain complementary to the telomeric repeat sequence TTAGGG and a catalytic protein component [telomerase reverse transcriptase (TERT)] (20,31). Generally, gradual shortening of telomeres acts as a trigger for cell growth arrest and cellular senescence at low telomerase activity (20). In this view, the evaluation of telomere length and telomerase activity as biomarkers of proliferation potency and differentiation capacity of cMSCs is much warranted.
Therefore, in order to understand the basic biological properties of cMSCs derived from bone marrow (cBM-MSCs), adipose tissue (cA-MSCs), and dermal skin (cDS-MSCs) from a single donor, the present study compared their alkaline phosphatase (AP) activity, expression of cell surface markers [cluster of differentiation 45– (CD45-), CD90+, and CD105+] and early stem cell transcription factors (Oct3/4, Nanog, and Sox2), ability to differentiate in vitro into osteocytes, adipocytes, and chondrocytes, in vivo ectopic bone formation, chromosomal stability, cell cycle status, telomere length, and telomerase activity.
Materials and Methods
All chemicals were purchased from Sigma Chemical Company (St. Louis, MO, USA), and media were from Gibco (Invitrogen, Burlington, ON, Canada), unless otherwise specified.
Isolation and Culture
All experiments were authorized by the Animal Center for Biomedical Experimentation at Gyeongsang National University. An approximately 2-year-old female beagle (Covance Research Products, Denver, PA, USA) was used for this experiment under standard surgical procedures.
Bone marrow was aspirated from the femur for the isolation of cBM-MSCs as previously described (18). cA-MSCs were derived from subcutaneous adipose tissue by following the method described earlier (5). cDS-MSCs were isolated from the dermal layer of the ear skin as described by Riekstina et al. (25) after removing the epidermis. All cells were cultured in advanced Dulbecco's modified Eagle's medium (DMEM) supplemented with 10% fetal calf serum (FCS) and 1% penicillin–streptomycin (10,000 IU and 10,000 μg/ml) at 38.5°C in 5% CO2. Cells reached ~90% confluence at 7–10 days after being cultured (passage 0). Once confluent, cells were dissociated using 0.25% trypsin–EDTA solution and made into pellets at 300 × g for 5 min. Cells were cultured and passaged six times for further analysis.
Testis tissues of an ~2-year-old male beagle were obtained after a routine surgical castration at the Animal Hospital of the Gyeongsang National University, Jinju, Korea, and the isolated cells were used as positive control for the analysis of Oct3/4, telomere length, and telomerase activity.
Alkaline Phosphatase (AP) Activity
cMSCs grown on 35-mm dishes for 2 weeks were stained with AP chromogen kit (BCIP/NBT) (Abcam, Inc., Cambridge, MA, USA) to detect AP activity after being fixed with 4% formaldehyde (triplicates). Positivity of cMSCs to AP reaction was indicated by a purple brown color.
Immunofluorescence Staining
Expression of cell surface antigens and pluripotent stem cell markers was analyzed by immunofluorescence staining in all cMSCs following previously published procedures (6) with minor modifications. CD markers employed were fluorescein isothiocyanate (FITC)-conjugated CD45 (Sigma), CD90 (THY1; BD Bioscience, San Jose, CA, USA), and Alexa Fluor-conjugated CD105 (Endoglin; AbD Serotec, UK). Oct3/4, Nanog, and Sox2 (Santa Cruz Biotechnology, Inc., Santa Cruz, CA, USA; 1:200) were analyzed as pluripotent stem cell markers (triplicates). Secondary antibodies employed were FITC-conjugated donkey anti-goat IgG (Oct3/4 and Nanog, 1:200) and goat anti-rabbit IgG (Sox2, 1:200). Cells were counterstained using 1 μg/ml propidium iodide (PI) and mounted on precleaned slides to be observed under a confocal microscope (Olympus, Tokyo, Japan).
cMSCs exhibiting green (FITC) and yellow (FITC + PI) were considered as positively stained.
Analysis of Oct3/4 and Cell Cycle by Flow Cytometry
Cells were analyzed for Oct3/4 expression by flow cytometry (Becton Dickinson FACSCalibur, Franklin Lakes, NJ, USA) following the manufacturer's instructions (Stem Cell Technologies, Vancouver, BC, Canada). For the analysis of cell cycle by flow cytometry, cells were fixed with 70% ethanol, washed twice with Dulbecco's phosphate-buffered saline (D-PBS), and stained with 10 μg/ml PI solution. Analysis of Oct3/4 levels and cell cycle was performed three times with 5,000 cells/sample or 10,000 cells/sample, respectively, at a time.
In Vitro Differentiation Potential
Cells at ~80% confluence were induced into adipogenic or osteogenic differentiation by following the procedures explained by Ock et al. (22). The differentiation medium was replaced every 3 days for 3 weeks. This experiment was performed in triplicates.
Differentiated adipocytes or osteocytes were fixed with 3.7% formaldehyde or 70% ethanol, respectively, and stained with 0.5% Oil red O solution or 40 mM Alizarin red solution for 1 h, respectively. The stained cells were washed several times with distilled water before subjected to photography.
Chondrogenic induction of cMSCs was performed for 3 weeks following two methods: micromass culture and pellet culture. Micromass culture was performed using Stempro® kit (Invitrogen/Gibco, Grand Island, NY, USA) according to the manufacturer's instructions. Pellet culture was performed by Thermo Scientific hyClone Advance STEM™ chondrogenic differentiation kit (Thermo Fisher Scientific, Logan, UT, USA) following the manufacturer's instructions. Chondrogenic induction medium was replaced every 3 days. At every week, the pellets were recovered for RNA extraction. After 3 weeks, the micromass and the pellets were fixed with 3.7% formaldehyde for 30 min, embedded with optimal cutting temperature (OCT) compound (Tissue-Tek®, Sakura, Tokyo, Japan), and cut at a thickness of 10 μm. The sections were evaluated by histochemical staining with 1% Alcian blue solution (glycosaminoglycans) for 30 min or immunofluorescence staining with goat polyclonal aggrecan (cartilage-specific proteoglycan core protein) antibody (dilution 1:100; Santa Cruz Biotechnology, Inc., Europe, Heidelberg, Germany) and donkey anti-goat IgG-Texas red antibody (dilution 1:100; Santa Cruz Biotechnology, Inc., Europe) for 1 h, respectively, and counterstaining followed with 1 μg/ml 4′,6-diamidino-2-phenylindole (DAPI) solution for 30 min. This experiment was performed in four replicates.
In Vivo Ectopic Bone Formation Assay
For the comparison of in vivo bone formation capacity, all cMSCs (1 × 10⁷ cells/ml) were labeled with 2 × 10⁻⁶ M PKH26 red fluorescent cell linker for 5 min. To enhance the in vivo osteoinductivity of cMSC, demineralized bone matrix (DBM, Osteotech, Eatontown, NJ, USA) plugs were used as scaffolds (14). Labeled cMSCs (1 × 10⁶ cells) were resuspended into 50 μl Ca2+-free D-PBS and 30% reduced Matrigel (BD Biosciences, Cowley, Oxford, UK) on ice. Each group (control group as DBM/DPBS, each treatment group as DBM/cBM-MSCs, DBM/cA-MSCs, and DBM/cDS-MSCs) was added to each 4 × 5 × 3-mm DBM plug and cultured for 1 h at 37°C in CO2 incubator. Each DBM/DPBS or cMSC was implanted into four subcutaneous pockets created separately in the dorsal surface of 9-week-old male BALB/c-nu mice (Institute of Medical Science, University of Tokyo, Japan) as previously described (14), under similar conditions for every mouse (n = 10). These procedures were performed by following the ethics-approved protocol (GLA-110902-M0037 by Gyeongsang National University). At 1 and 2 months posttransplantation, mice were evaluated for new bone formation by both X-ray examination for the confirmation of calcification and histological analysis of transplants after sacrifice. Transplants for histological analysis were recovered from mice, fixed with 3.7% formalin for 1 day, dehydrated with 20% sucrose solution for 1 day, and embedded with OCT compound on LN2 for cryosectioning process. Sections were cut to a thickness of 10 μm. Histochemical staining was performed with 2% Alizarin red S solution or hematoxylin and eosin (H&E). Immunofluorescence staining was performed with 1 μg/ml DAPI solution as a counterstain for 30 min.
Ploidy Analysis
Cells at ~80% confluence were cultured in 0.05 μg/ml demecolcine solution to arrest their cell cycle at the M phase for 5 h. Following 0.25% trypsin–EDTA treatment, the cells were harvested and incubated in 75 mM KCl solution for 20 min and fixed with 1:3 (acetic acid/methanol) solution for 10 min at −4°C. Cells were dropped on cold slides, dried on a warm plate, and stained in 4% Giemsa solution. The slides were observed under a light microscope at 1,000× magnification and classified as haploid, diploid, and tetraploid. This experiment was performed in triplicate.
Analysis of Telomere Length
Genomic DNAs from each sample were extracted by GENE ALL™ Tissue SV plus mini kit (General Biosystem, Seoul, Korea). A total of 1 μg DNA was used for telomere length analysis with Telo TAGGG Telomere Length Assay kit (Roche, Mannheim, Germany), following the manufacturer's instructions (in triplicates). The telomere lengths were calculated by scanning the exposed X-ray film with Unok-8000 Gel Manager System Gel viewer 1.5 (Biotechnol04 ogy, Seoul, Korea). Mean telomere lengths were calculated with the formula: mean terminal restriction fragment (TRF) ∑(OD i )/∑(OD i > /L i ). OD i is the optical density at a position i on the lane, and L i is the corresponding TRF length at position i on the lane. This formula takes into account the higher signal intensity generated by larger TRFs.
Reverse Transcription-Polymerase Chain Reaction (RT-PCR)
Total RNAs and testis tissue were extracted from the cMSCs before and after differentiation using RNeasy mini kit (Qiagen, Germantown, MD, USA) in accordance with the manufacturer's instructions. cDNA synthesis of the samples to analyze Oct4, runt-related transcription factor 2 (Runx2), peroxisome proliferator-activated receptor g (Pparg), and Sox9 genes was performed from 1 μg total RNA at each specific temperature for 30 min using an Omniscript RT kit (Qiagen) with 10 μM Oligo-dT primer (Invitrogen). PCR reactions were performed in triplicates using Maxime PCR premix kit (iNtRON BIO, Kyungki-Do, Korea).
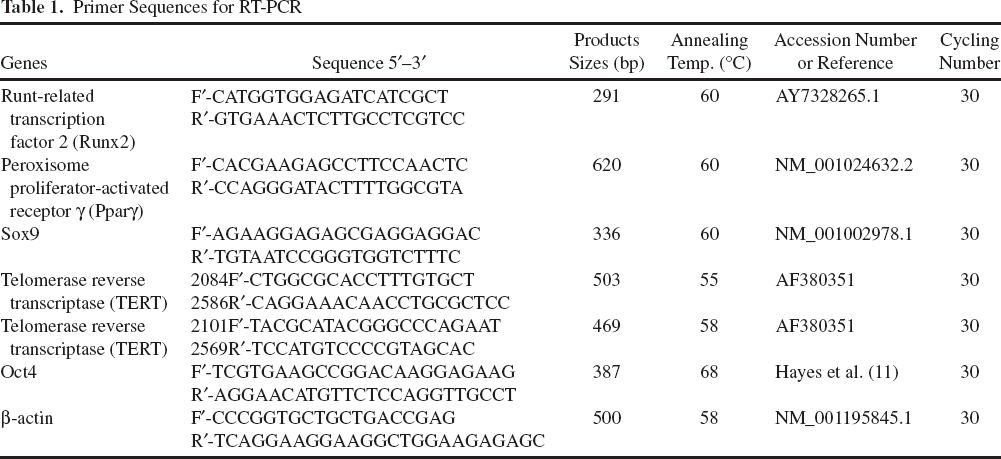
TERT gene expression was analyzed by nested PCR to examine the telomerase activity (31). cDNA was synthesized from 1 μg total RNA, and PCR was performed using canine TERT-specific primers. This analysis was performed in five replications. Detailed information about each specific gene and PCR conditions are presented in Table 1.
Canine testis tissues were used such as positive control for the analysis of Oct4 and TERT. TERT expression levels determined using semiquantitative RT-PCR were normalized with β-actin and presented as a fold induction as described previously (22).
Primer Sequences for RT-PCR
Statistical Analysis
The statistical significance among proportional data of three types of cells was analyzed using one-way analysis of variance (ANOVA) using SPSS 12.0 (SPSS, Inc., Chicago, IL, USA) followed by Tukey's multiple comparisons test. Values were expressed as means±standard deviation (SD). Differences were considered to be significant when p < 0.05.
Results
Alkaline Phosphatase (AP) Activity
cMSCs were successfully isolated from bone marrow, adipose tissue, and dermal skin. All three kinds of cMSCs attached to the tissue culture plastic and displayed a fibroblast-like morphology. The expression of AP activity was analyzed in all cMSCs in triplicates, and the results are presented micrographically in Figure 1A. cMSCs from different tissue origins were positive for AP activity.
Expression of Cell Surface Markers and Stem Cell Transcription Factors
cMSCs were analyzed for the expression of selected cell surface markers specific to MSCs and stem cell transcription factors by immunofluorescence staining in triplicates (Fig. 1B and C). Expression of CD45 was negative in cBM-MSCs and cDS-MSCs, whereas it was slightly expressed in cA-MSCs. In the case of CD90 and CD105, expressions were observed in all cMSCs and did not vary among the origins. Furthermore, proteins of Oct3/4, Nanog, and Sox2 were expressed at nearly identical levels in all cMSCs. However, cBM-MSCs had significantly (p < 0.05) lower expression levels of Oct3/4 by flow cytometry than those of cA-MSCs and cDS-MSCs (9.0±1.0 vs. 18.5±3.5 and 19±2%, respectively, triplicates) (Fig. 1Da). In addition, the expression of Oct4 at mRNA level was observed only in cA-MSCs (Fig. 1Db). As a positive control, canine testis tissue showed a stronger expression of Oct4.
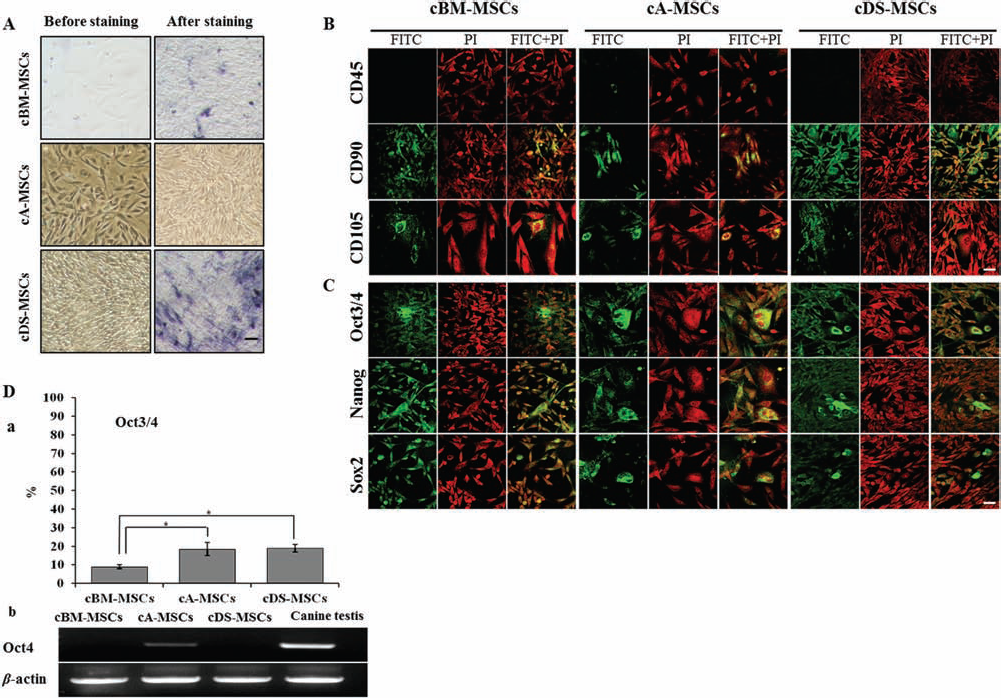
Expression of alkaline phosphatase (AP) activity, surface markers, and transcription factors in canine mesenchymal stem cells (cMSCs). (A) AP activity of cMSCs, before and after staining. Purple brown displayed the positive reaction of AP activity. (B) Expression of specific CD markers, cluster of differentiation 45– (CD45–), CD90+, and CD105+ and (C) transcription factors, octamer-binding transcription factor 3/4 (Oct3/4), Nanog, and sex-determining region Y box 2 (Sox2) by immunofluorescence staining. Red (PI) indicates the nucleus, and green (FITC) and yellow (PI + FITC) indicate positivity of reaction to CD markers and transcription factors. All samples were observed under a confocal microscope. Scale bar: 100 μm (A, B, C). (D) Expression of Oct3/4 antigen and Oct4 mRNA. (Da) Flow cytometer analysis showing the percentage of cells with Oct3/4 expression. Each sample was counted with 5,000 cells (triplicates). *p < 0.05. (Db) Expression of Oct4 mRNA by RT-PCR. β-Actin was used as an internal control. Canine testis was used as a positive control. cBM, bone marrow; cA, adipose; cDS, dermal skin.
In Vitro Differentiation Potential
cMSCs were evaluated for osteogenic and adipogenic differentiation in triplicates. Exposure of all cell lines to osteogenic and adipogenic induction medium for 3 weeks resulted in the deposition of calcified extracellular matrix, as evidenced by Alizarin red S staining, and the accumulation of fat globules, as indicated by Oil red O staining, respectively (Fig. 2A). However, the degree of differentiation among the three kinds of cMSCs was different. Especially, cA-MSCs showed an increased mineralization of calcium crystals and the formation of a large number of intracytoplasmic lipid droplets when compared to cBM-MSCs and cDS-MSCs.
cMSCs were induced into cartilage tissue by both pellet culture and micromass culture methods in triplicates (Fig. 2B). In the pellet culture, cBM-MSCs and cA-MSCs were successfully aggregated into spheroid-like structures, but cA-MSCs displayed rough and irregular spheroids compared to surface cBM-MSCs. cDS-MSCs failed to form any spheroids by aggregation of cells and continued to exist as single cells. In micromass culture, the spheroids induced from cBM-MSCs displayed a little smaller size and smooth surface than others. The spheroids induced from cA-MSCs displayed bigger sizes than from cBM-MSCs by fusion of more than two aggregates. The spheroids induced from cDS-MSCs displayed rough and irregular surface, and the sizes were varied. Based on the above results, further experiments were performed by pellet culture. Cartilage tissues induced from all cMSCs were positive for histochemical staining of Alcian blue. Except for cDS-MSCs, the expression of Alcian blue at the surface of the cartilage tissues from cBM-MSCs and cA-MSCs was prominent. Furthermore, aggrecan expression was also confirmed in the induced cartilage tissues. Expression of aggrecan in the cartilage tissue from cBM-MSCs was largely uniform, but it was partial in cA-MSC- and cDS-MSC-derived tissues and more particularly in cDS-MSCs.
Expression of specific markers related to osteogenesis, adipogenesis, and chondrogenesis was analyzed in undifferentiated cMSCs at passages 3 and 6 by RT-PCR in triplicates (Fig. 2C). Runx2, a well-known regulator of osteogenesis, was more strongly expressed at passage 6 than at passage 3, and at both passages a lower expression was observed in cA-MSCs than in cBM-MSCs and cDS-MSCs. Pparg, an adipocyte marker, had higher expression in all cMSCs at passage 3 but was not detectable in cBM-MSCs and cA-MSCs at passage 6. However, cDS-MSCs maintained its expression at passage 6. Sox9, a distinct marker of chondrocytes, was expressed at similar levels in all cell lines at both passages.
Expression levels of Runx2, Pparg, and Sox9 were evaluated in all cell lines at passage 3 during the osteogenic, adipogenic, and chondrogenic induction at different time points by RT-PCR (Fig. 2D). The mRNA of Runx2 was found in all cMSCs during osteogenic differentiation. Its expression level was increased in cA-MSCs following osteogenic induction, as it was barely detectable in undifferentiated cells at passage 3. Among the three kinds of cMSCs, the expression of Runx2 in cDS-MSCs was slightly higher. Furthermore, the expression pattern of Runx2 in all cMSCs following adipogenic induction was similar to that of osteogenic differentiation. However, its expression was reduced during chondrogenic induction. During osteogenic induction, the expression of Pparγ was evident in cBM-MSCs and cDS-MSCs but was inhibited in cA-MSCs. Following adipogenic induction, the transcript of Pparγ increased in cBM-MSCs at 2 weeks, and in cA-MSCs, it increased gradually as time progressed. The expression of Pparγ during chondrogenic induction of cBM-MSCs and cA-MSCs was increased with culture duration. The expression of Sox9 was not affected in all cMSCs during osteogenic and adipogenic induction but increased during chondrogenic induction of cBM-MSCs and cA-MSCs. cDS-MSCs had a nearly identical expression for all genes at all of the time points analyzed. β-Actin was used as an internal control, and its expression levels did not vary in all cMSCs at different time points of evaluation.

In vitro differentiation potential of cMSCs. (A) cMSCs were induced for osteogenic and adipogenic differentiation for 3 weeks. Deposition of mineralized matrix for osteocytes and accumulation of lipid droplets for adipocytes were indicated by Alizarin red and Oil red O staining, respectively (scale bar: 100 μm). (B) In vitro chondrogenesis of cMSCs by pellet culture and micromass culture for 3 weeks. Induced cartilage tissues with a thickness of 10 μm were stained by Alcian blue solution (scale bar: 500 μm) or aggrecan (cartilage-specific proteoglycan core protein, red) (scale bar: 200 μm). DAPI (blue) was used as a counterstain for aggrecan. Violet fluorescence showed the merged image of red and blue fluorescence. (C) Expression of lineage-specific marker genes in undifferentiated cMSCs at passages 3 and 6 and (D) differentiated cMSCs at 1, 2, and 3 weeks by RT-PCR. Expressions of runt-related transcription factor 2 (Runx2), peroxisome proliferator-activated receptor g (Pparg), and Sox9 were analyzed as markers of osteogenesis, adipogenesis, and chondrogenesis, respectively. β-Actin was used as a housekeeping gene.
In Vivo Ectopic Bone Formation
As represented in Figure 3, analysis of in vivo ectopic bone formation was performed by radiographic and histological analyses. Results of radiographic analysis using X-ray showed that both DBM/cA-MSCs and DBM/cDS-MSCs had more calcification than the other groups at 1 and 2 months posttransplantation, respectively, and as time progressed, the intensity of calcification was also increased (Fig. 3Aa,b and Ba,b). DBM/DPBS and DBM/cBM-MSCs were not observed with any evidence for clear calcification.
Recovered transplants were compared for their sizes (Fig. 3Ac and Bc). Transplant sizes were not different at 1 month posttransplantation, but the transplants of DBM/cDS-MSCs were larger than the others at 2 months posttransplantation.
Calcific deposition by Alizarin red S staining (Fig. 3C) was analyzed in recovered transplants. As time progressed, transplants showed accelerated bone formation by calcific deposition of tissue. DBM/cMSCs had an accelerated calcific deposition when compared with DBM/DPBS. Calcific deposition was the highest in cDS-MSCs among the three kinds of cMSCs, followed by
cA-MSCs both at 1 and 2 months posttransplantation. These observations corresponded with radiographic results (Fig. 3Ab and Bb).
Following H&E staining, all tissues exhibited an increased osteoblast-like cell (OB) layer and neovascularization (NV) as the time progressed, and these features were prominent especially in DBM/cA-MSCs and DBM/cDS-MSCs (Fig. 3D). DBM/cMSCs were observed with effective bone formation ability when compared to DBM/DPBS control.
At 2 months posttransplantation, the distribution of cMSCs labeled with PKH26 red fluorescence was investigated, and the results are depicted in Figure 3E. DBM/cMSCs showed a large number of PKH26-positive cells, whereas they were absent in DBM/DPBS. Furthermore, most of the transplanted PKH26-positive cells were found around the DBM surface. Among all cMSCs, cDS-MSCs had a lot of red fluorescence spots, followed by cA-MSCs. However, relatively few were found in cBM-MSCs.

In vivo ectopic bone formation of cMSCs with DBM was assessed by X- ray examination and histological analysis. BALB/c-nu mice were taken for X-ray analysis at 1 or 2 months posttransplantation (A and B, respectively), and the transplants were recovered as shown in Ac and Bc. Arrows indicate the calcification of scaffolds. Tissue sections of transplants at 1 or 2 months posttransplantation were stained with Alizarin red S solution (C) or H&E (D). OB, DBM, and NV represented osteoblast-like cell, demin-eralized bone matrix, and neovascularization, respectively. (E) Images of tissue sections showing the distribution of PKH26-labeled cMSCs. Red and blue fluorescence indicated PKH26-labeled membrane of cMSCs and nuclei counterstained with DAPI, respectively. Scale bars: 200 μm (C–E).
Ploidy Analysis
Ploidy of cMSCs was analyzed at passage 3 in triplicate and classified as haploid (n = 39), diploid (2n = 78), and tetraploid (4n = 156) (Fig. 4A). The proportional data of all cMSCs at different ploidy status are presented in Figure 4Ab. Haploid was absent in all cell lines. The diploid rate was relatively high with over 90% in all cMSCs, but cA-MSCs (91.0±4.1) had significantly (p < 0.05) lower rates when compared to cBM-MSCs and cDS-MSCs (99.3±1.2 and 99.2±1.3, respectively). In contrast, tetraploid rate was significantly (p < 0.05) higher in cA-MSCs (9.0±4.1) than in cBM-MSCs and cDS-MSCs (0.7±1.2 and 0.8±1.3, respectively).
Cell Cycle Analysis
Cell cycle status of cMSCs was analyzed by a flow cytometry (Fig. 4B) in triplicates. In the case of G0/G1 phase, cDS-MSCs had a significantly (p < 0.05) lower population when compared to those of cBM-MSCs and cA-MSCs (33.3±1.3 vs. 52.2±1.2 and 51.4±0.4, respectively). Significant (p < 0.05) differences were exhibited in cMSCs at S phase (cBM-MSCs vs. cA-MSCs vs. cDS-MSCs, 40.5±2.7 vs. 48.5±0.6 vs. 59.2±2.8, respectively). In the case of G2/M phase, cA-MSCs had a significantly (p < 0.05) lower population than those of cBM-MSCs and cDS-MSCs (0.1±0.2 vs. 7.3±1.6 and 7.5±1.6, respectively).
Telomere Length and Telomerase Activity
cMSCs at passage 3 were analyzed for telomere length (triplicates) and telomerase activity (five replicates), and the results are presented in Figure 4C and D. Canine testis was used as a positive control. Absolute telomere lengths recorded in cBM-MSCs, cA-MSCs, and cDS-MSCs were 18.7±1.2, 17.7±0.6, and 18.7±0.6, respectively, and it was 20.3±4.2 in canine testis (Fig. 4Cb). However, the expression of TERT as telomerase activity showed differences among the three kinds of cMSCs (Fig. 4D). Expression of TERT in cBM-MSCs was significantly (p < 0.05) higher than in cA-MSCs and cDS-MSCs, but it was similar with canine testis tissue (Fig. 4Da and Db).

Analysis of ploidy, cell cycle, telomere length, and telomerase reverse transcriptase (TERT) expression in cMSCs. (A) Analysis of ploidy. (Aa) Representative images of cA-MSCs chromosome spreads indicating diploid and tetraploid status. Photographs are taken at magnification of 1,000×. (Ab) Percentages of haploid, diploid, and tetraploid status. *p < 0.05 in triplicates. (B) Analysis of cell cycle using flow cytometry. Each sample was counted with 10,000 cells at a time in triplicates. *p < 0.05, **p < 0.01. (C and D) Analysis of telomere length and telomerase activity (TERT). (Ca) The range of telomere restriction fragment length by Southern blot using telomere length assay. Positive control (PC) was provided by the Telomere Length Assay Kit, and canine testis was used as a positive control for canine tissues. (Cb) Mean band densities of telomere length analyzed by densitometry. p > 0.05 in triplicates. (Da) Relative expression of TERT mRNA in cMSCs by semiquantitative RT-PCR based on β-actin expression. *p < 0.05, in five replicates. (Db) Detection of TERT mRNA in cMSCs by nested RT-PCR. β-actin was used as a housekeeping gene.
Discussion
The present study compared the pluripotency-related marker expression, proliferation, lineage differentiation, in vivo bone formation, ploidy, and telomeric properties in cMSCs derived from bone marrow, fat, and dermal skin tissues of a single donor by excluding the individual differences. The results revealed that the cells possessed the characteristics of MSCs but slightly differed in stem cell properties based on their tissue origins.
Tissue-specific stem cells derived from adult were known to possess a lesser AP activity, which is considered as a marker for undifferentiated embryonic stem cells (11), and our results are in accordance with these observations. Furthermore, a majority of tissue-specific stem cells have MSC-specific marker profile, such as CD45-, CD90+, and CD105+ (5,7), and the observations in this study supported the results of earlier reports. Therefore, these findings confirmed the successful isolation and expansion of all cMSCs.
The transcription factors Oct3/4, Nanog, and Sox2 have been known as critical regulators of self-renewal and differentiation process of pluripotent stem cells. Especially, the importance of Oct3/4 in generating and maintaining the pluripotency of cells has necessitated to be considered as a real marker of stemness (16), but the existence or nonexistence of these transcription factors is still not clear in adult stem cells like MSCs (22). In our study, immunofluorescence staining of all cMSCs showed the presence of Oct3/4, Nanog, and Sox2 markers and did not exhibit any differences in their expression levels. These results suggested the presence of a rare type of stem cells representing the status of both pluripotency and multipotency. Furthermore, the expression of Oct3/4 by flow cytometry revealed the differences among cMSCs with the levels varying between 9% and 19%, whereas the mRNA of Oct4 was detected only in cA-MSCs. Oct4 expression has been reported earlier in cA-MSCs (13), even though its expression was dependent on age and individual differences (10). The current study used cMSCs of adult tissues from a single donor and showed that cA-MSCs with higher levels of Oct3/4 might consist of a large number of primitive cells than those of cBM-MSCs and cDS-MSCs. Moreover, the presence of Oct4-positive cells in the lineage-restricted adult tissues indicates their possible role in the regeneration of damaged cells or tissue.
In the present study, all cMSCs were verified to possess osteogenic, adipogenic, and chondrogenic potential. Lineage-specific markers were analyzed in undifferentiated MSCs at passages 3 and 6. We found the differences in the expression of genes between the passages in all cMSCs, and these variations might have altered the plasticity of cMSCs under in vitro culture. Our results are in accordance with a previous report, in which adult human BM-MSCs gradually lost their multilineage differentiation potential during in vitro expansion (3). However, several studies have demonstrated the higher osteogenic potential in BM-MSCs compared to other cell sources (7,12). Furthermore, a recent study showed the robust osteogenic potential of cA-MSCs and cBM-MSCs, but cA-MSCs indicated more mineral deposition (8). Supporting these results, cA-MSCs in our study revealed increased differentiation potential into osteocytes and adipocytes based on intense cytochemical staining and enhanced mRNA expression of lineage-specific genes. However, cA-MSCs showed slightly lower chondrogenic potential than cBM-MSCs as reported previously (12). In addition, cBM-MSCs and cDS-MSCs did not exhibit any drastic changes in the levels of lineage-specific mRNA after induction. Although exact reasons for the above differences are unclear, it is supposed that, based on the tissue source, cMSCs are composed of different types of precursor cells rather than representing an identical cell population and may have distinct mechanisms regulating their lineage differentiation abilities (30). Furthermore, consistent expression of Runx2, Pparγ, and Sox9 at similar levels in uninduced and differentiated cBM-MSCs and cDS-MSCs suggests a lack of responsiveness to the stimulation of specific induction media.
In vivo ectopic bone formation assay was performed to compare the osteogenic capacity of cMSCs. Our findings revealed that the presence of cMSCs accelerated the new bone formation in vivo, which in turn corresponded with previous reports suggesting the role of growth factors released from MSCs in improving angiogenesis and osteoinductivity in a composite bone graft (27). Among all cMSCs, cDS-MSCs and cA-MSCs displayed the higher ability for ectopic bone formation in vivo. The reason presumed to be a higher in vitro proliferation capacity in cDS-MSCs, as observed in a previous study (1), and enhanced in vitro osteogenic differentiation, as reflected in cA-MSCs. This was further supported by the fact that PKH26-labeled cells were found in a larger number in cDS-MSCs and cA-MSCs and located mainly around the bone surface as osteoblast-like cells. Therefore, it was presumed that transplanted cMSCs induced into osteoblasts through the support of neovascularization under in vivo environment and accelerated the bone formation at the transplanted sites.
Chromosomal stability is a critical factor in determining the safety and quality of stem cells. Reports have shown the chromosomal instability and the spontaneous transformation of MSCs derived from different origins under long-term in vitro culture (26). Karyotypical analysis of all cMSCs in this study indicated that the cells were diploid and contained no noticeable chromosomal abnormalities, although cA-MSCs showed cytogenetic abnormalities with higher rates of tetraploid. In contrast, Vieira et al. (29) found the maintenance of diploid karyotype by cA-MSCs both at early and late passages. Slight differences in these results may perhaps be due to diverse culture conditions employed, as the ploidy status in cells has been known to be affected by a suboptimal ex vivo culture conditions (17).
Analyses of cell cycle, telomere length, and telomere activity have been considered as crucial indicators of stem cell proliferation capacity and senescence (20,22). The classic feature of senescence in MSCs is the growth arrest at the G1 phase of cell cycle (17). However, the present study found relatively lower rates (33–52%) of cells at G1 phase in all cMSCs compared with previous reports showing ~69% and ~74% in canine cycling fibroblasts (23) and cycling dermal fibroblasts (15), respectively. We found that cMSCs maintained relatively longer telomere lengths (~18–19 kbp) regardless of varied tissue sources. Telomere lengths vary from ~3 to 23 kbp in dogs (21), and it is opined that telomere length can be affected by breed, age, and tissue types in canine (19). However, a direct comparison of telomere lengths between tissue-specific cMSCs has not been reported earlier. In this view, our results revealed the similarities in telomere lengths of cMSCs that originated from the same donor.
Telomerase prevents the gradual loss of telomeres by de novo synthesis of telomeric DNA and extends the life span of various cell types (20). The number of studies examining the telomerase in dogs is small, and moreover, the results about its presence have been contradictory up to this date (20,21). In this study, the expression of TERT as a telomerase activity was examined in cMSCs. cBM-MSCs displayed the highest TERT expression compared to cA-MSCs and cDS-MSCs, but both cell cycle and differentiation capacity were relatively low or similar when compared with other cells. The expression of TERT in cMSCs supports its activation in adult stem cells, but a very less correlation was found against proliferative ability and in vitro differentiation potential into mesodermal lineages in a relatively short-term culture.
In conclusion, cMSCs that originated from mesodermal tissues of a single donor possessed MSC features, such as morphology, AP activity, expression of cell surface antigens, and differentiation ability, but revealed tissue origin-based differences on the expression of transcription factors, proliferation potency, in vivo bone formation capacity, chromosomal stability, and telomerase activity. Taking into consideration the merits and demerits of the three tissue sources of cMSCs along with their differences in stem cell capacity, selection of tissue-specific MSCs for cell therapy should be dependent on the purpose of application. Furthermore, cMSCs from a single canine donor showed no differences in telomere lengths but exhibited varied telomerase activity. Therefore, further studies are needed to expand our understanding on the exact role of telomeres and TERT expression in cMSCs so as to facilitate the dog as a useful preclinical model for MSC applications.
Footnotes
Acknowledgments
This work was supported by a grant from the Next-Generation BioGreen 21 Program (PJ009021 and PJ009038-2), Rural Development Administration, Republic of Korea. Sun-A Ock was responsible for the conception and design, collection and/or assembly of data, data analysis and interpretation, and manuscript writing. Geun-ho Maeng, Yeon-Mi Lee, and Tae-Ho Kim were responsible for the provision of study material or patients and the collection and/or assembly of data. B. Mohana Kumar analyzed and interpreted the data and wrote the manuscript. Sung-Lim Lee provided administrative support. Gyu-Jin Rho provided financial and administrative support, analyzed and interpreted the data, and gave the final approval of the manuscript. The authors declare no conflict of interest.