
Abstract
Stem cell transplantation therapy using mesenchymal stem cells (MSCs) is considered a useful strategy. Although MSCs are commonly isolated by exploiting their plastic adherence, several studies have suggested that there are other populations of stem and/or osteoprogenitor cells that are removed from primary culture during media replacement. Therefore, we developed a three-dimensional (3D) culture system in which adherent and nonadherent stem cells are selected and expanded. Here, we described the characterization of 3D culture-derived cell populations in vitro and the capacity of these cells to differentiate into bone and/or cartilage tissue when placed inside of demineralized bone matrix (DBM) cylinders, implanted subcutaneously into the backs of rat for 2, 4, and 8 weeks. Our results demonstrates that 3D culture cells were a heterogeneous population of uncommitted cells that express pluripotent-, hematopoietic-, mesenchymal-, and endothelial-specific markers in vitro and can undergo osteogenic differentiation in vivo.
Keywords
Introduction
In recent years, stem cells have gained prominence as invaluable tools for research and as a promising resource for cell replacement therapies. The bone marrow is a remarkable reservoir of adult stem cells. Beside hematopoietic stem cells (HSCs) and mesenchymal stem cells (MSCs), other populations of stem cells have been isolated from that tissue with different methods, such as the side population (SP) cells, multipotent progenitor cells (MAPCs), multipotent stem cells and pre-MSC, MIAMI cells (marrow-isolated adult multilineage inducible cells), VSEL cells (very small embryonic like stem cells), or endothelial progenitor cells (EPCs) (2,21,25,29,32).
MSCs are multipotent cells that persist in adult life in some tissue types, such as bone marrow stroma, fat, skeletal muscle, synovium, etc., without losing their capacity to proliferate and differentiate (23,31). Phenotypically, multiple studies have identified several markers that can be used to identify MSCs; however, even if isolated by density gradient fractionation, they remain a heterogeneous mixture of cells with varying phenotype. Therefore, the International Society for Cellular Therapy (ISCT) established that MSCs must express cluster of differentiation 73 (CD73), CD90, and CD105 and lack expression of CD14 or CD11b, CD34, CD45, CD79a, or CD19 and human leukocyte antigen (HLA)-DR surface molecules (22).
MSCs are commonly isolated by exploiting their plastic adherence (39) and are expanded in vitro to obtain sufficient cell numbers for a range of tissue engineering applications, including bone and cartilage regeneration (6,15,44). Although there is no doubt that isolation of MSCs on the basis of plastic adherence clearly leads to the identification of a population of cells with multilineage potential in vitro, over the past several decades there has been a growing body of work suggesting that there are other populations of nonadherent cells in bone marrow that also have characteristics of stem and/or osteoprogenitor cells (9,24). Włodarski et al. demonstrated that nonadherent cells, removed from primary bone marrow culture during media replacement, were able to produce bone in vivo (54).
In the last decade, our laboratory have successfully developed a three-dimensional (3D) collagen gel culture system supplemented with some growth factors, in which adherent and non-adherent bone marrow stem cells are selected and expanded in order to obtain cells capable to differentiate into bone and cartilage (3,4,5,10). Thus, this report describes a further attempt to characterize this bone marrow-derived heterogeneous cell population by in vitro expression of undifferentiated, mesenchymal, hematopoietic, and endothelial markers and bone and cartilage formation when they are ectopically implanted in vivo. This heterogeneity can be advantageous for use in skeletal tissue engineering.
Materials and Methods
Isolation of Primary MSCs and 3D Culture
Primary cultures of MSCs were established using bone marrow suspensions from human and rat origin. Human MSCs were used for flow cytometry and semiquantitative reverse transcription-polymerase chain reaction (RT-PCR) analysis, and rat MSCs for in vivo experiments.
Human bone marrow cells were collected by aspiration from patients undergoing hip replacement surgery after informed consent and according to procedures approved by the local ethics committee. The MSC-enriched fraction was separated on Percoll (Sigma) gradient sedimentation at 20,000 g for 15 min and suspended in Dulbecco's modified Eagle's medium (DMEM, Sigma).
Rat bone marrow cells were extracted from femurs and tibiae of syngeneic 8-week-old male Fisher 344 rats under animal care procedures, conducted in accordance with the guidelines set by the European Community Council Directives (86/609/EEC) and approved by the local ethical committee. The epiphysis was removed, and the medullar canal was washed with DMEM using a syringe. The medium containing the extracted cells was directed into a Falcon tube, and the cells were suspended, homogenized, and centrifuged at 400 g for 10 min.
Human and rat cells were cultured in a 3D environment using a modification of a previously described method (3). Briefly, a collagen substrate for cell culture was prepared using a solution containing 0.85 mg/ml rat tail tendon type I collagen (BD), 1 M NaOH, 10 DMEM-F12, 100 U/ml penicillin, 100 μg/ml streptomycin, and 1.25 μg/ml fungizone (Sigma) in MilliQ water at pH 7.4. Forty-eight-well plates (Nunc) were coated with 150 μl of this solution and placed at 37°C for 30 min in order for it to solidify into a thin collagen gel matrix. After that, all of the cells were resuspended in DMEM-F12 and mixed with the collagen solution plus 0.5% fetal bovine serum (FBS), in the absence (control cultures) or presence of 1 ng/ml recombinant human transforming growth factor-β1 (rhTGF-β1, R&D Systems) at a density of 2.5 × 10⁵ cells/250 μl collagen/ well in 48-well plates. The culture plates were left 30 min at 37°C to allow the collagen to gel. Then, 250 μl/well of culture medium that consisted of DMEM supplemented with 0.5% or 10% FBS, 2.5 mM l-glutamine, and the same amount of penicillin–streptomycin and fungizone as described above were added on top of the gel, in the presence or absence (control cultures) of rhTGF-β1 (1 ng/ml). Cells were incubated in culture medium containing 0.5% FBS for 10 days (selection period) and expanded in medium with 10% FBS for 4 days (amplification period). At the end of the culture, cells were incubated for 2 days in medium (not containing rhTGF-β1) supplemented with 108 M dexametasone (Dex) and 2 mM β-glycerophosphate (β-GP) (Sigma) to help with the osteogenic differentiation. Cultures were fed every third day with fresh medium with or without rhTGF-β1 as appropriate and maintained at 37°C in a humidified atmosphere containing 95% air and 5% CO2.
Adherent culture (ADH) was used like a control. MSC fraction was plated at a concentration of 107 cells/75-cm2 tissue culture flask and maintained in DMEM containing 10% FBS, 2.5 mM l-glutamine, 100 U/ml penicillin, 100 μg/ml streptomycin, and 1.25 μg/ml fungizone. The culture medium was changed two times per week, and the cells were selected by their capacity to attach to the dish surface, discarding the floating cells in the first medium change at 72 h. When culture flasks became near-confluent, cells were detached with 0.25% trypsin containing 1 mmol/L EDTA and subsequently replated at 5 103 cells/cm2 for continued passaging.
Flow Cytometry
In order to analyze the expression of surface markers characteristic for mesenchymal, endothelial, and hematopoietic cells, fluorescence-activated cell sorting (FACS) was performed at days 10 and 16, using specific fluorochrome-conjugated monoclonal antibodies. Human cells were washed twice in FACS buffer consisting of 10 mM hepes (Gibco), 100 U/ml penicillin, 100 μg/ml streptomycin, and 2 mg/ml bovine serum albumin (Sigma) in Leibovitz's L-15 medium (Gibco). After the washing step, cells aliquots (1 × 10⁶ cells) were incubated in FACS buffer containing monoclonal antibodies against CD13, CD29, CD44, CD49a, CD49b, CD73, CD106, CD146, HLA-I, HLA-DR, and kinase insert domain receptor [KDR] (BD Pharmigen); CD34, CD45, CD133, and CD271 (Miltenyi Biotech); CD90, CD105, and Stro-1 (R&D Systems); and CD166 (AbD Serotec) or an appropriate isotype control antibody (Sigma). After 30 min in the dark on ice, cells were washed again in FACS buffer before flow cytometry analysis. Five hundred thousand events per sample were analyzed on a MoFlo® SP1338 (DakoCytomation, Denmark) using Summit software. Cells were gated on forward and side scatter to exclude debris and cell aggregates, and dead cells were excluded by 7-aminoactinomycin D (7-AAD, BD Pharmigen) staining.
FACS was used to study the cell cycle as well. Cells (1 × 10⁶) in 1 ml of phosphate-buffered saline (PBS) were fixed for 30 min at 4°C with 2 ml of methanol. After that, the cell suspension was washed twice with PBS and incubated for up to 30 min at 4°C in the dark with 500 μl of staining solution containing propidium iodide (0.1 mg/ml) (Calbiochem), Triton® X-100 (0.1%), and EDTA (3.7 mg/ml) (Sigma) in PBS. Samples were analyzed as described previously.
RT-PCR Analysis
The expression of human octamer binding transcription factor 4 (Oct-4), Nanog, and sex-determining region Y box 2 (Sox-2) was semiquantitatively evaluated for 3D culture at days 10 and 16 by RT-PCR. mRNA extracted from ADH cells was analyzed as a control. Total RNA was isolated using RNeasy total RNA kit (Qiagen), and its quantity and purity were estimated by Nanodrop (Thermo Scientific D-1000). Only samples with an A260/A280 nm ratio of 2.0 were accepted. Two hundred nanograms of the total RNA sample was used as a template for first-strand cDNA synthesis by moloney murine leukemia virus (M-MLV) reverse transcriptase (Promega, Madison, USA). cDNA was amplified by PCR with the following oligonucleotide primer sets: for Nanog, 5′-GCTTGCCTTGCTTTGAAGCA-3′ and 5′-TTCTTGACTGGGACCTTGTC-3′; for Oct4, 5′-GAGCAAAACCCGGAGGAGT-3′ and 5′-TTCTCTTTCGGGCCTGCAC-3′; for Sox2, 5′-GCCCCCAGCAGACTTCACA-3′ and 5′-CTC-CTCTTTTGCACCCCTCCCATTT-3′; for β-actin, 5′-CCACACTGTGCCCATCTACG-3′ and 5′-GTGGTGGTGAAGCTGTAGCC-3′. The expression of β-actin was used to normalize gene expression levels. All primer sequences were determined through established GenBank sequences. PCR cycling conditions consisted of initial denaturation at 95°C for 2 min; 25 cycles of 94°C for 30 s (denaturation), 55°C for 30 s (annealing), and 72°C for 30 s (extension); and final extension at 72°C for 7 min. These reactions were carried out in 2720 Thermocycler (Applied Biosystems). PCR products from each sample were analyzed by electrophoresis on 2% agarose gel and visualized by staining with ethidium bromide using ChemiDoc™ XRS (Bio-Rad Laboratories).
In Vivo Implantation and Histological Study
One million rat cells were inoculated into demineralized bone matrix (DBM), chambers made of cylinders from bone diaphysis with a capacity of 40 μl in volume (37), and then implanted subdermally into syngeneic 10-week-old Fisher 344 rats under anesthesia. Chambers, harvested 2, 4, and 8 weeks after implantation, were processed for histology, fixed in Bouin or 4% paraformaldehyde, dehydrated in ethanol, embedded in paraffin, and sectioned at 8 μm thick, and the sections were stained with picrosirius-hematoxyline (PSH), a technique that shows specificity for collagen I, Alcian blue (AB), that reveals glycosaminaglycans from the cartilage matrix, toluidine blue (TB) for cartilage matrix, Goldner's trichromic that reveals mineralized collagen I fibers, and immunohistochemically for anti-collagen I and II. In detail, deparaffinized sections were rehydrated, and then endogenous peroxidase was blocked with 3% hydrogen peroxide. For type II collagen detection, sections were digested with papain at 0.5 mg/ml in phosphate buffer (pH 4.7) for 15 min at 37°C. Afterwards, they were incubated with rabbit polyclonal anti-collagen type I or II antibodies (Calbiochem-Novabiochem) at a 1:60 or 1:200 dilution, respectively, in buffer consisting of Tris–PBS (pH 7.8), 0.5% Triton X-100, 1% bovine serum albumin (BSA), and 5% sheep serum (Sigma) overnight at 4°C, followed by incubation with goat anti-rabbit IgG (Sigma) diluted 1:50 for 1 h, and peroxidase-anti-peroxidase (PAP)-rabbit complex (Dako) diluted 1:200 for 1 h. All incubations were carried out in a humid chamber, and sections were washed three times for 5 min in Tris–PBS between each stage. The PAP complex was visualized by 3,3′-diaminobenzidine tetrahydrochloride (DAB). After rinsing in distilled water, sections were dehydrated in ascending ethanol solutions, cleared in xylene, and mounted. Control sections were incubated without the primary antibody.
Statistical Analysis
Means and standard deviations were performed using Sigma Stat software (SPSS, Inc., Chicago, IL) with analysis of variance (ANOVA), followed of Dunn post hoc test, after the data passed normality and equal variance tests. Comparisons to determine significance between 3D and ADH culture were done with the Student's t test. Results were considered significantly different at p < 0.05.
Results
Characterization of Human Bone Marrow MSCs From 3D and ADH Cultures
FACS Studies
As we previously reported, the 3D culture method yielded rounded cells significantly smaller when compared to ADH cells (Table 1) (p < 0.05), which were uniformly distributed and embedded in collagen matrix. There was a sharp decrease due to the selection period for the first 10 days (Fig. 1). Once normal serum conditions were reestablished, the selected cells proliferated albeit moderately. Cell cycle studies revealed that only a small fraction of cells are actively engaged in proliferation (approximately 17% at S + G2 + M), while the majority of these cells were standing at the G0/G1 phase (Fig. 2A). In contrast, a high proliferation rate had been shown by ADH cells as 72% at S + G2 + M phases (Fig. 2B).

Cell morphology in 3D collagen gel and ADH culture. (A, B) Phase contrast images of 3D cultures in the absence (round-shaped isolated cells) and presence of TGF-β1 (cell aggregates) at the end of the amplification period (day 14). (C) Phase contrast image of primary ADH culture. Scale bars: 200 μm. 3D, three-dimensional; ADH, adherent; TGF-β1, transforming growth factor-β1.
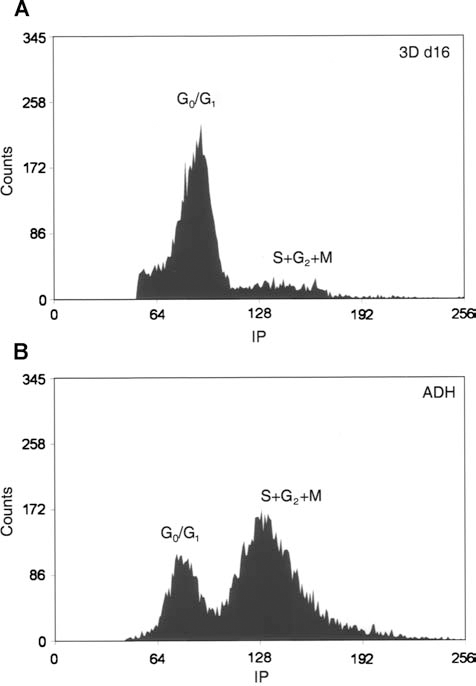
FACS analysis of cell cycling after propidium iodide staining. (A) 3D culture cells are standing at the G0/G1 phase (approximately 83%), (B) while ADH cells are actively in proliferation (approximately 72% at S + G2 + M). FACS, fluorescence-activated cell sorting; 3D, three-dimensional; ADH, adherent.
Cell Size and Granularity Analysis in 3D and ADH Culture Cells Using FS and SS Parameters

Values are expressed as the mean ± SEM (n = 13). 3D, three-dimensional; FS, forward scatter; SS, side scatter.
p < 0.05.
FACS of ADH culture showed the immunophenotype described for MSCs, where most of the cells expressed CD29, CD44, CD73, CD90, CD105, CD106, CD166, CD271, Stro-1, and HLA-I and were negative for CD34, CD45, and HLA-DR (Table 2). Nevertheless, the profiles of 3D culture revealed a heterogeneous cell population, where positive cells for hematopoietic (CD34, CD45, HLA-DR), mesenchymal (CD29, CD44, CD73, CD105, CD166, HLA-I, Stro-1), and endothelial markers (CD34, CD133, CD146, KDR) were found (Table 2 and Fig. 3). omparing 3D cultures at days 10 and 16, CD45+ and CD166+ populations decreased over time (19.2%, p < 0.05 and 37.5%, p < 0.001, respectively), while there was an increase in the expression of some mesenchymal cell markers such as CD29, CD73, and HLA-I (+4.0%, +2.1%, +9.3%, respectively), and in the CD13+ CD49b+ population (+5.4%, p < 0.001). In addition, the EPCs-like population (CD34+/CD133+/CD45) decreased significantly in favor of a mature endothelial phenotype (CD146+/KDR+, +18.7%, p < 0.001).

Immunophenotype profiles of 3D culture cells for hematopoietic, mesenchymal, and endothelial markers. Representative FACS analysis at days 10 (A) and 16 (B). 3D, three-dimensional.
Statistical Analysis of Flow Cytometry Results

Values represent percentage of positive cells and are expressed as the mean ± SEM (n = 8). 3D, three-dimensional; ND, no data.
p < 0.001
p < 0.05 versus 3D culture 10 days.
RT-PCR
Pluripotency of embryonic stem cells is controlled by defined transcription factors, such as Oct4, Nanog, and Sox2. We analyzed the expression of mRNA for these pluripotent specific markers by RT-PCR, and the signal was compared with ADH culture (Fig. 4). Oct4 and Nanog was detected in both 3D culture at days 10 and 16 but was absent in ADH cells. In addition, we evaluated the mRNA levels of other well-described pluripotent marker positively regulated by Oct4: Sox2, which was highly expressed in 3D culture cells in comparison to ADH cells.
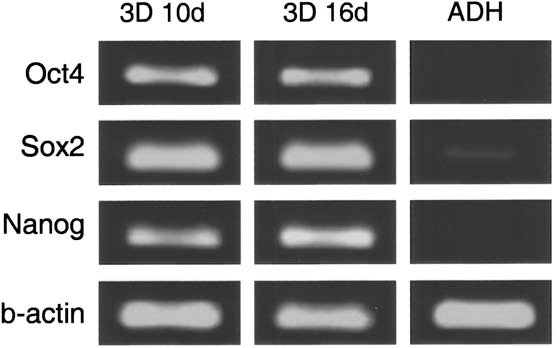
mRNA expression in 3D and ADH secondary cultures at 80% confluency by semiquantitative reverse transcription-polymerase chain reaction (RT-PCR). 3D cultured cells expressed Nanog, Sox2, and Oct4 while ADH cells did not. 3D, three-dimensional; Sox2, sex-determining region Y box 2; Oct4, octamer-binding transcription factor 4; ADH, adherent.
In Vivo Implantation and Histological Study
One million rat bone marrow cells from 3D or ADH cultures were implanted subcutaneously into DBM chambers. They were harvested after 2, 4, and 8 weeks. In addition and due to the limited cell number obtained in collagen gels, we found it interesting to study implants of both types of cells in order to discover a likely synergistic effect. So we also implanted DBM chambers inoculated with 3D and ADH cells in 1:1 ratio.
Histological analysis after 2 weeks revealed that chambers were principally filled with fibrous tissues. Bone did not appear in any instance. In the implants containing 3D culture cells, sections stained with PSH and Goldner's trichrome showed a fibrous tissue where there were frequent vascular elements (Fig. 5A and insert). Implants containing ADH cells showed dense fibrous tissue, but vascularization phenomena were less apparent; and chondrocyte-like cells located adjacent to the chamber wall were seen (Fig. 5B and insert). Chambers with both types of cells revealed dense tissue condensations with cartilaginous matrices, as demonstrated by type II collagen immunohistochemistry (Fig. 5C and insert).

Histological sections of DBM chambers with different types of cells after 2, 4, and 8 weeks of in vivo implantation. Different types of tissue can be observed, according to cell type implanted and time of implantation. Asterisks represent the walls of the chambers. (A and insert): 3D culture cells at 2 weeks. The chambers were principally filled with fibrous tissue and showed numerous small blood vessels (arrows). PSH (A) and Goldner's trichrome stain (insert). Scale bars: 500 μm (in A) and 200 μm (in insert). (B and insert) ADH culture cells at 2 weeks. Dense fibrous tissue and chondrocyte-like cells (arrows) located adjacent to the DBM chamber wall were observed. Vascularization phenomena were less apparent. PSH (B) and Goldner's trichrome stain (insert). Scale bars: 500 μm (in B) and 200 μm (in insert). (C and insert) 3D and ADH culture cells at 2 weeks. Tissular condensations with cartilaginous matrices were distinguished. PSH stain (C) and type II collagen immunohistochemistry (insert). Scale bars: 500 μm (in B) and 200 μm (in insert). (D) 3D culture cells at 4 weeks. Typical appearance of tissue formed by these cells: a well-organized trabecular matrix, lined with osteoblast-like cells (arrowheads), regularly scattered vessels and marrow spaces. Type I collagen immunohistochemistry. Scale bar: 500 μm. (E) ADH culture cells at 4 weeks. The chambers were occupied by abundant cartilaginous tissue with hypertrophic chondrocytes at the ends of the cartilage, and new bone formation (star) through endochondral ossification was identified. PSH stain. Scale bar: 500 μm. (F) 3D and ADH culture cells at 4 weeks. Both types of tissue were observed: large areas of cartilage with trabecular bone formed via an endochondral pathway (star), and new bone tissue whose origin seemed to be intramembranous. PSH stain. Scale bar: 1 mm. (G) 3D culture cells at 8 weeks. The chamber wall and the newly formed tissues were suffering an active remodeling process. (H) ADH culture cells at 8 weeks. The cartilage areas were totally resorbed and large numbers of fat cells appeared. Goldner's trichrome stain. Scale bar: 500 μm. (I) 3D and ADH culture cells at 8 weeks. Remnants of cartilage and active osteoblasts depositing new matrix were observed, indicating active osteogenesis. Goldner's trichrome stain. Scale bar: 500 μm. DBM, demineralized bone matrix; 3D, three-dimensional; PSH, picrosirius-hematoxyline; ADH, adherent.
Four weeks after implantation, chambers appeared full of dense clumps of tissue with various phenotypes, and bone formation was demonstrated in all conditions (Fig. 5D–F). Figure 5D shows examples of tissue formed by 3D culture cells where a well-organized trabecular matrix, immunoreactive for collagen I, lined with osteoblast-like cells, regularly scattered blood vessels and marrow spaces were observed. On the other hand, in implants containing ADH cells, abundant cartilaginous occupying large areas of the chambers were found. In these cases, a real process of endochondral ossification with hypertrophic chondrocytes at the ends of the cartilage areas and new trabecular bone were identified (Fig. 5E). Similar structures were normally found at this time in implants with 3D and ADH cells (Fig. 5F). Furthermore, it was also common to find large areas occupied by new trabecular bone, whose origin could be different, perhaps intramembranous because no remnants of cartilage matrix were found, even staining with AB or TB (data not shown).
Overall, a further maturation of the osseous tissue was observed at 8 weeks after implantation (Fig. 5G–I). In chambers with 3D culture-derived cells, it became very difficult to distinguish the boundaries between the chamber wall and the newly formed tissues, indicating an active remodeling process. Under these conditions, marrow cavities within bone trabeculae increased in size, being mainly occupied by adipocytes (Fig. 5G). In contrast, in implants containing ADH cells, we observed that cartilage areas were totally resorbed, and large numbers of fat cells appeared (Fig. 5H). At this time, osteoblasts were not seen on the edges of the trabeculae, indicating a final state of maturation, and certain areas of the chambers walls showed regression phenomena. However, some differences were observed following implantation of both types of cells (3D + ADH). In this case, remnants of cartilage and active osteoblasts depositing new matrix on the surface of a pre-existing bone were observed, indicating active osteogenesis after 8 weeks of implantation (Fig. 5I).
Discussion
Cell biologists have become increasingly aware of the limitations of tissue culture dishes and any other two-dimensional structures. Therefore, they developed culture systems that better represent the natural environment of cells in tissues and organs. Therefore, we successfully developed a 3D collagen gel culture system (3,4,5,10) that allows one to study the isolation, expansion, and growth factor responsiveness of marrow-derived cells and evaluate the capacity of these cells to undergo differentiation into bone and/or cartilage tissue when implanted in vivo.
Previous characterization of 3D culture cell populations using different approaches [DNA content, alkaline phosphatase (ALP) activity, osteocalcin (OC) expression, and calcium (Ca) accumulation] revealed marked differences when compared with those receiving treatment or not with rhTGF-β1. Treated cells were found to proliferate more rapidly than control ones, and they expressed higher levels of ALP activity as well as were able to induce Ca precipitation and to exhibit synthesis of OC during the last days of the cultures. Calcium and OC were both absent in untreated cells (10).
In this report we perform the surface markers profile of bone marrow-derived cells, isolated in the described 3D collagen gel culture system and exposed to rhTGF-β1, using FACS. We analyzed the expression of surface molecule characteristic for mesenchymal, endothelial, and hematopoietic lineages.
Despite a significant number of studies, to date there is no specific marker available for the optimal identification of MSCs. Although, ISCT established that MSCs must express CD73, CD90, and CD105, others authors recommend Stro-1, CD73, and CD106 as the most useful markers (30). Stro-1-positive population has been shown to be capable of differentiating into multiple mesenchymal lineages, including hematopoiesis-supportive stromal cells with a vascular smooth muscle-like phenotype, adipocytes, osteoblasts, and chondrocytes (20). CD106 (vascular cell adhesion molecule-1, VCAM-1) is expressed on blood vessel endothelial and adjacent cells, consistent with a perivascular location of MSCs (18), and is involved in cell adhesion, chemotaxis, and signal transduction. Moreover, CD106+/Stro-1+ cells show stem cell characteristics such as multipotentiality, expression of telomerase, and high proliferation in vitro (26). Likewise, the persistence of CD73 expression throughout culture also supports its utility as a MSC marker. Two monoclonal antibodies (SH-3 and SH-4) against CD73 have been developed with specificity for mesenchymal tissue-derived cells, as they do not react with HSCs, osteoblasts, or osteocytes.
Our results showed that immunophenotype of ADH cells correspond with those widely described in the literature for MSCs (11,13,19,22,42); the vast majority of cells expressed CD29, CD44, CD73, CD90, CD105, CD106, CD166, CD271, HLA-I, and Stro-1 and were negative for CD34, CD45, and HLA-DR. Moreover, we distinguished some positive cells for these hematopoietic lineage-specific markers in 3D culture. We found positive cells for some mesenchymal molecules (22), such as CD29, CD44, CD73, CD105, CD166, Stro-1, and HLA-I, but not for CD90, CD106, and CD271. Furthermore, we observed how the MAPCs-like cell population (29,45) increased significantly over time in the 3D cell populations (CD13+/CD49b+/CD34-/CD44-/CD45-/CD90-/CD106-/HLA-I-/HLA-DR-). In contrast, CD166+ cells disappeared at day 16, indicating that cells included in the collagen matrix do not need to express this adhesion molecule (14). On the other hand, endothelial precursorlike cell immunophenotype (CD34+/CD133+/CD45-) found at day 10 decreased significantly in favor of a mature endothelial population (CD146+/KDR+) (52). In recent literature, there are discrepancies about the expression of those markers in endothelial progenitors; thus, the search for more specific and reliable markers of “true” EPCs is therefore ongoing. CD34 is normally used to isolate EPCs, but its expression is also shared by HSCs and MSCs, therefore should not be used to distinguish between these populations (8,38,46). Similarly, VEGF receptor 2 (VEGFR2, KDR, Flk-1), which is used to identify EPCs, is expressed also on HSCs (8,28). In humans, CD133 (AC133) is considered to be a marker associated with more primitive stem cell phenotype than CD34 (51). These CD133+ cells are of great interest because they can differentiate into mature endothelial cells (ECs) and contribute effectively to neovascularization (38,41). In addition, circulating ECs are usually identified by CD146 (47,48). Others markers common to progenitor and mature ECs are the cell surface receptors KDR and tunica endothelial kinase (TEK; Tie2; angiopoietin-2 receptor) (7,27,40). As a result, the combination phenotype of CD34/CD133/KDR is now commonly used as a definition for EPCs, since purified populations of CD133+/KDR+ proliferate in vitro and can be induced to differentiate into mature adherent ECs (40).
In any case, it is widely recognized that angiogenesis and bone formation are inseparable, both in development and in fracture repair (33,34). Consequently, it is especially important that our 3D culture system is able to select CD34+/CD133+/KDR+ cells as a strategy to perform tissue engineering composites to promote angiogenesis and to improve bone regeneration.
FACS analysis of cell cycling showed that ADH cells have a distribution according to the parameters of a proliferating population, unlike those of 3D culture cells that are smaller and mainly kept in a quiescent state (only 17% at S + M + G2). It is well documented that an undetectable or low RNA content, as well as small size and low proliferation rate are features of immature and uncommitted cells (17,35). This low proliferation rate, which is a limiting factor for in vitro expansion and thereby for use in regenerative therapies, may also be an indication of stemness. While those ADH cells, with high proliferative rate, should correspond to a population of committed mesenchymal progenitors.
Therefore, we evaluated the expression of pluripotent specific markers by RT-PCR. Results showed that Oct4, Nanog, and Sox-2 were highly expressed in 3D culture at days 10 and 16 but was absent in ADH cells. Oct4, Sox2, and Nanog target genes, identified in embryonic stem cells (ESCs), are known to overlap substantially, suggesting they collaborate to regulate a common set of genes governing pluripotency, self-renewal, and cell fate determination (57). As Nanog was recognized to be essential for the pluripotent phenotype (16,36), Rodda et al. highlight the position of the Oct4 – Sox2 complex at the top of the pluripotent regulatory network hierarchy (43). However, Oct4 and Sox2 are not sufficient to activate Nanog transcription in differentiated cells, suggesting the additional requirement of stem cell-specific cofactor(s). Thus, induced expression of Oct4, Sox2, and Nanog along or not with other regulatory proteins is enough to reprogram lineage-restricted somatic cell populations. These cells, which were called iPS (induced pluripotent stem) cells, exhibit the morphology and growth properties of ESCs and express ESC marker genes (50,55,56).
Taken together, these data support the idea that cells in a collagen gel are maintained in a more undifferentiated state, less committed than ADH cells. Furthermore, this 3D culture system isolate maintains and even allows evolution of cell populations other than undifferentiated MSC.
Histological study of 3D and ADH culture cells, separates or together, placed inside DBM chambers and implanted subdermally into the backs of rat for 2, 4, and 8 weeks, showed significant differences regarding the histogenesis that occurs inside the chambers. One important feature is the formation of significant amounts of blood vessels only in the chambers with cells cultured in the collagen gel, which is clearly observed in sections at 2 weeks of implantation. It is logical to assume that endothelial precursorlike cells that were identified by FACS should be responsible for these angiogenesis phenomena (1,2,49).
Another highlight is the type of tissue formed at 4 weeks. In the case of 3D culture is a well-organized trabecular matrix, lined by osteoblast-like cells, with numerous marrow spaces highly vascularized. This bone tissue seems to have intramembranous origin because no trace of cartilage can be found, such as hypertrophic chondrocytes, cartilage in the process of calcification, or remnants of proteoglycans (12,44). Nevertheless, ADH cells consistently generated abundant cartilaginous tissue in the middle of the chambers and new bone at the edges with features indicating endochondral ossification (44,53). Consequently, when we implanted 3D cells with ADH cells in 1:1 proportion in the same chamber, both types of tissue were observed. Even, a synergistic effect can be detected: a more advanced degree of histogenesis at 2 weeks, with a cartilage tissue itself, active osteoblasts, and cartilage matrix after 8 weeks, etc., indicating that the ossification process remained for longer than when implanted both cell types separately. In terms of this specific study, we find more desirable for the intended application of this investigation the intramembranous bone, which would give more stability to a fracture in less time, since the cartilage mold of the endochondral bone disappears with time (in fact, DBM chambers appear empty at 8 weeks of implantation).
In conclusion, our results demonstrate that bone marrow-derived cells selected by serum restriction in the presence of rhTGF-β1 in 3D collagen matrix were a heterogeneous population of uncommitted cells that express pluripotent specific markers in vitro and can undergo osteogenic and endothelial differentiation in vivo. As these cells clearly have a great potential in cell therapy and show a synergistic effect in vivo with conventional adherent cells and given that large cell numbers are required for clinical feasibility, we propose the implantation of both types of cells as an alternative to improve the repair of bone defects, enhancing MSC effects.
Footnotes
Acknowledgments
This work was supported by grants from the Ministry of Science and Innovation (PLE2009-0163, FIS PI10/02529), the Ministry of Science and Technology (BIO2009-13903-C02-01), and the Andalusian Government (P07-CVI-2781, PAIDI BIO-217, PI-0729-2010). Red de Terapia Celular and CIBER-BBN are an initiative funded by the VI National R&D&I Plan 2008–2011, Iniciativa Ingenio 2010, Consolider Program, CIBER Actions and financed by the Instituto de Salud Carlos III with assistance from the European Regional Development Fund. The authors wish to thank Carmen Rueda-Martínez for her excellent technical assistance. This study was supported in part by research funding from Fina Biotech to J.B., J.A.A. and E.G. The authors declare no conflicts of interest.