
Abstract
There is abundant evidence that immune cells infiltrating into a transplanted organ play a critical role for destructive inflammatory or regulatory immune reactions. Quantitative in situ analysis (i.e., in tissue sections) of immune cells remains challenging due to a lack of objective methodology. Laser scanning cytometry (LSC) is an imaging-based methodology that performs quantitative measurements on fluorescently and/or chromatically stained tissue or cellular specimens at a single-cell level. In this study, we have developed a novel objective method for analysis of immune cells, including Foxp3+ T regulatory cells (Tregs), on formalin-fixed/paraffin-embedded (FFPE) transplant biopsy sections using iCys® Research Imaging Cytometer. The development of multiple immunofluorescent staining was established using FFPE human tonsil sample. The CD4/CD8 ratio and the population of Tregs among CD4+ cells were analyzed using iCys and compared with the results from conventional flow cytometry analysis (FCM). Our multiple immunofluorescent staining techniques allow obtaining clear staining on FFPE sections. The CD4/CD8 ratio analyzed by iCys was concordant with those obtained by FCM. This method was also applicable for liver, small intestine, kidney, pancreas, and heart transplant biopsy sections and provide an objective quantification of Tregs within the grafts.
Keywords
Introduction
Recent improvements in the understanding of the alloimmune processes responsible for transplant rejection, available immunosuppressive medications, more sophisticated surgical techniques, and posttransplant intensive care have led to more successful organ transplantation. Although excellent short-term survival of most transplanted organs is currently achieved, late graft loss, organ shortage, and the toxicities of chronic nonspecific immunosuppressive therapy remain major concerns in the field of transplantation.
T-cell-mediated immunoregulation is considered an important component of the cellular paradigm in transplantation and autoimmune disease (30,48,50). T regulatory cells (Tregs) can promote peripheral self-tolerance by suppressing reactive immune effector cells (49). Sakaguchi et al. described that CD4+CD25+ Tregs were hyporesponsive to T-cell receptor stimulation and were capable of suppressing the proliferation and activation of both CD4+ and CD8+ T cells (47,49). Cytofluorographic analysis of CD4+CD25+ Tregs in peripheral blood associated with various pathologic conditions, including transplantation, have shown clinical significance to the measurement of circulating Tregs in peripheral blood (6,13,17,19,31,43,58).
Identification of putative Tregs inside tissue by immunohistochemistry has been utilized since the discovery of the forkhead/winged helix transcriptional factor Foxp3 that is expressed in CD4+CD25+ T cells (24). Using CD4 and Foxp3 expression as a marker for Tregs, several studies revealed the importance of local (in situ) Tregs in transplantation and other diseases by immunohistochemistry (55,57). These studies usually employ traditional manual counting of target cells, or semiquantitative grading schemes with a limited number of microscopic fields seen by examiners. To date, alternative analytical methods to define immune cell population, including Treg population, within tissue have not been described.
The iCys® Research Imaging Cytometer (CompuCyte, Westwood, MA) is a new generation laser scanning cytometer that performs quantitative measurements on fluorescently and/or chromatically stained tissue or cellular specimens at a single-cell level (1,20,21,42). Although laser scanning cytometry (LSC) and flow cytometry (FCM) share some of the features to evaluate certain cell populations that are labeled with fluorescence, there are several advantages to the iCys. One of the most distinct advantages of LSC/iCys is that it allows objective quantification of large numbers of target molecules on the tissue section (21). Although this unique feature of LSC/iCys is potentially useful for clinical as well as research purposes, one of the obstacles is that LSC/iCys requires immunofluorescent labeling of target molecules. Immunofluorescent labeling is usually performed on frozen sections rather than on formalin-fixed/paraffin-embedded (FFPE) sections, but FFPE tissue is more broadly available than frozen tissue. Despite many reports of immunofluorescent staining of FFPE sections, it has not been accepted as routine clinical or research modality (5,35,44). We have successfully developed multicolor immunofluorescent staining of CD4, CD8, and forkhead box P3 (Foxp3) on FFPE sections optimized for analysis with LSC/iCys.
Using the combination of both techniques, we have demonstrated a novel method for in situ quantitative assessment of T cells on FFPE transplant biopsy sections from various organs. Our method potentially opens the door for detailed analysis of in situ immune cell populations in the grafts with these techniques, which allow for the profiling of the infiltrating immune cells and may be of assistance in understanding of local alloimmune responses in transplantation.
Materials and Methods
Development of in situ Treg analysis on FFPE biopsy was divided into the following three processes: 1) multiple immunofluorescent staining, 2) analysis using LSC/iCys, and 3) application of this method for various transplant organ biopsies and example of in situ Treg analysis on intestinal allograft biopsy.
We utilized FFPE sections from human tonsil as a positive control for Tregs. For the objective quantitative analysis of Tregs, we aimed to calculate the ratio of CD4+ to CD8+ cells, the population of Tregs (CD4+ Foxp3+ cells) among CD4+ T cells, and the population of Treg among the entire T-cell population (a total of CD4+ and CD8+cells).
Protocol for Multiple Immunofluorescent Staining on FFPE Sections
All samples were fixed with 10% neutral buffered formalin for several hours, routinely processed by a rapid tissue processor (Tissue-Tek®Xpress®, Sakura, Torrance, CA) and embedded in the paraffin block. Two sections of 4 μm in thickness from each block were prepared for staining.
One section was stained for CD4 and CD8. Sections were placed on the coated glass slide and baked in an oven for 30 min. Deparaffinization and rehydration were performed using xylene and ethanol. Endogenous peroxidase activity was blocked by non-hydrogen peroxide formula (PeroxAbolish®, Biocare Medical, Concord, CA, USA) either before antigen retrieval or after antigen retrieval. Antigen retrieval was performed using a pressure cooker with 120°C for 10 min, soaking sections in Borg Decloaker® (Biocare Medical) with an antigen retrieval solution of pH 9.5. Protein block was done by incubating 1% normal goat serum for 20 min. Anti-human CD4 monoclonal antibody originated from mouse (clone BC/1F6, IgG1, Biocare Medical) and anti-human CD8 polyclonal antibody originated from rabbit (abcam, Cambridge, MA, USA) were diluted by Van Gogh Yellow antibody diluent (Biocare Medical) and mixed with the final dilution being 1:25 and 1:50, respectively. Diluted primary antibodies were incubated overnight at 4°C. Labeling was performed by polymer horseradish peroxidase (HRP) and catalyzed signal amplification with CD4 and CD8 being labeled by Alexa Flur® 647 and Alexa Flur® 488, respectively. Polymer HRP conjugated anti-mouse secondary antibody (EnVision®, DAKO, Carpinteria, CA, USA) was incubated for 45 min at room temperature, and then Alexa 647 conjugated tyramide (Invitrogen, Carlsbad, CA, USA) was incubated for 10 min at room temperature for the labeling of CD4. Then, peroxidase activity was blocked by non-hydrogen peroxide formula (Perox Abolish®, Biocare Medical) for 30 min at room temperature. Polymer HRP conjugated anti-rabbit secondary antibody (EnVision®, DAKO) was incubated for 45 min at room temperature, and then Alexa 488-conjugated tyramide (Invitrogen) was incubated for 10 min at room temperature. Nuclear counterstaining was performed by incubation of propidium iodide (PI) diluted 1:50 with antibody diluent (Invitrogen) for 10 min. The stained slide was cover-slipped using mounting media (ProLong®, Invitrogen) and stored in the dark at 4°C until analysis. Another section was stained for CD4 and Foxp3. Staining protocol was the same as described above except for the primary antibodies. Instead of the antibody to CD4 and CD8, we used anti-human CD4 monoclonal antibody (clone BC/1F6, IgG1, Biocare Medical) with dilution of 1:25 and anti-human Foxp3 polyclonal antibody (abcam) with dilution of 1:400. CD4 and Foxp3 were labeled with Alexa 647 and Alexa 488, and nuclear counterstain was done by PI.
The same staining procedure without primary antibody [or with relevant isotype antibody (mouse and rabbit)] on each tonsil sample was run as negative control. All stained slides were subjected to the analysis using LSC/iCys within 3 days after staining.
Protocol for Analysis Using LSC/iCys and Validation in Comparison with FCM
We developed a LSC/iCys scanning protocol using the Argon Ion and Helium Neon laser to detect the fluorescent staining of Alexa 488, Alexa 647, and PI at 40× magnification. Single-cell events were identified using contouring of the PI-stained nuclei. For each single event, the total fluorescent signal of the nuclear-localized Foxp3 and the membrane-bound CD4 and CD8 were measured using iCys cytometric analysis software, version 3. The CD4/CD8 ratio, the population of CD4+ Foxp3+ Tregs among CD4+ cells were subsequently analyzed and the population of CD4+Foxp3+ cells among the entire T cells (a total of CD4+ cells and CD8+ cells) were calculated.
To investigate the validity of the analysis using LSC/iCys, we compared the CD4/CD8 ratio between regular FCM and LSC/iCys. Eleven cases of human tonsil with varying CD4/CD8 ratios were selected for this validation study, which had FFPE sample and cytological examination of CD4/CD8 rate by FCM from the same location. That is, each of harvested tonsil was divided into two pieces; one was subjected to cytological examination of a routine lymphoma working up using FCM and another one was processed to FFPE sample for a routine clinical histology. CD4/CD8 rate of each case was calculated as a part of routine lymphoma work up with FCM as previously described (41). In brief, gating was performed on lymphocytes (with characteristic forward and side scatter features and high CD45 staining) or blast-sized cells. The designation of positive cells was based on values compared to cells stained with irrelevant isotype controls and conjugated to the same fluorochrome. The antibodies were attached to the cells isolated from the tissue after a washing step and incubated at 4°C for 30 min, then washed twice. The cells were fixed with 2% paraformaldehyde and analyzed in less than 2 h after staining on a flow cytometer (FacsCaliber Beckman Coulter). Listmode data on 5,000 gated cells were collected with 1024 channel resolution and was analyzed using Cell Quest software (Becton Dickinson). Several sections from each case were obtained according to approved procedure at Miami Transplant Institute, University of Miami from each residual FFPE sample archived in our institute under informed consent. Those FFPE slides were prepared and analyzed for their CD4/CD8 ratio as mentioned above. The CD4/CD8 ratio obtained by LSC/iCys analysis was compared with those by regular FCM examination using paired t-test (SPSS version 11) and a value p < 0.05 was considered statistically significant.
Applicability of This Method on Various Transplant Organ Biopsies
This developed methodology was applied to investigate its applicability on the following transplant biopsy samples that were diagnosed as acute rejection: 1) liver biopsy with moderate acute rejection; 2) small intestine biopsy with mild acute cellular rejection (ACR); 3) kidney biopsy with acute T-cell-mediated rejection, type IIA; 4) pancreas biopsy with mild acute cell-mediated rejection; 5) endomyocardial biopsy with acute cellular rejection, grade 3R (Fig. 1). The CD4/CD8 rate, the population of CD4+Foxp3+ cells among CD4+ cells, and the population of CD4+Foxp3+ cells among the entire T cells (a total of CD4+ and CD8+ cells) were obtained. Furthermore, manual counting of CD4+ cells and CD4+Foxp3+ cells was performed on the same sections of each transplant biopsy sample stained for CD4 and Foxp3. The number of positive cells for CD4 or both of CD4 and Foxp3 were counted in randomly selected 10 high power fields (hpfs) on each section (400×). The population of CD4+Foxp3+ cells among CD4+ cells by manual counting was calculated based on those numbers of CD4+ cells and CD4+Foxp3+ cells.
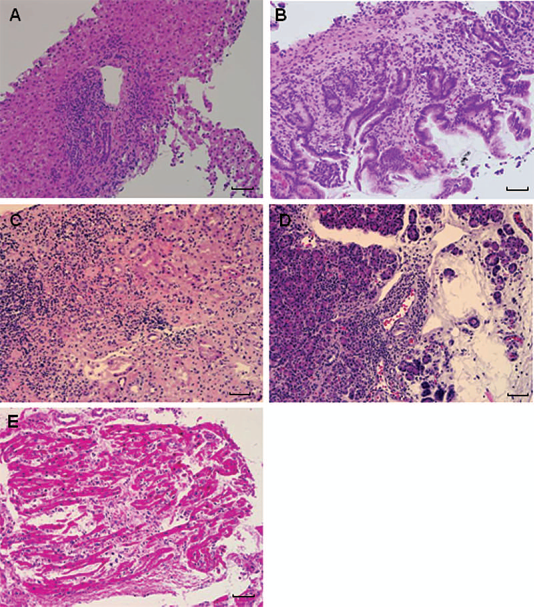
H&E stains of transplant organ biopsies (scales indicate 250 μm). (A) Liver biopsy with moderate acute rejection (200×); (B) small intestine biopsy with mild acute cellular rejection (200×); (C) kidney biopsy with acute T-cell-mediated rejection (200×), type IIA; (D) pancreas biopsy with mild acute cell-mediated rejection (200); (E) endomyocardial biopsy with acute cellular rejection, grade 3R (200).
Comparative Analysis of Treg Population Within Inflammatory Infiltrate Between Early Onset and Late Onset Acute Cellular Rejection in Intestinal Transplantation
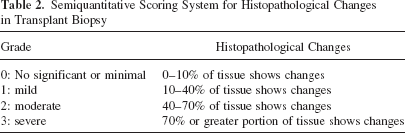
Ten cases of early onset acute cellular rejection (E-ACR), defined as FFPE biopsy sample from intestinal allograft showing histopathological ACR within 1 month after intestinal transplantation, and 10 cases of late onset acute cellular rejection (L-ACR), defined as FFPE biopsy sample from intestinal allograft showing histopathological ACR beyond 6 months after intestinal transplantation, were compared regarding the histopathological features listed in Table 1 and analyzed Treg population within inflammatory infiltrate in lamina propria using in situ quantitative analysis of Tregs. All the cases were morphologically compatible with grade 1 ACR. Median days from intestinal transplantation to biopsy of E-ACR and L-ACR cases were 22 days, ranging from 10 to 27, and 228 days, ranging from 190 to 423, respectively. The histopathological features were blindly evaluated by two authors (H.T. and V.D.), using a semiquantitative scoring system (Table 2) (46). Unpaired t-test, Mann-Whitney's U-test, chi-square test were used for statistical analysis whenever appropriate. Values below p < 0.05 were considered statistically sinificant.
Summary of Histopathological Comparison and In Situ Quantitative Analysis of Tregs in Early Onset Acute Cellular Rejection and Late Onset Acute Cellular Rejection in Intestinal Transplantation
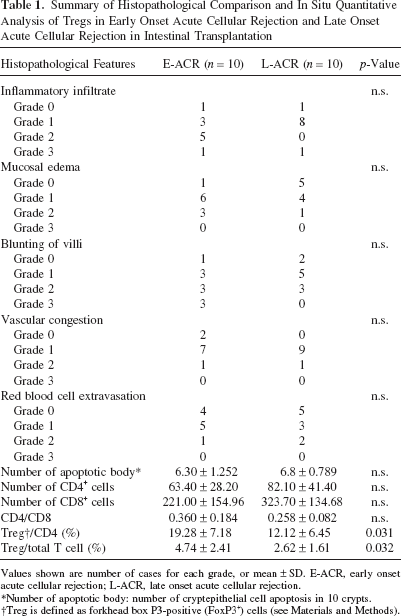
Values shown are number of cases for each grade, or mean ± SD. E-ACR, early onset acute cellular rejection; L-ACR, late onset acute cellular rejection.
Number of apoptotic body: number of cryptepithelial cell apoptosis in 10 crypts.
Treg is defined as forkhead box P3-positive (FoxP3+) cells (see Materials and Methods).
Semiquantitative Scoring System for Histopathological Changes in Transplant Biopsy
Results
Multiple Immunofluorescent Staining on FFPE Sections
Immunofluorescent staining for CD4 was the crucial part of multiple immunofluorescent staining. In our setting of multiple immunofluorescent staining on FFPE sections, we determined that the optimal protocol for antigen retrieval was 1) using a pressure cooker (Decloaking Chammber Pro®, Biocare Medical) with 120°C for 10 min, 2) soaking sections in an antigen retrieval solution of pH 9.5 (Borg Decloaker®, Biocare Medical), and 3) blocking of endogenous peroxidase activity before antigen retrieval. We employed this protocol for the further experiments in this study. Figure 2 shows the multiple immunofluorescent staining on tonsil sections and the analysis of CD4+Foxp3+ Tregs. The staining quality of Alexa488 (CD8 or Foxp3) and Alexa 647 (CD4) was satisfactory (Fig. 2A, D) for the analysis by LSC/iCys. Nonspecific staining was minimally present on negative control slides on both of CD4/CD8 and CD4/Foxp3 staining (Fig. 2B, E). Nuclear counterstaining by PI was clearly identified and detected by LSC/iCys (Fig. 2B, E).

Multiple immunofluorescent staining on FFPE human tonsil section and the analysis of CD4+Foxp3+ Tregs. (A) Formalin-fixed/paraffin-embedded (FFPE) human tonsil section stained for CD4 (Alexa 647, red) and CD8 (Alexa 488, green) (200×). Nuclear staining by propidium iodide (PI) was blanked. Scale bar: 50 μm. (B) Negative control staining with nuclear staining by PI (red) (200×). Nonspecific staining was minimally observed. Scale bar: 50 μm. (C) Distribution of signal integral of Alexa 488 (CD8) and Alexa 647 (CD4) obtained with laser scanning cytometry (LSC)/iCys. The CD4/CD8 ratio on this sample was revealed 0.38. (D) CD4 (Alexa 647, red) and Foxp3 (Alexa 488, green) staining on the same tonsil section (400×). Nuclear staining was performed by PI (blue). Scale bar: 25 μm. (E) Negative control staining with nuclear staining by PI (blue) (200×). Nonspecific staining was minimally observed. Scale bar: 25 μm. (F) Distribution of Alexa 488 (Foxp3) gated at CD4+ cell population. The population of Tregs (CD4+Foxp3+ cell) was 8.5%. (G) Comparison of CD4/CD8 ratio between flow cytometry (FCM) and iCys. There was no statistically significant difference between them (p = 0.393).
Comparison of CD4/CD8 Ratio Between Conventional FCM and LSC/iCys and In Situ Quantitative Analysis of Treg Immunophenotyping
Figure 2C shows the analysis of CD4/CD8 rate on tonsil sections using LSC/iCys. Approximately 40,000 cells were recorded. Distribution of signal integral of Alexa 488 (CD8) and Alexa 647 (CD4) were visualized in a scatter gram and the CD4/CD8 rate was 0.38. A certain amount of cells was detected as double-positive cells possibly due to the extensive overlapping of cells within a section. Figure 2F shows the distribution of signal integral of Alexa 488, which represents the Foxp3+ cells, among the cell population gated at CD4+ cells. The population of CD4+Foxp3+ cells among CD4+ cells was 8.5%. Thus, the population of CD4+Foxp3+ cells among the entire T-cell population (a total of CD4+ and CD8+ cells) was calculated to be 2.3%. Figure 2G shows the comparison of CD4/CD8 ratios between FCM and LSC/iCys in 11 cases. There was no statistically significant difference between these two methods (p = 0.393).
Application of the Method on Various Transplant Biopsies
Figure 3 shows the application of in situ quantitative analysis of Tregs on various transplant biopsies, corresponding to H&E stains in Figure 1. Figure 3A–E demonstrates the scattergrams, which represent CD8 (Alexa 488, x-axis) and CD4 (Alexa 647, y-axis) of liver, small intestinal, kidney, pancreas, and endomyocardial biopsies, respectively. Note that double-positive cells were less than those determined in tonsil sample because there is less intensive overlapping of inflammatory cells in graft biopsies; this allowed more precise detection of each fluorescent integral related to each single cell. Figure 3F–J demonstrates the histograms, which represent the distribution of signal integral of Alexa 488 among the population gated at CD4+ cells in liver, small intestine, kidney, pancreas and endomyocardial biopsies, respectively. Using this information, CD4/CD8 ratio, the population of CD4+Foxp3+ Tregs among CD4+ T-cell population, and the population of CD4+Foxp3+ Tregs among the entire T-cell population (a total of CD4+ and CD8+ cells) is calculated and summarized in Table 3. The population of CD4+Foxp3+ Tregs among CD4+ T cells by manual counting in each transplant biopsy is also summarized in Table 3. Those by manual counting in intestine and heart transplant biopsies were almost concordant with those by LSC/iCys analyses, while modestly varied in liver, kidney, and pancreas transplant biopsies.
Summary of In Situ Quantitative Analysis of Tregs and Manual Counting on Various Transplant Biopsies
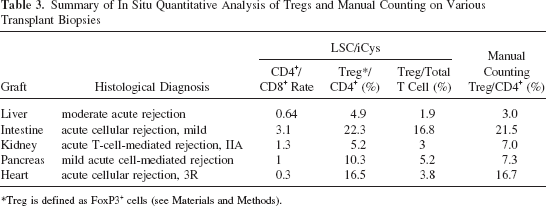
Treg is defined as FoxP3+ cells (see Materials and Methods).

In situ quantitative analysis of Tregs on FFPE sections of various transplant biopsies. (A–E) The distributions of signal integral of Alexa 488 (CD8, x-axis) and Alexa 647 (CD4, y-axis) on liver, small intestinal, kidney, pancreas, and endomyocardial biopsies, respectively. Note that double-positive cells were less than those determined in tonsil sample because less intensive overlapping of inflammatory cells in graft biopsy allowed more precise detection of each fluorescent integral related to each single cell. The upper panels of (F–J) demonstrate the distributions of signal integral of Alexa 488 (Foxp3, x-axis) among the cell population gated at CD4+ cells in liver, small intestine, kidney, pancreas, and endomyocardial biopsies, respectively. The lower panels of (F–J) showed the negative controls.
Quantitative Analysis of Treg Population Within Inflammatory Infiltrate in Intestinal Transplantation; Comparative Analysis Between Early Onset and Late Onset Acute Cellular Rejection
Comparisons of histopathological features are summarized in Table 1. All histopathological features, including average number of apoptotic bodies in 10 crypts as well as severity of inflammatory infiltrate, mucosal edema, blunting of villi, vascular congestion, and red blood cell extravasation failed to show statistically significant differences between E-ACR and L-ACR cases (Table 1). Whereas there were no statistically significant differences in the numbers of CD4 cells, CD8 cells, and CD4/CD8 rate acquired by LSC/iCys, in situ quantitative analysis of Tregs showed significantly decreased rate of Tregs/CD4 and Tregs/total T cells in L-ACR in comparison with those in E-ACR (Table 1).
Discussion
Recent intensive researches have revealed the importance of Tregs in autoimmune regulations (7,29,34, 39,51,55,57). The mechanisms of suppressive function of Tregs are not yet fully understood, but the following progression of events is thought to be involved: engagement of Treg T-cell receptor (TCR) by antigen, direct cell interaction, local secretion and cytokine signaling, such as transforming growth factor-β (TGF-β) and interleukin-10 (IL-10), and inhibition of transcription of genes related to effector functions (24,32,40,56). Considering the potential regulatory mechanisms in Tregs, the behavior of local Tregs within graft tissue is critical for understanding local alloimmune regulations. Several reports have implied that the local Tregs had more significant clinical relevance rather than the circulating Tregs (14,15,45).
The specificity of Foxp3 expression for Treg function has been shown in mice and humans although Foxp3 can be expressed in some activated human CD4 or CD8 T cells that do not express CD25 constitutively (24). Recent reports showed immunohistochemical detection of Foxp3 mainly identified Foxp3bright cells by FCM, which largely corresponded to immunosuppressive Tregs, while Foxp3low cells by FCM (including activated non-Tregs) remained below the detection threshold (4,37,53). Therefore, CD4+Foxp3+ cells on transplant biopsy section detected by our method may consist mainly of immunosuppressive Tregs. However, CD4+ Foxp3+ cells detected by our method need to be assessed regarding immunosuppressive function for the further investigation because our method employed signal amplification for immunofluorescent labeling and LSC/iCys for detection of Foxp3+ cells; the detection threshold of Foxp3 may vary from other detection methodologies. Previous studies used CD4 and Foxp3 as a marker for local Tregs and revealed its significance using quantification or semiquantification of in situ Treg populations by manual counting under microscopic examination (55,57). Although this method is convenient, there is an inevitable issue of reproducibility. Moreover, it is impossible to compare the local Treg population with that in peripheral blood because there is no method to bridge the gap between manual quantification of local Tregs and objective quantification of peripheral Tregs by FCM.
New generation laser scanning cytometry (iCys) allows objective quantification of fluorescently labeled tissue sections on a microscope slide (21). The details of instrumentation and analysis software were described previously (3,11,18,20,21,25,27,28,36,54). Its qualities for our research programs stem from its ability to simultaneously produce high-resolution images and quantitative cytometric measurements of cellular and tissue constituents on the single-cell level in specimens applied to a solid phase (i.e., tissue samples on microscope slides). Samples stained with both fluorescent and chromatic dyes can be analyzed. LSC/iCys is distinct from FCM in the following aspects: 1) LSC/iCys can utilize a section on slide, not requiring the special preparation for suspension of cells, with microanatomy of tissue being preserved; 2) LSC/iCys acquires and retains precise position data of each cell, allowing direct visualization of the target cells, repeated scanning, and potentially re-staining; 3) based on the microanatomical data, quantitative analysis in a particular area, such as portal area in liver tissue, within section is possible; 4) LSC/iCys can obtain a detailed quantitative analysis using very few cells, making it ideally suited for small samples from biopsies. These features of LSC/iCys provide an opportunity for in situ objective quantitative analysis.
Despite the advantages of frozen sections in applying immunofluorescent staining and real-time PCR, the majority of clinical samples are processed as FFPE ones and they are more commonly available than frozen tissue because of the superiority of FFPE sections to frozen sections regarding preservation of morphology. Indeed, most clinical samples of transplant biopsy are archived as FFPE samples in our institute. Therefore, to apply the LSC/iCys analysis in various clinical and research situations, the effective immunofluorescent staining on FFPE sections is quite important. Immunofluorescent labeling of FFPE samples has not yet been widely accepted, although there have been many published reports that describe these techniques. One major reason is that fluorescent signals from FFPE sections are usually weaker when compared to frozen sections, and insufficient for precise examination. We utilized a catalyzed signal amplification combined with polymer HRP to increase the labeled fluorescent signals. The catalyzed signal amplification has been applied in various detection techniques, such as immunofluorescent staining and in situ hybridization, in which the peroxidase-mediated deposition of hapten- or fluorochrome-labeled tyramides is used to visualize target molecules with significant signal amplification (8,22,23,33) and several staining kits are commercially available. Moreover, we used polymer HRP, instead of ordinary HRP-conjugated secondary antibody, because the HRP activity is higher in polymer HRP than in ordinary HRP-conjugated secondary antibody and more intense deposition of fluorochrome-labeled tyramides is expected (10).
Another major issue of immunofluorescent staining on FFPE sections is autofluorescence (44). Actually, we experienced autofluorescence but it was minimal, as we show in Figure 2B and E. In this study, autofluorescence did not cause significant effects on analysis partly because narrow band laser light illumination used in LSC/iCys minimizes the effect of undesirable autofluorescence. Moreover, LSC/iCys equips the compensation function to reduce the effect of autofluorescence in case autofluorescence affects the quality of analysis. Reproducibility of immunofluorescent staining is possibly influenced by the quality of FFPE sample (e.g., the fixation period in formalin). The antigen retrieval process is one of the key steps for the reproducible staining. We evaluated several antigen retrieval processes, including the use of a pressure cooker. In this study, antigen retrieval after blocking of endogenous peroxidase using a pressure cooker with 120°C for 10 min, soaking sections in an antigen retrieval solution of pH 9.5, provided the most reproducible immunofluorescent staining. Although modifications on antigen retrieval protocol may be required for the optimization of multiple immunofluorescent staining on FFPE sections under each experimental circumstances, among CD4, CD8, and Foxp3, staining for CD4 was the most crucial and the important points for successful CD4 staining were: 1) to block endogenous peroxidase activity before antigen retrieval and 2) to use high pH (i.e., pH 9.5) antigen retrieval solution. Also, the quality of FFPE sample may influence the degree of signal amplification by a catalyzed signal amplification of the specific signals as well as the background signals. In case that increased background signal amplification impairs the quality of analysis, reduced incubation time of polymer HRP-conjugated secondary antibody would decrease background signal amplification more than specific signal amplification, resulting in better signal-to-noise ratio and more reproducible analysis. Those processes are keys for obtaining reproducible multiple immunofluorescent staining and need to be optimized under the individual experimental conditions for the stable automated analysis.
Previous studies have described the concordance between LSC and FCM analysis (3,10). Our method showed concordance of the CD4/CD8 ratio between LSC and FCM, indicating that the results from LSC/iCys and FCM can be seen equivalent. Direct comparison between local (i.e., in situ) and systemic (i.e., in peripheral blood) would be quite interesting. It has not been feasible to directly compare the result from manual quantification in situ and objective quantification by FCM because the nature of quantification is completely different. However, it is potentially possible to investigate the correlation between the quantification of in situ (e.g., intragraft) Tregs by LSC/iCys and of circulating Tregs in peripheral blood by FCM, although further precise study is required to confirm the validity of direct comparison between LSC/iCys and FCM.
In this report, we introduced a protocol for multiple immunofluorescent staining and analysis with LSC/iCys, which was optimized for the quantitative in situ analysis of Tregs on FFPE sample, and the data shown in this report were anecdotal, just to evaluate the potential application of our protocol. Additionally, preliminary data from limited number of samples of intestinal allograft biopsy were shown regarding the differences of Treg population in inflammatory infiltrate between E-ACR and L-ACR. Although clinical significances of L-ACR were reported in various organ transplantations, its characteristics regarding immunological and molecular mechanisms have not been yet fully investigated (2,12,26,38). Our quantitative analysis successfully showed significant differences of Treg population in inflammatory infiltrate between E-ACR and L-ACR cases in intestinal transplantation. Because of the small sample size of those preliminary data, clinical and immunological significance of the reduced number of Tregs in L-ACR were not clear. However, those results indicated that even morphologically identical ACR cases might vary in terms of the nature of infiltrated inflammatory cells, which can be detected by our multiple immunofluorescent staining and quantitative analysis with LSC/iCys. The detailed analysis regarding the roles of in situ Tregs associated with alloimmunity in the various setting of transplantation would be performed with a large number of samples in the future study. Although only data regarding T cells were shown in this study, there are numerous potential applications using the similar technique. Our method allows relatively complicated phenotypic analysis of memory/effector T cells, CD8+ regulatory T cells, dendritic cells, and macrophages (9,16). By combining intracytokine/chemokine staining, Th1/Th2, and Th17 T cells can be also quantitatively evaluated in the grafts (52). Moreover, we will be able to identify the cells specifically infiltrating tissue, combined with the staining of tissue specific markers. An ongoing clinical study using these techniques will be useful to further investigate how immune cells located in the graft site play an important role in immune reaction.
The method presented in this study can be further optimized to enhance the overall efficiency. First, the multiple immunofluorescent staining protocol can be streamlined to reduce preparation time. Second, simultaneous acquisition of multiple fluorescent channels can be applied to the LSC/iCys to reduce the acquisition time. Third, new event segmentation algorithms and advanced image analysis can be utilized to reduce the effects of overlapping cells, especially in tissues where cells are extensively overlapping each other, such as lymphatic organs. Use of thinner section would further reduce the overlapping of cells and false double-positive cell population, resulting in improved quality of analysis. Fourth, the staining intensity of inflammatory cells may affect data accuracy in other transplant biopsy samples. In this study, the population of CD4+Foxp3+ Tregs among CD4+ T-cell population in intestine and heart transplant biopsies by LSC/iCys and by manual counting were almost identical, while modestly different in liver, kidney, and pancreas. There are several potential issues that caused those differences: 1) the influence of the intensity of inflammatory cells infiltrated in each transplant biopsy, and 2) the influence of irreproducibility of manual counting. Although the clinical application of our method needs to be confirmed in future studies, LSC/iCys provides a more objective and reproducible analysis.
In conclusion, LSC/iCys and multiple immunofluorescent staining with signal amplification allowed objective quantification of in situ CD4+/FoxP3+ T-cell populations, with precise quantitative analysis at a single-cell level on FFPE sections. This objective method can provide essential quantitative analysis of Treg populations even in small biopsy tissues from various transplant organs. Detailed analysis of in situ Treg population in transplant biopsy samples may contribute to a better understanding of local alloimmune response in transplantation.
Footnotes
Acknowledgments
This work was supported in part by the Diabetes Research Institute Foundation. The authors are grateful to the members of General Clinical Research Center and Imaging Core at the Diabetes Research Institute, Administrative Offices at the Diabetes Research Institute, and Organ Procurement Organizations for the continuous enthusiasm and support to our program and to CompuCyte Corporation for technical support.