
Abstract
The composition of mesenchymal stromal cells (MSCs) changes in the course of in vitro culture expansion. Little is known how these cell preparations are influenced by culture media, plating density, or passaging. In this study, we have isolated MSCs from human adipose tissue in culture medium supplemented with either fetal calf serum (FCS) or human platelet lysate (HPL). In addition, culture expansion was simultaneously performed at plating densities of 10 or 10,000 cells/cm2. The use of FCS resulted in larger cells, whereas HPL significantly enhanced proliferation. Notably, HPL also facilitated expansion for more population doublings than FCS (43 ± 3 vs. 22 ± 4 population doubling; p < 0.001), while plating density did not have a significant effect on long-term growth curves. To gain further insight into population dynamics, we conceived a cellular automaton model to simulate expansion of MSCS. It is based on the assumptions that the number of cell divisions is limited and that due to contact inhibition proliferation occurs only at the rim of colonies. The model predicts that low plating densities result in more heterogeneity with regard to cell division history, and favor subpopulations of higher migratory activity. In summary, HPL is a suitable serum supplement for isolation of MSC from adipose tissue and facilitates more population doublings than FCS. Cellular automaton computer simulations provided additional insights into how complex population dynamics during long-term expansion are affected by plating density and migration.
Keywords
Introduction
Mesenchymal stromal cells (MSCs) can be isolated from many tissues including bone marrow and adipose tissue. They comprise multipotent cells that can be differentiated into at least osteogenic, adipogenic, and chondrogenic lineages (17). The ease of culture expansion, multilineage differentiation potential, and immunomodulatory activity raise high hopes for various therapeutic applications that are concurrently tested in clinical trials. On the other hand, many variables such as the tissue used for the isolation, culture media, plating density, and passaging may affect the composition of cellular products (2,42).
Culture media of MSCs are traditionally supplemented with fetal calf serum [FCS; alternatively termed fetal bovine serum (FBS)]. In light of therapeutic applications, there is a growing interest to avoid the use of FCS due to potential xenogeneic immune reactions (e.g., anti-FCS antibodies), bovine pathogens (viruses and prions), and a high lot-to-lot variability that hampers reproducibility of results (21,40). Chemically defined synthetic culture media are now commercially available, but their precise composition is often undisclosed and they often include other xenogeneic components such as recombinant growth factors. Several groups demonstrated that human platelet lysate (HPL) represents another attractive alternative to FCS (1,5,10,18,22,30,35). HPL can be generated from common platelet units by a simple freeze–thaw procedure. It is even possible to use HPL from the same donor to further minimize the risk of immunological side effects or viral infections (23). These studies were performed with MSCs from bone marrow and recently Blande and coworkers demonstrated that HPL can also be used for isolation of MSCs from human adipose tissue (6).
MSCs grow in a plastic adherent monolayer until they are contact inhibited. Many groups have addressed the optimal plating densities ranging from 3 to 10,000 cells/cm2. Some authors suggested that low seeding densities result in faster proliferation and a larger fraction of multipotent cells (11,37) and that strict maintenance of low cell densities throughout expansion even selects for multipotent adult stem cells (MAPCs) (25). Others indicated that the initial plating density is not critical for maintenance of the stem cell fraction and that higher densities might even be more effective for expansion of MSCs (9,28,31). Therefore, optimal seeding densities and passaging intervals are still unknown.
Within 2–3 months, the proliferation rate of MSCs decays until they ultimately reach a senescent state. This is accompanied by enlarged morphology, reduced expression of surface markers, and decreased differentiation potential (3,33,44). The number of cell divisions might be determined by a cell-intrinsic mechanism such as successive loss of telomere integrity. However, the precise molecular mechanisms of the “Hayflick-limit” are still hardly understood (38,43). Long-term expansion may have implications for cellular therapy but how to track the state of cellular aging in MSCs is not a trivial question (41). This process does not occur in parallel across cells in culture due to different subpopulations, apoptosis, and, last but not least, contact inhibition within colonies. Lower seeding density facilitates higher intervals for cell passaging and, hence, proliferation can only occur at the rim of the larger colonies.
In this study, we performed long-term expansions with MSCs from adipose tissue using either FCS or HPL at low or high plating densities. These data provided the basis for a cellular automaton model to simulate MSC preparations with a finite number of cell divisions under different culture conditions.
Materials and Methods
Isolation of MSCs From Adipose Tissue
MSCs were isolated from lipoaspirates after informed consent and ethical approval by the Ethics Committee of the University of Aachen. Lipoaspirates were washed in 9 g/L NaCl, centrifuged at 300 × g for 10 min, and the middle layer was subsequently digested with 2 g/L collagenase type I with 15 g/L bovine serum albumin (BSA; PAA, Pasching, Austria) in collagenase buffer (HEPES 100 mM, NaCl 120 mM, KCl 50 mM, CaCl2 1 mM, glucose 5 mM, pH 7.4; all Sigma-Aldrich) 45 min at 37°C on a horizontal rotary shaker. The digested tissue was passed through a 100-μm cell strainer and resuspended in corresponding culture media to inactivate collagenase activity. For initial cultures, cells were counted and seeded at 100 or 100,000 cells/cm2. These cell densities were higher than those of later passages, because only a small percentage of cells give rise to fibroblastoid colony forming units (CFU-Fs). After 48 h, a medium exchange was performed in order to remove erythrocytes and other nonadherent cells.
Culture Media
Pooled HPL was generated from five platelet units of healthy donors as described previously (23). In brief, thrombocyte concentrates were kindly provided by the Institute for Transfusion Medicine of RWTH Aachen University Medical School after informed consent and ethical approval. They had a platelet content of 2.0 to 4.2 × 10¹¹ platelets in 200 ml plasma supplemented with acid-citrate-dextrose (ACD) (1:11, v/v). Platelet units were aliquoted, twice frozen at −80°C, rethawed at 37°C, centrifuged at 2600 × g for 30 min at 4°C to remove cell fragments, and pooled in equal amounts. The supernatant was filtered through 0.22-μm GD/X polyvinylidene fluoride (PVDF) filter device (Whatman, Dassel, Germany), supplemented with 2 U/ml heparin to avoid gelatinization and stored at −80°C.
Cells were cultured cell culture dishes (Greiner, Kremsmünster, Austria) in Dulbecco's modified Eagles medium-low glucose (DMEM-LG; PAA) with 2 mM L-glutamine (Sigma Aldrich, St. Louis, MO, USA) and 100 U/ml penicillin/streptomycin (pen/strep; Lonza, Basel, Switzerland). Culture medium was supplemented with FCS (HyClone, Bonn, Germany) or HPL as indicated in the text. Cells were cultured at 37°C in a humidified atmosphere containing 5% carbon dioxide with medium changes twice per week.
CFU-F Assay
CFU-F frequency was determined in initial cell preparations from adipose tissue. Cells were seeded in limiting dilutions in 96-well plates at 1, 5, 10, 30, and 300 cells per well (96 replica for each condition) with medium changes twice per week. After 10 days cells were stained with crystal violet and photo-documented with a Leica DM IL HC microscope (Leica, Wetzlar, Germany). Colonies of at least five cells were counted and CFU-F frequency was calculated in relation to the initial cell number with L-Calc Software (Stem Cell Technologies, Vancouver, Canada).
Long-Term Culture of MSCs
For long-term culture, cells were seeded in a density of 10,000 cells/cm2 in culture flasks (Nunc Thermo Fisher Scientific, Langenselbold, Germany) and expanded until the colonies reached an estimated 50% confluency. Alternatively, cells were seeded at low cell densities of 10 cells/cm2 and replated when the colonies became extremely large (at about 5% confluent growth). Cell counting was performed using a Neubauer counting chamber (Brand, Wertheim, Germany) and additionally with a CASY cell counter (Schärfe System, Reutlingen, Germany). Population doublings per passage (PDP) and cumulative population doublings (PD) were calculated from the first passage onward by the following formula, as previously described (13,44): PDPi = log2 (h/si); PD = sumi=1…nPDPi, where n is the total number of passages, s i is the number of cells seeded at passage i, and h i is the number of cells harvested in passage i.
Proliferation Assay
Cell proliferation was evaluated via the thiazolyl blue tetrazolium bromide (MTT) assay. MSC were seeded on a 96-well plate (3,000 cells/well) in culture medium supplemented with 0%, 1%, 5%, 10%, or 20% of FCS or HPL as indicated in the text. After 7 days of culture, cells were washed with PBS (PAA) and incubated with 1 mM MTT (Sigma-Aldrich) in PBS for 3.5 h. The excess solution was discarded and crystals were resolved in 4 mM HCl in isopropanol (both from Roth, Karlsruhe, Germany). Optical density (OD) was measured at wave length 590 nm with a Tecan Infinite 2000 plate reader (Tecan Trading, Männedorf, Switzerland).
In Vitro Differentiation of MSCs
Osteogenic and adipogenic differentiation was performed for each donor and each culture condition (HPL/FCS and 10/10,000 cells/cm2) as described previously (44). Differentiation media were supplemented with either 10% FCS or 10% HPL. Adipogenic differentiation media consists of DMEM-high glucose (PAA) with 2 mM Lglutamine (Sigma-Aldrich), 100 U/ml pen/strep (Lonza), 1 μM dexamethasone (Sigma-Aldrich), 0.5 mM 1-methyl-3-isobutylxanthin (Sigma-Aldrich), and 10 μg/ml insulin (Sigma-Aldrich). Osteogenic differentiation media consists of DMEM-low glucose (PAA) with 2 mM L-glutamine (Sigma-Aldrich), 100 U/ml pen/strep (Lonza), 100 nM dexamethasone (Sigma-Aldrich), 200 μM L-ascorbic acid-2-PO4 (Sigma-Aldrich), and 10 mM β-glycerophosphate (Sigma-Aldrich). Medium was changed twice a week. After 3 weeks, adipogenic and osteogenic differentiation was analyzed by staining with Oil Red O or Alizarin Red, respectively (44).
Quantitative Real-Time PCR Analysis
Adipogenic differentiation was validated on gene expression level for adiponectin (ADIPOQ), fatty acid binding protein 4 (FABP4), and peroxisome proliferator-activated receptor γ (PPARγ), whereas osteogenic differentiation was addressed with runt-related transcription factor 2 (RUNX2), which is upregulated in osteogenesis and chondrogenesis. After differentiation of MSCs in passage 5, total RNA was isolated and reversely transcribed as described previously (44). Real-time quantitative PCR (qRT-PCR) was performed using the StepOne™ Instrument (Applied Biosystems, Applera Deutschland GmbH, Darmstadt, Germany) with the Fast SYBR® green PCR master mix (Applied Biosystems). Primers were obtained from Metabion (Martinsried, Germany): glyceraldehyde-3-phosphate dehydrogenase (GAPDH)—forward, TTCGTCATGGGTGTGAACCA and reverse, CTGTGGTCATGAGTCCTTCCA; ADIPOQ—forward, ATCACCACTAACTCAGAGCC and reverse, AGTG-GGCACAAAATAGCACT; FABP4—forward, TCCAGTGAAAACTTTGATGATTAT and reverse, ACGCATTCCACCACCAGTTTATCA; PPARγ—forward, TCCATGCTGTTATGGGTGAA and reverse, TGTGTCAACCATGGTCATTTC; RUNX2—forward, CCACCTCTGACTTCTGCCTC and reverse, CCACCTCTGACTTCTGCCTC. Gene expression levels were normalized to GAPDH. Expression of these differentiation markers was always calculated in relation to the corresponding undifferentiated control. Therefore, each group has its own individual group of controls, thus making a t -test without correction acceptable.
Immunophenotypic Analysis
Immunophenotype was analyzed using a fluorescence activated cell sorter (FACS) Canto II (BD, Franklin Lakes, NJ, USA) with the following antibodies: mouse anti-human CD14-allophycocyanine (CD14-APC; clone M5E2), CD29-phycoerythrin (CD29-PE; clone MAR4), CD31-PE (clone WM59), CD34-APC (clone 8G12), CD45-APC (clone HI30), CD73-PE (clone AD2), CD90-APC (clone 5E10) (all from BD) and CD105-fluorescein isothiocyanate (CD105-FITC; cloneMAR-226; ImmunoTools, Friesoythe, Germany). Cells were harvested and stained for 30 min at 4°C with the antibodies in a dilution of 1:200. Data were analyzed with FlowJo software (TreeStar, Ashland, OR, USA).
Senescence-Associated β-Galactosidase Staining
Expression of pH-dependent senescence-associated β-galactosidase (SA-β-gal) activity was analyzed simultaneously in different passages of MSCs using the SA-β-gal staining kit (Cell Signaling Technology, Boston, MA, USA) (16). Alternatively, we have used a fluorescence-based method for more quantitative and sensitive analysis by flow cytometry as described previously (14). In brief, bafilomycin A1 (Sigma, St. Louis, MO, USA) prevents lysosomal acidification and subsequently 5-dodecanoylaminofluorescein di-β-D-galactopyranoside (C12FDG, Invitrogen, Eugene, OR, USA) was used as fluorogenic substrate for β-galactosidase.
Cellular Automaton
Cellular automatons can be used to simulate population dynamics of cell cultures based on processes at the single cell level (26,46). The virtual culture dish is represented by a two-dimensional square grid, where cells are situated at discrete positions. We assume that cells can only undergo a limited number of cell divisions until they reach the “Hayflick limit” (e.g., 50 cell divisions) and become senescent. Initially, a predefined number of cells is placed at random positions on the grid. Subsequently, each cell is checked in random order, if it is able to divide; then upon division the counter of performed divisions is increased by one, and a daughter cell is placed randomly at one of the empty spaces next to the mother cell. If cell growth does not exceed a predefined limit of confluency (5% for seeding densities with 10 cells/cm2 and 50% for seeding densities with 10,000 cells/cm2) and if cells exist that are still able to divide, the automaton proceeds with the next cycle of cell divisions. Otherwise a predefined number of the existing cells (10 or 10,000 cells/cm2) is randomly selected and placed at random positions on a new empty grid. In some experiments, we have also considered migration of cells prior to cell division. The cellular automaton has been implemented in C++ and complied with the GNU compiler collection (gcc) Version 4.0.1 for Mac OS. A more detailed description of the cellular automaton and a scheme are provided as supplemental online material under http://www.ukaachen.de/content/page/15109964. This web page also demonstrates two movies that simulate culture expansion with different seeding densities (10,000 and 10 cells/cm2).
Statistical Analysis
All results are expressed as mean ± SD. To estimate the probability of differences we have adopted the Student's t-test.
Results
Isolation of MSC with Human Platelet Lysate
MSCs from human adipose tissue were simultaneously isolated in culture medium supplemented with either 10% FCS or 10% HPL. The frequency of CFU-F cells in primary cells from adipose tissue was similar in FCS (0.0106 ± 0.0078%) and HPL (0.0106 ± 0.0074%; n = 8; paired t-test: p = 0.81). Morphology of initial CFU-F was heterogeneous and comprised colonies with tighter growth pattern or more migratory activity as previously described for bone marrow-derived MSCs (12, 23,24). Throughout culture expansion, the cells were larger in FCS than in HPL as previously described by other authors (6) (Fig. 1A). Proliferation increased in a dose-dependent manner for FCS and HPL (1%, 2.5%, 5%, 10%, and 20% serum supplement), and it was significantly higher in HPL than in FCS (p = 0.002 for 10% serum supplement) (Fig. 1B). All cell preparations could be differentiated towards adipogenic and osteogenic lineage as demonstrated by staining of fat droplets with Oil Red or staining of calcified extracellular matrix with Alizarin Red (Fig. 1C, D). Adipogenic differentiation for 7, 14, or 21 days resulted in upregulation of FABP4, ADIPOQ, and PPARγ, whereas the osteogenic transcription factor RUNX2 was upregulated after osteogenic differentiation (Fig. 1E). Various other markers including type I collagen might alternatively be used to monitor osteogenic differentiation. Long-term culture induced similar changes in morphology as well as expression of SA-β-gal (Fig. 1F) (16,44). Flow cytometric analysis of SA-β-gal was performed with the fluorogenic substrate C12FDG to analyze the fraction of senescent cells at different culture stages (Fig. 1G) (14). SA-β-gal-positive cells were predominantly observed in very late passages and, hence, this method does not appear to be suitable to monitor the process of cellular aging (41,44). The immunophenotype was always CD14-, CD29+, CD31-, CD34+/-, CD45-, CD73+, CD90+, CD105+. Some MSC preparations revealed low expression of CD34 and this has been described for adipose tissue-derived MSCs previously (15,34) (Fig. 2). Taken together, MSCs under both culture conditions fulfilled the minimal criteria for definition of MSCs (17,42), although addition of HPL facilitated faster proliferation than FCS.

Isolation of mesenchymal stem cells (MSCs) from adipose tissue with human platelet lysate. MSCs were simultaneously isolated with 10% fetal calf serum (FCS) or 10% human platelet lysate (HPL) and expanded at plating densities of 10 or 10,000 cells/cm2 (10,000 cells/cm2 depicted here). Overall, addition of HPL resulted in smaller cells (A). Proliferation increased in a concentration-dependent manner with FCS and HPL as determined by thiazolyl blue tetrazolium bromide (MTT) assay after 7 days, but was significantly higher with HPL (B). Adipogenic (C, Oil Red staining) and osteogenic differentiation potential (D, Alizarin Red staining) was not affected by these serum supplements. Differentiation was also validated on gene expression level for adipogenic [fatty acid binding protein 4 (FABP4), adiponectin (ADIPOQ), and peroxisome proliferator-activated receptor y (PPARγ)] and osteogenic markers [runt related transcription factor 2 (RUNX2)] after 7, 14, and 21 days by comparison with undifferentiated controls (E). Senescent cells acquired a larger morphology and stained positive for senescence-associated β-galactosidase (SA-β-gal) (F). For quantitative analysis at different culture stages we used the fluorogenic substrate C12FDG (fludeoxyglucose). A high percentage of SA-β-gal-positive cells was only observed at very late passages (G, autofluorescence is indicated in gray). Plating density was always 10,000 cells/cm2. Scale bars: 100 μm. *p < 0.05, **p < 0.01, ***p < 0.001 compared to corresponding control.

Immunophenotypic analysis of mesenchymal stromal cells (MSCs). MSCs were isolated from adipose tissue with FCS or HPL and culture expanded at a plating density of 10,000 cells/cm2. Cells were analyzed at early passage (P2) and at the senescent passage upon proliferation arrest (in this donor sample P13 and P20 for FCS and HPL, respectively). The immunophenotype was very similar in early and senescent passages and with FCS or HPL (representative histograms of three are demonstrated).
Serum Supplements Affect Long-Term Culture of MSCs
MSCs were subsequently long-term expanded until they reached senescence and stopped proliferation. Passaging was always performed at 50% confluent growth and cells were reseeded at 10,000 cells/cm2. The senescent state was defined by proliferation arrest when cell numbers did not increase any more, but rather decreased due to cell loss in passaging. Adipogenic differentiation potential decreased upon long-term culture and this was observed with FCS and HPL. For osteogenic differentiation, only a moderate decay was observed at higher passages. If MSCs were cultured with 10% FCS, they reached senescence after 179 ± 19 days and performed 22 ± 4 PD during this time. Interestingly, MSCs expanded with 10% HPL stopped expansion after a significantly shorter period of 94.8 ±21.7 days (p = 0.0002), whereas they reached much higher numbers of PD (43 ± 4; p = 4.1 × 10⁻⁵) (Fig. 3A, B). Thus, addition of HPL facilitates more efficient expansion to higher cell numbers than FCS.

Long-term expansion of MSCs with FCS and HPL. MSCs of five donor samples were simultaneously expanded at plating densities of 10 or 10,000 cells/cm2 in culture media supplemented with 10% FCS (A) or 10% HPL (B) until they stopped proliferation.
Effects of Plating Density on Culture Expansion of MSCs
Long-term culture of MSCs might be affected by plating density and passaging. To test this thesis, MSCs were simultaneously isolated and expanded at a low plating density of 10 cells/cm2. This facilitated longer intervals between passages until the colonies became very large and covered about 5% of the cell culture surface. Adipogenic or osteogenic differentiation potential was not affected by lower plating density and the MSCs revealed the same immunophenotype (data not shown). However, the cells could hardly be expanded after the first passage in culture medium supplemented with 10% FCS. The progeny of 10 cells/cm2 could therefore not be determined reliably after the first passage. In contrast, the addition of 10% HPL facilitated repeated passaging for 66 ± 17 days and they reached 40 ± 13 PD. Thus, lower seeding densities slightly reduced the time until MSCs reached a senescent state, whereas there are no significant differences between plating densities of 10 and 10,000 cells/cm2 with regard to the maximal number of PD (p = 0.05 and p = 0.61, respectively).
Modeling of Effects in Long-Term Culture of MSCs with a Cellular Automaton
Population dynamics in cell culture are complex and the number of cumulative PD does not necessarily correspond to cell divisions of each individual cell. In every passage there is contact inhibition within MSC preparations and proliferation occurs predominantly at the merge of colonies (46). This contact inhibition can be partially avoided by migratory activity of MSC on tissue culture plastic. We conceived a cellular automaton model to address the role of seeding density, cell size, proliferation rate, migration, and “Hayflick limit” on population dynamics and heterogeneity (Fig. 4A). A virtual culture well of 1 cm2 was used to simulate long-term growth curves by the following parameters: cell size of 20 × 20 μm, proliferation rate 1/day, no migratory activity, and a maximum of 50 PD per cell. At seeding densities of 10,000 cells/cm2 and passaging at 50% confluency, there is relatively little heterogeneity in the number of cell divisions within a cell preparation and proliferation decays after about 15 passages (Fig. 4B, C). The simulated growth curves are in a similar range as those observed for MSCs cultured in HPL. Parameters like plating densities of 10 cells/cm2 and harvesting at 5% confluence result in much larger colonies, less passages, and a higher heterogeneity with regard to cellular aging (Fig. 4D, E). The reduced maximal number of about 5 passages corresponds to the experimental data. Repetitions of the simulation demonstrate that low plating densities should decelerate culture expansion due to more contact inhibition and might even impair the number of cumulative PD. In analogy to experimental data, the variation between iterations increases (Fig. 4F). MSCs are larger in FCS and long-term expansion might be influenced by cell size. The cellular automaton model illustrates that larger cells (e.g., 40 × 40 μm) reach confluence in shorter time periods. Therefore, they need to be passaged more frequently, which keeps them in logarithmic growth phase with less contact inhibition (Fig. 4G). To further adopt the simulations to growth conditions with FCS, we reduced the parameter of proliferation rate to about once every 3 days and a “Hayflick limit” of about 25 cell divisions (Fig. 4H). With these parameters the simulated long-term growth curves were in a similar range as the described experimental data above.

Modeling of population dynamics with a cellular automaton. The cellular automaton model is based on a virtual culture dish that is represented by a two-dimensional square grid, where cells are situated at discrete positions. Cells can only divide if at least one neighboring square is free; otherwise they remain contact inhibited (e.g., within colonies) (A). We initially assumed a cell size of 20 × 20 μm, a proliferation rate of 1/days, no migration, and a maximum of 50 divisions per cell. If these cells were seeded at 10,000 cells/cm2 and passaged at 50% confluent growth, the variation in the number of performed cell divisions at a given time point was relatively low (B) and long-term growth curves corresponded roughly to the experimental data (C). In contrast, seeding density of 10 cells/cm2 and passaging at 5% confluent growth resulted in higher heterogeneity of cellular aging (D) and retarded growth curves (E). Iterations for long-term growth curves were simulated under parameters as indicated (F–H): lower plating densities reveal a larger variation due to stochastic effects. Larger cells would reach a confluent level faster and therefore growth curves would reveal a sharper increase with less variation. For MSCs in FCS we have estimated a lower proliferation rate (once every 3 days) and a “Hayflick limit” of 25 PD to adopt the simulations to our experimental data.
Low Plating Density and Less Passaging Favor Migratory Subpopulations
MSCs are heterogeneous and may include subpopulations with different migratory activity. This becomes evident in the primary CFU-F at the very first passage: colonies often represent either a tight or a disperse growth pattern (Fig. 5A, B). In theory, migratory active subpopulations are less prone to contact inhibition and therefore expand faster than nonmigratory subpopulations in simulations with the cellular automaton model (Fig. 5C). This might also explain why plating density did not have a significant effect on long-term growth curves of MSCs. Under the assumption of a 50%:50% mixture of nonmigratory and migratory cells, the latter will quickly outgrow the nonmigratory cells (Fig. 5D, E). Preferential expansion of migratory cells is further increased at lower seeding densities with higher intervals of passaging. This exemplifies that methods in cell passaging can favor expansion of specific subpopulations within cell preparations such as migratory active subsets.
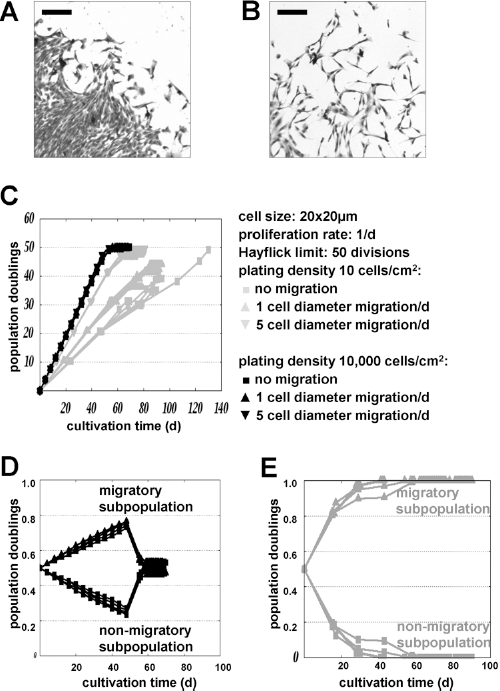
Longer intervals between passaging select for migratory subpopulations. MSCs are composed of subsets with different migratory activity. This is reflected by differences in initial colony morphology as demonstrated by crystal violet staining after 10 days (A, B; scale bar: 200 μm). We have used the cellular automaton model to simulate population dynamics with different migratory activity and parameters were assumed as indicated. Long-term growth curves were hardly affected by migratory activity at high plating densities, whereas the slope of expansion increased for migratory cells at low plating densities (C). Subsequently, we have modeled a mixed population of 50% nonmigratory cells and 50% migratory cells (migration of 5 cell diameters per day). Migratory cells overgrow the nonmigratory cells until they reach a senescent state (D; plating densities: 10,000 cells/cm2). This discrepancy becomes even larger at lower plating densities of 10 cells/cm2 where nonmigratory cells are eventually diluted out (E).
Different Stages of Senescence Hardly Affect Long-Term Growth Curves
We have subsequently addressed the question how long-term growth curves would be affected by a mixture of senescent and nonsenescent cells. For example, we have used the cellular automaton model with a mixed starting population of: 20% cells that can perform 50, 20% with 40 PD, 20% with 30 PD, 20% with 20 PD, and 20% of presenescent cells that can only perform 10 cell divisions. Even under these assumptions the theoretical maximum of cumulative population doublings would be close to 50 PD: log2[(210 + 220 + 230 + 240 + 250)/5] = 47.7 PD.
If we assume that generation times and other cell properties of nonsenescent cells do not change with the number of performed divisions, heterogeneity with regard to cellular aging had only very little impact on simulated long-term growth curves (data not shown). Hence, it is conceivable that samples (e.g., from elderly donors) contain a relevant percentage of senescent and presenescent cells with little effect on long-term growth curves.
Discussion
The use of HPL avoids the risk of xenogenic immunoreactions or transmission of bovine pathogens and is also more efficient than FCS for large-scale expansion of MSCs from adipose tissue. HPL significantly increased the proliferation rate and maximal number of cumulative PD of adipose tissue-derived MSCs. In contrast, MSCs from bone marrow revealed only a moderate increase in proliferation and cumulative PD with HPL instead of FCS (23) and this may be due to tissue-specific differences in stem and progenitor cells. In theory, this effect might be due to higher apoptosis rates with FCS or less efficient colony outgrowth, but these effects were not observed in our experiments (e.g., similar numbers of CFU-F in HPL and FCS). A more apparent explanation is that culture media directly influence cellular aging and that the “Hayflick limit” is not exclusively predetermined cell intrinsically.
There is a growing perception that culture expansion needs to be taken into account for therapeutic application of MSCs (19,32,43). We have recently demonstrated that replicative senescence induces reproducible gene expression changes in MSCs (41). Furthermore, long-term culture induced DNA methylation changes at specific CpG sites in developmental genes (8). The data of this study indicate that replicative senescence can be influenced by culture conditions such as serum supplements. Therefore, this phenomenon is not solely due to successive loss of telomere length, but it might resemble a developmental process regulated by specific epigenetic modifications. The precise mechanisms are yet unclear and further research will be necessary to discern relevant chemical compounds that play a role in the regulation of cellular aging.
Many studies have addressed the question of how the initial plating density affects MSC preparations (11,37). Our results did not reveal significant differences in immunophenotype, differentiation potential, and long-term growth curves in cells seeded at either 10 or 10,000 cells/cm2. It is certainly advantageous to have fewer culture steps for cell processing under standardized conditions. Bartmann and coworkers have demonstrated that low plating densities facilitate expansion of at least 1.5 × 10⁸ MSCs with only two passaging steps (4). On the other hand, more frequent passaging might keep the culture at a more homogeneous state throughout expansion. Our theoretical model demonstrates that plating density and passaging may indeed influence the composition of cell preparations and, therefore, these parameters need to be taken into account for the design of clinical trials.
The computer simulations in this study provide further insight into how population dynamics are affected by parameters such as cell size, proliferation rate, plating density, colony size, or migration. We have established a simple cellular automaton model that accounts for these biological parameters. Correlation with the experimental data depends on the choice of numeric values and more complex model systems are conceivable that include integration of different proliferation rates between subpopulations or upon culture expansion. Furthermore, the automaton does not take into account cell size changes upon cellular aging. Despite these simplifications, the results helped for a better understanding of the parameters discussed below.
Colony size has a major impact on population dynamics. Usually, low plating densities are associated with longer intervals between passages and, in theory, this reduces the slope of the growth curve. However, expansion of MSCs in HPL resulted in similar long-term growth curves at 10 and 10,000 cells/cm2 and, in tendency, cells at lower seeding densities reached senescence even within less days of culture. This might be due to migratory activity, reducing intercellular contact inhibition. Furthermore, the effect might be attenuated by the fact that a certain percentage of cells is lost during washing steps or becomes apoptotic due to the stress at every passage. On the other hand, there was a higher variation between long-term growth curves observed at 10 cells/cm2. This is in line with simulations by the cellular automaton model due to stochastic effects that arise by few cells per square centimeter in a small culture dish; for large-scale expansion on very large surface areas this would not be relevant.
So far, it is not possible to prospectively isolate a homogeneous fraction of MSCs (20). The heterogeneity of subfractions is reflected by the different growth patterns of initial CFU-Fs (12). Some of these colonies reveal a rather tight growth pattern, whereas others reveal migratory activity (24). Migratory cells spread over larger areas with less contact inhibition. The cellular automaton model demonstrated that especially low plating densities (i.e., higher intervals between passages) select for migratory active subpopulations and that nonmigratory cells are eventually diluted out. Thus, computer simulations demonstrate that cell culture techniques such as plating density and passaging may affect the composition of the resulting cell population.
It has often been speculated if replicative senescence plays a role for aging of the whole organism. Mathematic modeling indicated that a limit in PD is compatible with the remarkable regeneration of the hematopoietic system throughout life (29). In analogy, MSCs from elderly donors might contain a relevant percentage of presenescent cells. Indeed, other authors revealed lower proliferation of MSCs from elderly donors, decreased osteogenic differentiation, reduced CFU-F potential, more apoptosis, and more SA-β-gal-positive cells (45). Furthermore, an inverse relationship between donor age and the replicative life span in vitro has been shown for fibroblasts and MSCs (36,39). However, this effect is usually relatively small with a high variation between different donor samples (7,13) and therefore it could not be addressed in the five donor samples of this study. Our cellular automaton demonstrated that progressions of long-term growth curves are minimally affected by senescent subpopulations under the assumption that at least some cells maintain their full range of population doublings. This might explain why effects of donor age on long-term culture of MSCs are only moderate in the above-mentioned studies.
In conclusion, HPL is an efficient replacement for FCS without the risk of xenogenic infections or immunological reactions against bovine proteins (27). Proliferation of MSCs was even higher in HPL and facilitated expansion for more PD. Therefore, cellular aging seems to be directly influenced by serum supplements. Replicative senescence does not occur synchronously in culture. The aging process is affected by cell culture methods such as plating density and passaging intervals, which may select for specific subpopulations such as migratory active subsets. Computational simulations provided insights into the complex population dynamics during cellular aging and this approach may help for a more reliable and standardized culture expansion of cellular therapeutics.
Footnotes
Acknowledgments
The authors would like to thank Prof. Anthony Ho and Prof. Willi Jäger for mentoring the WIN Kolleg Project. We want to thank Andrea Fritz for excellent technical assistance in isolation of MSCs and Dr. Nilou Arden for revision of this manuscript. This work was supported by the German Ministry of Education and Research (CB-HERMES), the Academy of Sciences and Humanities, Heidelberg (WIN-Kolleg), the excellence initiative of the German federal and state governments (Pathfinder), and the Stem Cell Network North Rhine-Westphalia. The authors declare no conflicts of interest.