
Abstract
Allograft rejection is a leading cause for the failure of allotransplantation. CD4+ T cells play critical roles in this process. The identification of genes that alternatively expressed in CD4+ T cells during allograft rejection will provide critical information for studying the mechanism of allograft rejection, finding specific gene markers for monitoring, predicting allograft rejection, and opening new ways to regulate and prevent allograft rejection. Here, we established allograft and isograft transplantation models by adoptively transferring wild-type BALB/c mouse CD4+ T cells into severe combined immunodeficient (SCID) mice with a C57BL/6 or BALB/c mouse skin graft. Using the whole transcriptome sequencing-based serial analysis of gene expression (SAGE) technology, we identified 97 increasingly and 88 decreasingly expressed genes that may play important roles in allograft rejection and tolerance. Functional classification of these genes shows that apoptosis, transcription regulation, cell growth and maintenance, and signal transduction are among the frequently changed functional groups. This study provides a genome-wide view for the candidate genes of CD4+ T cells related to allotransplantation, and this report is a good resource for further microarray studies and for identifying the specific markers that are associated with clinical organ transplantations.
Keywords
Introduction
Allotransplantation is the transplantation of cells, tissues, or organs, sourced from a genetically nonidentical member of the same species as the recipient, which is now an everyday clinical reality. However, the fate of allotransplanted organ is largely determined by the major histocompatibility complex (MHC) matching, immunosuppressive drugs, and technical skill because of the adaptive immune response to the alloantigens on the graft, which are proteins that vary from individual to individual within a species. Determining the molecular basis of allograft rejection will provide critical information for understanding, monitoring, predicting, and intervening allograft rejection. An approach to molecularly determine the cause of allograft rejections is to identify specific genes that are involved in the rejections. In recent years, gene expression profiling has been increasingly used in organ transplantation studies, including liver, heart, pancreas, kidney, and lung transplantations, by cDNA microarray or real-time RT-PCR (5,6,11,20, 24,37,42–44,70). While studies have identified allograft rejection-related genes involved in apoptosis, cytokines, cytotoxic molecule, and cell adhesion (12,55,58), it is not clear how many genes are involved in allograft rejection at the genome level.
It is known that CD4+ T cells in an allotransplant recipient play critical roles in allograft rejection (35). By recognizing MHC class II in the donor's antigen presenting cells and antigenic peptide presented to MHC class II of the recipient's antigen presenting cells, CD4+ T cells can develop into cytolytic T cells to destruct the allograft (32), and can also mediate delayed-type hyper-sensitivity responses via producing soluble mediators that activate and guide other immune cells to reject the allograft (54). Studies also show that CD4+ T cells are necessary and sufficient to induce allograft rejection in the absence of other types of lymphocytes, and the depletion of peripheral CD4+ T cells can prolong the survival of allograft (4,18, 21,38,68). However, the molecular basis of CD4+ T-cell-mediated allograft rejection remains unclear.
Using a CD4+ T-cell-mediated skin allograft rejection mouse model, we performed a gene expression profiling study on CD4+ T cells with the serial analysis of gene expression (SAGE) method, which is both a qualitative and quantitative high-throughput technology for the analysis of known and unknown transcripts. Hundreds of genes with significantly altered expression levels in the CD4+ T cells were identified and then categorized based on their functions. We present the results of this study in this report.
Materials and Methods
Generation of Skin Allograft Rejection Mouse Model
Female mice, 6–10 weeks old, were used for the study. BALB/c mice (H-2d) were purchased from the Shandong University animal facility of (Jinan, China). C57BL/6 mice (H-2b, B6) and severe combined immunodeficient (SCID) mice were purchased from Vitalriveri Inc. (Beijing, China). Mice were maintained in a pathogen-free animal environment during the experimental process. The use of mice for this study was approved by the Institutional Animal Experimental Committee, and animal care and surgical procedures were performed in compliance with the standard animal experimental protocols of Shandong University School of Medicine. Skin allograft rejections were generated by following an established procedure (28). Briefly, the dorsal skin of C57BL/6 mice was transplanted onto the dorsal thorax of SCID mice under sterile conditions (allotransplantation). The dorsal skin of BALB/c mice was transplanted onto the SCID mice as the control syngenetic graft (isotransplantation). Twenty-one days after the transplantations, CD4+ T cells were harvested from the spleens of wild-type naive BALB/c mice using the mouse CD4+ T-cell enrichment columns (R&D Systems, Inc.) with a purity of >90% as measured by flow cytometry (data not shown). Purified CD4+ T cells (8 × 10⁶ cells) were adoptively injected into the tail vein of each transplanted mouse. The skin graft was then monitored daily. The graft was considered to be rejected when more than 50% became necrosis.
SAGE Analysis
The allotransplant skin was typically rejected 14 days after CD4+ T-cell adoptive transfer. CD4+ T cells were isolated and pooled from the spleens of five mice in allotransplantation or isotransplantation groups using the same process that was described above. Total RNA was extracted from the purified cells by using Trizol reagent (Invitrogen), and mRNA was purified from 20 μg of total RNA using oligo(dT) beads (Invitrogen). cDNA was synthesized by using MMLV reverse transcriptase and oligo(dT) primers (MBI). SAGE libraries from the allotransplantation or isotransplantation groups were constructed following the standard procedure (65), and sequenced with an ABI 3730 DNA sequencer (Applied BioSystems). SAGE tag sequences were extracted using the SAGE2000 software (Invitrogen). Tag-to-gene mappings were performed by matching the SAGE tags to the “SAGEmap reliable” database (ftp://ftp.ncbi.nlm.nih.gov/pub/sage/map/mm, published on August 7, 2007). Functional descriptions of the mouse genes were based on the Mouse Gene Sorter from the UCSC Genome Bioinformatics Group (http://genome.ucsc.edu/). The Identification of Differentially Expressed Genes program (IDEG6) (http://telethon.bio.unipd.it/bioinfo/IDEG6) (57) was used for statistical comparison for the SAGE tags between allotransplantation library and isotransplantation library. SAGE tags were determined to be differentially expressed between the two libraries if p < 0.05 and fold change ≥ 3. The Expression Analysis Systematic Explorer Program (EASE) version 2.0 (http://david.abcc.ncifcrf.gov/ease/ease.jsp) (27) was used for functional classification of genes that were identified from the SAGE tags. Other CD4+ T-cell SAGE libraries are provided by the Mouse SAGE Site (http://mouse.img.cas.cz/sage/).
Generation of Longer cDNA Fragments From SAGE Tags for Gene Identification (GLGI)
The specific genes of the SAGE tags were identified by following the standard procedure of the GLGI method (9). Briefly, a SAGE tag was used as the sense primer, a primer tailed to oligo(dT) sequences was used as the antisense primer, and the original cDNA sample used for SAGE tag collection was used as the PCR template to amplify the 3′ cDNA fragments. The PCR products were cloned into the TOPO TA coloning vector (Fermentas) and sequenced. The gene origins were then determined by mapping sequences to GenBank using BLAST.
Real-Time RT-PCR
Real-time RT-PCR was performed using the C1000 Thermal Cycler (#185-1096EDU, BIO-RAD) and SYBR-Green kit (Takara). RNA was extracted from the same rejection models that were used for the construction of the SAGE libraries. Primer sequences were provided by PrimerBank (http://pga.mgh.harvard.edu/primerbank/) (Supplementary Table 1, available from http://www.isotope.sdu.edu.cn/supplementarytables.htm). The ΔΔCT method of relative quantification was used to determine the fold changes in expression levels. The expression level of glyceraldehyde-3-phosphate dehydrogenase (GAPDH) was used as the internal control for normalizations.
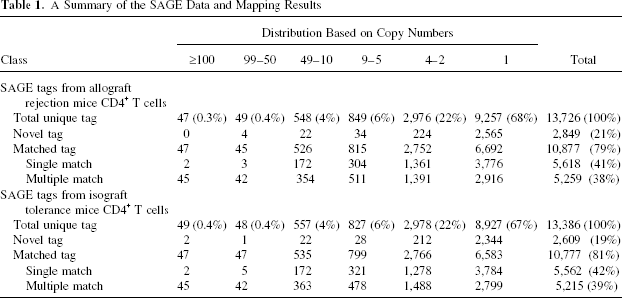
A Summary of the SAGE Data and Mapping Results
Results
Generation of CD4+ T-Cell Adoptive Transfer Induced SCID Mouse Skin Acute Allograft Rejection Model
SCID mice are a strain of mice that have severe immunodeficiency genetic disorder that is characterized by the complete inability of the adaptive immune system, usually due to absent or atypical T and B lymphocytes. In this model, the skin from C57BL/6 mice was allotransplanted and the skin from BALB/c mice was isotransplanted onto SCID mice. To induce acute skin allograft rejections, naive CD4+ T cells from wild-type BALB/c mice were then adoptively transferred to the SCID mice after the transplant wound healed (21 days after transplantation) (28). Fourteen days after the adoptive transfer of the CD4+ T cells, the skin grafts of the allotransplanted mice had been rejected whereas the skin grafts of the isotransplanted mice remained normal (Fig. 1). The CD4+ T cells from the spleens of five mice in each group were then isolated and used for the SAGE study.

Rejection of allotransplanted skin. The allotransplanted skin was rejected 14 days after the adoptive transfer of CD4+ T cells, whereas the isotransplanted skin remained unrejected. (A) Allotransplantation. (A-0) Before the adoptive transfer of CD4+ T cells; (A-14) 14 days after the adoptive transfer of CD4+ T cells. (B) Isotransplantation. (B-0) Before the adoptive transfer of CD4+ T cells; (B-14) 14 days after the adoptive transfer of CD4+ T cells.
Constructions of the Allotransplantation and Isotransplantation CD4+ T-Cell SAGE Libraries
In present study, we collected a total of 51,808 SAGE tags from allograft activated CD4+ T cells and 51,644 SAGE tags from isograft group CD4+ T cells. This coverage ensures the detection of transcripts in a very low abundance. These tags represented 13,726 and 13,386 different transcripts correspondingly, and ranged in expression levels from 1 to 3,734 copies. The collected SAGE data have been deposited to NCBI GEO database with accession number GSE14540. An analysis of the tag-based expression levels showed that 67% of the transcripts were expressed as a single copy, 32% of the transcripts were present from 2 to 49 copies, and less than 1% of the transcripts were present in more than 50 copies. Gene mapping analyses showed that 80% of the SAGE tags were originated from known genes or Expressed Sequence Tags (ESTs) whereas the remaining 20% were novel (Table 1, Supplementary Table 2, available from http://www.isotope.sdu.edu.cn/supplementarytables.htm).
The Distribution of the 402 Significant SAGE Tags

Identification of Differentially Expressed Genes in the CD4+ T Cells From the Allograft Rejection Mouse Models
Statistical analysis identified 402 SAGE tags (all <50 copies, Supplementary Table 3, available from http://www.isotope.sdu.edu.cn/supplementarytables.htm) that were significantly different (p < 0.05, fold change ≥ 3) between the two libraries, including the SAGE tags only expressed (81 tags) or increasingly expressed (129 tags) in the allotransplantation CD4+ T-cell SAGE library, and the SAGE tags only expressed (74 tags) and increasingly expressed (118 tags) in the isotransplantation CD4+ T-cell SAGE library. By matching these 402 differentially expressed tags to NCBI SAGEmap reliable database, 173 tags matched uniquely to specific genes, 206 tags matched to multiple genes, and 23 tags had no matches (Table 2, Supplementary Table 3, available from http://www.isotope.sdu.edu.cn/supplementarytables.htm).
Genes That Were Upregulated (97) in the Allo-SAGE Library From the Differentially Expressed Genes (185) in the CD4+ T Cells From Skin Allograft Rejection Mice
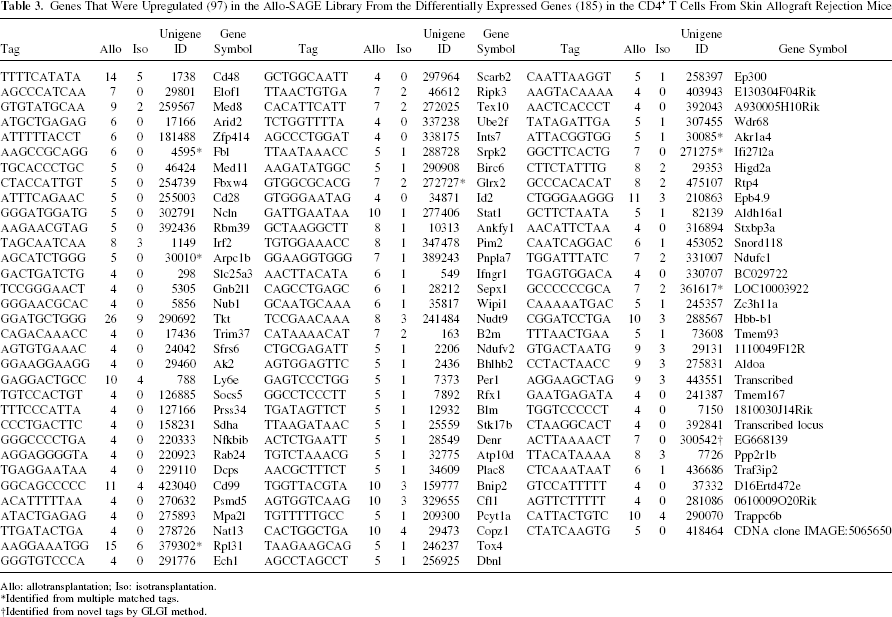
Allo: allotransplantation; Iso: isotransplantation.
Identified from multiple matched tags.
Identified from novel tags by GLGI method.
In order to validate the creditability of our SAGE result, we successfully converted 17 SAGE tags into longer 3′ EST by using GLGI technology with the original cDNA samples that were used for the SAGE tag collection. Of these, 5 single-matched SAGE tags were confirmed as the same gene from the SAGEmap analysis, specific gene for 10 multiple-matched tags, and 2 novel tags were also determined (Supplementary Table 4, available from http://www.isotope.sdu.edu.cn/supplementarytables.htm). As the findings of this study, we present these 12 GLGI identified multiple and novel tags with 173 single matched tags together in Tables 3 and 4, which stand for the identified differential expressed genes in CD4+ T cells between allotransplantation and isotransplantation.
Genes That Were Downregulated (88) in the Allo-SAGE Library From the Differentially Expressed Genes (185) in the CD4+ T Cells From Skin Allograft Rejection Mice
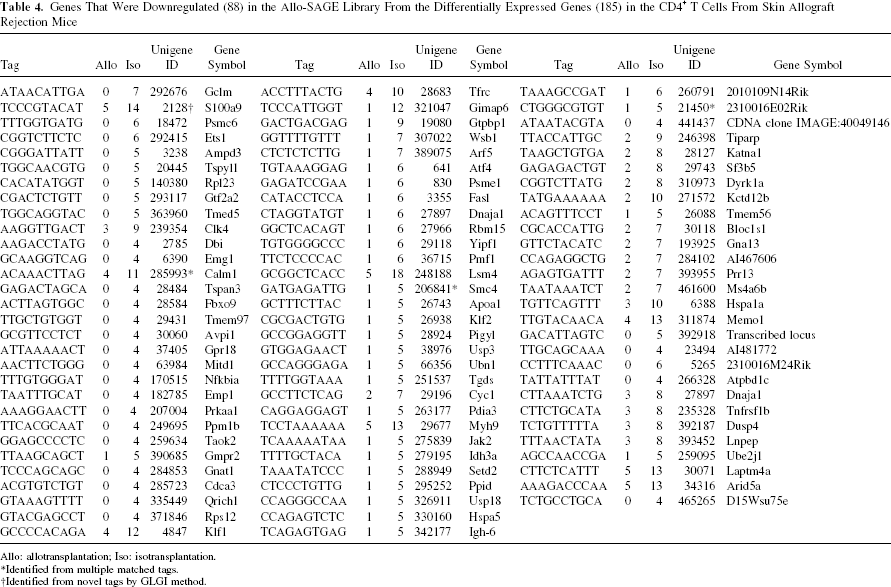
Allo: allotransplantation; Iso: isotransplantation.
Identified from multiple matched tags.
Identified from novel tags by GLGI method.
In order to estimate the abundance of the differentially expressed transcripts, quantitative differences of five selected genes from the differentially expressed tags, including three tags that were upregulated and two tags that were downregulated in the allotransplantation CD4+ T-cell SAGE library, were confirmed by real-time RT-PCR. RNA was extracted from the same mouse models that were used for the SAGE library constructions. The results indicated that these five transcripts were differentially expressed, and their expression patterns were the same as the SAGE results (Fig. 2). However, real-time RT-PCR results shows limited sensitivity for detecting decreasingly expressed low-abundance transcripts than increasingly expressed low-abundance transcripts and three of them did not reach the significant differences.
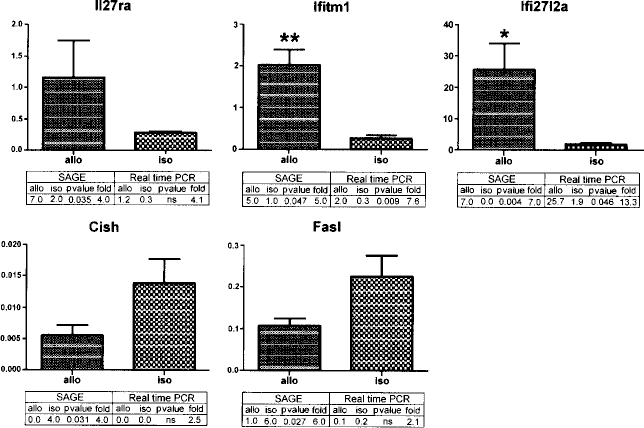
Real-time RT-PCR analysis of five genes from differentially expressed tags. Total RNAs were isolated from the same mouse models that were used for the SAGE library constructions, and five genes (Il27ra, Ifitm1, Ifi27l2a, Cish, and Fasl) that were differentially expressed between the allograft- and isograft-induced CD4+ T cells were tested. The ΔΔCT method of relative quantification was used to determine the fold change in expression levels. The results represent three separate experiments. The comparisons of the SAGE and real-time RT-PCR results for each gene are listed under the bar. Allo: allotransplantation; iso: isotransplantation.
Functional Gene Clustering Analysis of the Differentially Expressed Genes Found in Allotransplantation CD4+ T-Cell SAGE Library
By mapping the 185 significant genes to eight other mouse CD4+ T-cell SAGE libraries, we analyzed their contribution to different CD4+ T-cell subsets (10,17,70). These CD4+ T-cell SAGE libraries are the Th1_R2.2 resting and activated libraries, the Th2_R2.4 resting and activated libraries, the CD4+CD25– T-cell resting and activated libraries, and the CD4+CD25+ T-cell resting and activated libraries. All the cells used for these eight SAGE libraries were cultured, stimulated, and activated in vitro. In all of the 10 CD4+ T-cell SAGE libraries, our allo- and isotransplantation libraries had the highest coverage, 13,726 and 13,386 unique tags, comparing with the others ranging from 5,491 to 12,990 unique tags (Table 5). Upon activation, transcripts corresponding to 97 unique tags were upregulated in our study. Of these 97 tags, 18 were upregulated in the Th1_R2.2 libraries, 29 were upregulated in the CD4+CD25– T-cell libraries, 24 were downregulated in the Th2_R2.4 libraries, and 15 were downregulated in the CD4+CD25+ T-cell libraries. On the contrary, 88 tags were downregulated in our allotransplantation CD4+ T-cell SAGE library. Correspondingly, 17 of them were downregulated in the Th1_R2.2 libraries, 14 were downregulated in the CD4+CD25– T-cell libraries, 19 were upregulated in the Th2_R2.4 libraries, and 10 were upregulated in the CD4+CD25+ T-cell libraries. In Table 6 we list as examples 20 tags that have the relative clear expression feature in different CD4+ T-cell subsets. As an example in this study, the tag “GAATGAGATA,” which represents transmembrane protein 167 (Tmem167), was overexpressed after activation by allograft and had no expression in the isograft group. Data from other libraries show that Tmem167 was upregulated after Th1 activation, but was downregulated after Th2 and CD4+CD25+ T-cell activation. Fas ligand (Fasl), known as an apoptosis-related gene, was found decreasingly expressed in our allotransplantation group and only found to be upregulated after Th2 activation in the other libraries. This may reflect that Fasl is specifically downregulated in Th1 upon activation, and mediates activation-induced cell death (AICD), which may play a more important role on Th2 than Th1 and CD4+CD25+ T cells.
A Summary of the Comparisons Between Different CD4+ T-Cell SAGE Libraries
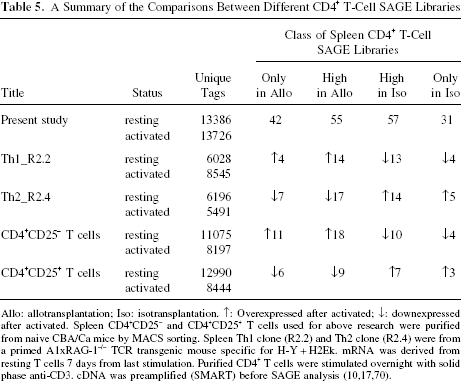
Allo: allotransplantation; Iso: isotransplantation. ↑: Overexpressed after activated; ↓: downexpressed after activated. Spleen CD4+CD25– and CD4+CD25+ T cells used for above research were purified from naive CBA/Ca mice by MACS sorting. Spleen Th1 clone (R2.2) and Th2 clone (R2.4) were from a primed A1xRAG-1–/– TCR transgenic mouse specific for H-Y + H2Ek. mRNA was derived from resting T cells 7 days from last stimulation. Purified CD4 T cells were stimulated overnight with solid phase anti-CD3. cDNA was preamplified (SMART) before SAGE analysis (10,17,70).
The Relative Expression Levels of Partially Alloactivated Significant Tags in Comparison to Other CD4+ T-Cell SAGE Libraries

Allo: allotransplantation; Iso: isotransplantation; R: resting; A: activated. Tag distribution in other SAGE libraries has been normalized(tags per million).
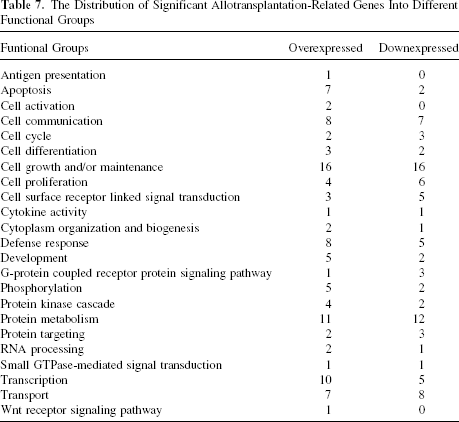
Using the EASE program mentioned in Materials and Methods, we performed functional gene clustering analysis of all 185 significant genes, but only 68 of them had the related functional information, including 37 increasingly expressed genes and 31 decreasingly expressed genes. We list their distribution in 23 functional clusters in Table 7. Among these functional groups, some mainly contain the increasingly expressed genes such as antigen presentation, apoptosis, cell activation, defense response, phosphorylation, and transcription; some include both increasingly and decreasingly expressed genes, such as the groups of cell growth and/or maintenance, protein metabolism, and transport. We also present the distribution of each significant gene in these 23 functional clusters by a two-dimensional heat map (Fig. 3). On this map, each row represents a single gene, and each column represents a functional cluster. We analyzed the genes in four main functional groups, which are detailed below.
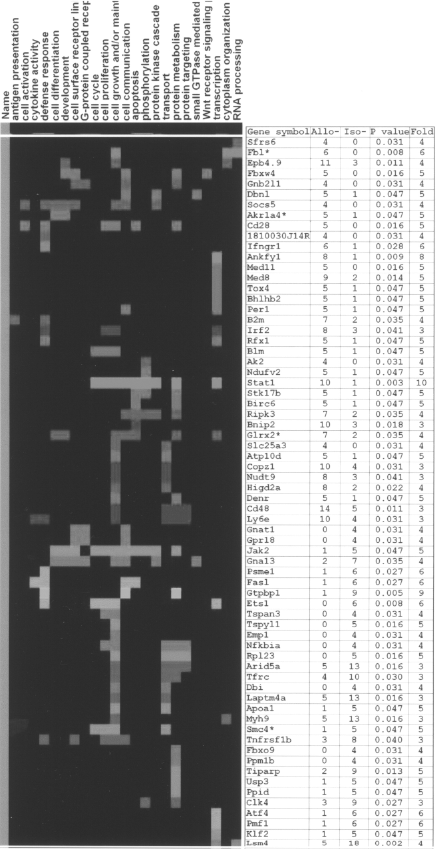
Functional gene clustering analysis of SAGE data. The functional distribution of 68 genes differentially expressed in allograft induced CD4+ T cells and the syngeneic isograft induced CD4+ T cells. Data are presented in a matrix format. Each row represents a single gene, and each column a functional cluster. The ratio of the abundance of each gene is represented by the signal intensity of the color in the corresponding row. Red squares: overexpressed; green squares: downexpressed. Gene-related SAGE information is listed on the right side. Genes with asterisks are genes identified by GLGI. Allo: allotransplantation group; iso: isotransplantation group.
The Distribution of Significant Allotransplantation-Related Genes Into Different Functional Groups
Genes Related with Apoptosis.
Seven genes related to apoptosis were increasingly expressed in the CD4+ T cells of allograft rejection mice. There are baculoviral IAP repeat-containing 6 (Birc6), BCL2/adenovirus E1B interacting protein 2 (Bnip2), CD28 antigen (Cd28), glutaredoxin 2 (Glrx2), receptor-interacting serine-threonine kinase 3 (Ripk3), signal transducer and activator of transcription 1 (Stat1), and serine/threonine kinase 17b (Stk17b). Birc6 (allotransplantation group/autotransplantation group = 5:1, p = 0.047) is a cell membrane-anchored protein that inhibits apoptosis by ubiquitinylation facilitating the degradation of Smac/Diablo and caspase-9 (2). Bnip2 (10:3, p = 0.018) is a Bcl-2- and E1B-associated protein. It protects cells from the death induced by viral infection and certain external stimuli (7). Cd28 (5:0, p = 0.016) augments the expression of the intrinsic survival factor Bcl-xL (60). Studies showed that both CD28/B7 and CD40L/CD40 costimulations are critical for allograft rejection and their blockade during transplantation decreases proliferation and increases apoptosis of alloreactive T cells (31,51,63). Glrx2 (7:2, p = 0.035) is an important redox regulator in mammalian organs. Overexpression of Glrx2 reduces myocardial cell death and protects cerebellar granule neurons from dopamine-induced apoptosis (47). The survival signal mediated by Glrx2 is stemmed from PI-3-kinase-Akt survival signaling pathway and involved in the activation of NF-κB and antiapoptotic protein Bcl-2 (47). Ripk3 (7:2, p = 0.035) mediates apoptosis induction and NF-κB activation (39). Stat1 (10:1, p = 0.003) deficient T cells cannot differentiate into Th1-type cells in vivo and fail to mediate rejection (41). Constitutive overexpression of Stat1 leads to the suppression of the cytotoxic response and renders the cells resistant to ionizing radiation (IR) and other inducers of cell death (30). Fasl and Janus kinase 2 (Jak2) are apoptosis-related genes that were decreasingly expressed in allotransplantation group. Fasl (1:6, p = 0.027) interacts with Fas and plays a major role in AICD of T cells. Jak2 (1:5, p = 0.047) is a tyrosine kinase responding to interferon-γ (IFN-γ) induction. It has been shown that caspase 3 activation and decreased B-cell CLL/lymphoma (Bcl2) expression induced by oxidative stress can be prevented by Jak2 inhibitor AG490 (48).
Genes for Transcription Regulation.
Fifteen genes related to transcription regulation were differentially expressed in the CD4+ T cells of allograft rejection mice. The increasingly expressed genes include FYVE domain containing 1 (Ankfy1), basic helix–loop–helix domain containing, class B, 2 (Bhlhb2), Glrx2, interferon regulatory factor 2 (Irf2), mediator of RNA polymerase II transcription, subunit 8 homolog (yeast) (Med8), mediator complex subunit 11 (Med11), period homolog 1 (Per1), regulatory factor X, 1 (Rfx1), Stat1, and TOX high mobility group box family member 4 (Tox4). Bhlhb2/Stra13 (5:1, p = 0.047) is upregulated upon activation of CD4+ T cells and plays a role in regulating immune cell homeostasis and autoimmunity (62). Stra13 deficiency results in ineffective elimination of activated T and B cells, which leads to lymphoid organ hyperplasia (62). Irf2 (8:3, p = 0.041) is a IL-4 repressor that helps IFN-γ to attenuate Th2 response (13). Rfx1 (5:1, p = 0.047) is associated with MHC class II deficiency (1). The decreasingly expressed genes include activating transcription factor 4 (Atf4), E26 avian leukemia oncogene 1, 5′ domain (Ets1), Krupple-like factor 2 (Klf2), LSM4 homolog, U6 small nuclear RNA associated (S. cerevisiae) (Lsm4), and polyamine-modulated factor 1 (Pmf1). Ets1 (0:6, p = 0.008) is preferentially expressed in resting T cells (19). Klf2 (1:5, p = 0.047) represses naive T cells to express several chemokine receptors, including C-C chemokine receptor 3 (CCR3) and C-C chemokine receptor 5 (CCR5). Upon activation, naive T cells terminate Klf2 gene expression rapidly (36,59).
Genes for Cell Growth and Maintenance.
Higher than other groups, a total of 32 genes were classified into this functional group. Half of them were increasingly expressed, including ATPase, class V, type 10D (Atp10d), Bloom syndrome homolog (Blm), Cd28, CD48 antigen (Cd48), coatomer protein complex, subunit zeta 1 (Copz1), density-regulated protein (Denr), erythrocyte protein band 4.9 (Epb4.9), Fibrillarin (Fbl), Glrx2, HIG1 domain family, member 2A (Higd2a), Irf2, lymphocyte antigen 6 complex, locus E (Ly6e), nudix (nucleoside diphosphate linked moiety X)-type motif 9 (Nudt9), solute carrier family 25 (mitochondrial carrier, phosphate carrier), member 3 (Slc25a3), suppressor of cytokine signaling 5 (Socs5), and Stat1. Cd48 (14:5, p = 0.01) and Ly6e (10:4, p = 0.031) are glucose phosphate isomerase (GPI)-linked proteins. CD48 deficient mouse is severely impaired in CD4+ T-cell activation and proliferation (16). Anti-CD48 mAbs can suppress immune responses and prolong allograft survival (52). Ly6e regulates T-cell differentiation, activation, and TCR-mediated IL-2 production (34). GPI-linked proteins can collaborate with Cd28 (5:0, p = 0.016) to activate T cells (40). The genes decreasingly expressed include apolipoprotein A-I (Apoa1), AT rich interactive domain 5A (Arid5a), diazepam binding inhibitor (Dbi), epithelial membrane protein 1 (Emp1), Ets1, guanine nucleotide binding protein, alpha 13 (Gna13), Jak2, lysosomal-associated protein transmembrane 4A (Laptm4a), myosin, heavy polypeptide 9, non-muscle (Myh9), nuclear factor of kappa light polypeptide gene enhancer in B-cells inhibitor, alpha (Nfkbia), ribosomal protein L23 (Rpl23), structural maintenance of chromosomes 4 (Smc4), transferrin receptor (Tfrc), tumor necrosis factor receptor superfamily, member 1b (Tnfrsf1b), tetraspanin 3 (Tspan3), testis-specific protein, Y-encoded-like 1 (Tspyl1). Laptm4a (5:13, p = 0.016) shares characteristics with other lysosome-associated proteins lysosomal-associated protein transmembrane 4 beta (Laptm4b) and lysosomal-associated protein transmembrane protein 5 (Laptm5), which are considered to be involved in the regulation of cell proliferation and survival (8). Nfkbia (0:4, p = 0.031) prevents inactivation of NF-κB pathway and is involved in several immune diseases (67). Tfrc (4:10, p = 0.031) and Tspan3 (0:4, p = 0.031) are involved in regulating of cell development, activation, growth, and motility.
Genes Related with Signal Transduction Pathways.
These genes are included in functional groups of “cell surface receptor linked signal transduction,” “G-protein-coupled receptor protein signaling pathway,” “small GTPase mediated signal transduction,” and “Wnt receptor signaling pathway.” The increasingly expressed genes are guanine nucleotide binding protein (G protein), beta polypeptide 2 like 1 (Gnb2l1), Socs5, F-box and WD-40 domain protein 4 (Fbxw4), and drebrin-like (Dbnl). The decreasingly expressed genes are guanine nucleotide binding protein, alpha 13 (Gna13), guanine nucleotide binding protein, alpha transducing 1 (Gnat1), G-protein-coupled receptor 18 (Gpr18), Jak2, and Tnfrsf1b. G-protein-coupled receptor protein signaling pathway controls cell proliferation, differentiation, and migration. Immunosuppressive drugs targeting G-protein-coupled receptors, such as FTY720, provide effective rejection prophylaxis in transplant patients (64). G-protein-coupled receptor Gnb2l1 (4:0, p = 0.031) was upregulated, whereas Gpr18 (0:4, p = 0.031), Gnat1 (0:4, p = 0.031), and Gna13 (2:7, p = 0.035) were downregulated. Gpr18 can be activated by its ligand NAGly to produce antinociceptive and anti-inflammatory effects (33). Specific inactivation of Gna13 in T cells enhances T-cell proliferation and the susceptibility of T-cell-mediated diseases (23). Studies showed that JAK-STAT pathway members Stat1 (10:1, p = 0.003) and Jak2 (1:5, p = 0.047) play positive roles in allograft rejection. STAT-1 decoy oligonucleotide therapy reduces acute rejection in allogeneic cardiac and small bowel transplants (26,61). Jak2 is related with Th1 cell differentiation by interacting with the activated IL-12 receptor. The Jak2 inhibitor AG490 can interfere with lymphocyte activation and prevent transplant rejection (25). But in this study, Jak2 was decreased in alloreactive CD4+ T cells. Socs5 (4:0, p = 0.031), as a negative regulators of JAK-STAT signal transduction pathway, also was upregulated in the allotransplantation group. It has been shown to inhibit IL-6 signaling, regulate EGF-R signaling, and Th1/Th2 T-cell balance through interaction with IL-4 receptor (49). The Wnt signaling pathway plays an important role in regulating proliferation, migration, polarity, and death. Fbxw4 (5:0, p = 0.016) and Tfrc (4:10, p = 0.03), which participate in this pathway (50,56), were differentially expressed in the allograft rejection mice.
Comparison of the Whole Allograft-Induced CD4+ T-Cell Gene Expression Profile Produced by SAGE with other Studies
To further explore our SAGE results, we compared the entire SAGE database with 10 transplantation-related gene expression profile studies, which published from 2002 to 2009 (5,6,11,20,24,42–44,53,70). We collected a total of 262 genes (data not shown) for the comparison in this part. All of these genes are presented in the figures, tables, or the text parts in these studies and have clear expression characteristic between different groups, such as rejection, syngenetic control, and tolerance. Depending on the different research background, research objectives, and the design requirements of the cDNA microarray, studies may have relatively low consistency with each other. However, most of the significant genes found by previous studies have the related transcripts in our CD4+ T-cell SAGE libraries (Table 8), especially the latest study that was published by Günther et al. (20). In that specific study, peripheral blood was used to investigate acute renal allograft rejection biomarkers. With the exception of some specific human genes, we found 16 out of the 17 (Table 2 in the cited paper) acute renal allograft rejection overexpressed genes in our SAGE libraries. The last column of this table shows some examples of genes found by these studies, which also have the related tags in our CD4+ T-cell SAGE libraries. Parts of these genes code some well-known molecules of adaptive immune, such as 1) CD antigen: CD antigen 3 (Cd3) and Cd28; 2) STAT-JAK pathway-related molecules: signal transducer and activator of transcription 3 (Stat3) and signal transducer and activator of transcription 5a (Stat5a); 3) cytokines and receptors: tumor necrosis factor (Tnf) and interleukin 2 receptor, gamma (Il2rg); 4) chemokine and receptors: chemokine (C-X-C motif) receptor 3 (Cxcr3) and chemokine (C-C motif) ligand 5 (Ccl5); 5) cytotoxic mediators: granzyme A (Gzma) and granzyme B (Gzmb); 6) apoptotic-related molecules: Fasl and Bcl2. By comparing, we found that not only our significant differentially expressed genes, such as Cd28, Cd48, Ly6e, proteasome (prosome, macropain) 28 subunit, alpha (Psme1), Fasl, placenta-specific 8 (Plac8), beta-2 microglobulin (B2m), Nfkbia, Ets1, and Stat1 have been proved by previous studies, many of the transcripts that were not deemed as significant genes (fold change < 3) in our SAGE libraries also have the coincident expression characteristic as been proved by other studies (Table 9).
A Comparison of Allo/Isograft-Induced CD4+ T-Cell SAGE Libraries With Other Studies

Significant Genes With Differences Less Than Threefold Between Allo- and Isotransplantation CD4+ T-Cell SAGE Libraries
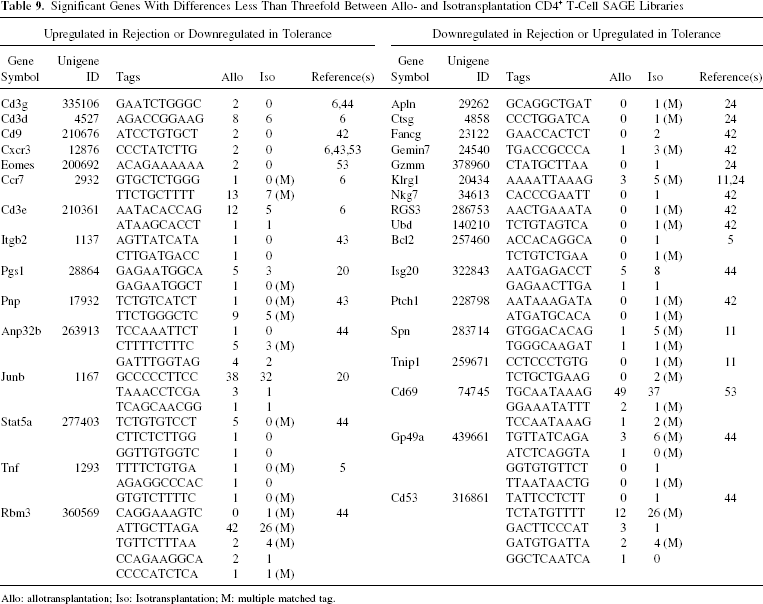
Allo: allotransplantation; Iso: Isotransplantation; M: multiple matched tag.
Discussion
In the last decade, gene expression profiling has revolutionized transplantation research by allowing the screening of tens of thousands of genes simultaneously. It has been useful in identifying potential biomarkers for acute and chronic rejection in peripheral blood mononuclear cells (PBMCs), novel pathways for induction of tolerance, and genes involved in protecting the graft from the host immune system. Comparing with the other high-throughput technology, SAGE allows both qualitative and quantitative analysis of previously known and unknown transcripts and alternatively spliced transcripts. Besides, by decreasing the sequencing length of a single transcript to a minimum of a 10-bp tag, SAGE converts the transcriptome complex into the simplest form. This simplicity enables SAGE a highly sensitive method for transcript analysis, especially for the detection of low-abundance transcripts. Hence, we used SAGE in this study to discover valuable allotransplantation-related genes.
With the continuous discoveries of new CD4+ T-cell subsets, more and more new issues surrounding Th1, Th2, Th17, Th3, Tr1, and CD4+CD25+ regulatory T cells have appeared in the field of transplantation. Understanding the biology behavior of CD4+ T cells in allograft rejection can help researchers to find pathways to analysis and regulate the host immune system to receive allograft, but also needs to maximally identify the genes involved in this process. From this point, we designed this experiment aimed to find more new allotransplantation-related CD4+ T-cell potential genes. As it has been well proved that CD4+ T cells were necessary and sufficient to initiate acute allograft rejection themselves (4,18, 21,38,68), we used SCID mouse as the recipient with CD4+ T-cell adoptive transfer to induce allograft rejection. This may produce some result different from using wild-type recipient, but have the advantages of excluding the interference of B and other T lymphocytes and avoiding the influence of infection after transplantation surgery, only focused on the CD4+ T cells. The background was pure enough and the gene expression profiles were allograft/isograft specific and CD4+ T-cell specific.
Our study identified 185 genes that had significantly different expression between the two libraries (Tables 3 and 4). Comparison of results of these tags with eight other CD4+ T-cell SAGE libraries using different CD4+ T-cell subsets provides our result the special value for CD4+ T-cell research in the transplantation field. Functional gene clustering analysis of their distribution in 23 functional clusters showed antigen presentation, apoptosis, cell activation, defense response, phosphorylation, and transcription contain more upregulated genes. By searching these genes on PubMed, we found only 25 genes have been linked to previous transplantation studies (PubMed search results by August 21, 2009) and only nine of them [Cd28 (971), Fasl (581), Jak2 (99), Stat1 (84), Blm (79), B2m (39), Cd48 (35), Apoa1 (14), and Ets1 (9)] have more than five related publications. Based on the findings in all areas, we analyze the potential research value of genes in four functional clusters below.
In this study, antiapoptotic genes, such as Birc6, Bnip2, Cd28, and Glrx2, were upregulated, whereas the proapoptotic genes, such as Fasl and Jak2, were downregulated. Therefore, the roles of these apoptosis-related genes in allograft rejection could provide some directions for further study. However, Stk17b/Drak2, which mediates apoptosis, was overexpressed in the allograft-activated CD4+ T cells. Previous study had shown that Drak2 is hypophosphorylated at Ser (13) but rapidly phosphorylated upon antigen receptor ligations in Jurkat cells, resting B cells, and thymocytes (15). Thus, in the allograft-activated CD4+ T cells, alloantigen stimuli may play a major role in the upregulation of Drak2.
Transcription factors identified by this study also have research value, such as Ets1 and Bhlhb2. Ets1 synergizes with AP-1 and GATA-3 at the Ets/NFAT site to regulate IL-5 transcription in mouse Th2 lymphocytes (66). Ets1-deficient Th cells differentiated more efficiently to Th17 cells than wild-type cells (46). Thus, the absence of Ets1 expression in allotransplantation group may associate with increased Th17 cells in allorejection, an opinion raised recently (3,45). Bhlhb2/Stra13 was a Stat3 beta-binding partner. STAT3-regulated promoter of the proapoptotic Fas gene was activated upon STRA13 overexpression (29). The upregulated Bhlhb2/Stra13 and the repressed Fasl expression in our results suggest that Fas-FasL pathway may play an important role in allograft rejections by maintaining CD4+ T-cell survival and allograft necrosis.
The largest functional cluster, “cell growth and maintenance,” contributes many genes. The overexpression of Cd48 and Ly6e in the allograft-activated CD4+ T cells suggests the potential roles of GPI-linked molecules in allograft rejection. Apoa1, a major protein component of high-density lipoprotein, was downregulated (1:5, p = 0.047) in the allotransplantation group (22). It has been shown that human apoA-I transfer promoted endothelial regeneration, and attenuated neointima formation in a murine model of transplant arteriosclerosis (14). Study also showed that ApoA1 increased at early stage after BMC transplantation was a marker of liver regeneration in cirrhotic mice (69). However, the exactly function of Apoa1 in alloreactive CD4+ T cells remains unclear.
Several genes participating in the JAK-STAT pathway were differentially expressed in allograft CD4+ T cells. Stat1 was upregulated whereas Jak2 was downregulated. Furthermore, a negative regulator of the JAK-STAT pathway, Socs5, was upregulated. This variance may reflect the complex roles of the JAK-STAT pathway in both cell protection and cell injury.
Besides of the 185 significant genes, our study also identified 196 multiple matched tags and 21 novel tags. For the multiple matched tags, we listed two UniGene clusters that had the highest scores on the NCBI SAGEmap for each tag (Supplementary Table 3, available from http://www.isotope.sdu.edu.cn/supplementarytables.htm). For the novel tags, it is very hard to identify the transcripts for all of them using GLGI in our model because of their low copy number. But they may have more obvious expressions in other studies. As the SAGEmap database is constantly expanding, the specific genes that are associated with the novel tags will eventually be identified.
In addition, we compared the whole SAGE database with 10 transplantation-related gene expression profile studies. As we previously described, the studies may be inconsistent when compared to one another because of the different research backgrounds, objectives, and cDNA microarray design strategies, but most of the significant genes that were previously found had related transcripts in our CD4+ T-cell SAGE libraries. Most of the significant genes, such as Cd28, Cd48, Psme1, Plac8, Nfkbia, Ets1, and Stat1, were consistently identified in the previous studies and our SAGE libraries. Furthermore, several of the transcripts that were not classified as significant tags (<3-fold) in this study have been previously shown to play roles in allograft rejection and tolerance, which include the genes listed in Table 9. Two possible reasons may explain why these transcripts were not classified as significant in this study. One reason is that the expression level differences are actually present but at relatively low levels. Another reason may be due to the SAGE tag generation process. NIaIII may missed the last “CATG” close to the 3′-polyA-ends and cut another “CATG” on this transcript instead, which finally produced several tags for one transcript as we shown. Several genes, such as Fasl, Gzmb, Gzma, and Ly6e, have differential expression levels in our study when compared to some other studies, but not all. Multiple factors may contribute to the discrepancies. 1) Different cell types were used in different studies: Our study analyzed CD4+ T cells, whereas other studies analyzed graft biopsies or whole peripheral blood cells. 2) Different time points for gene identification: Our study analyzed the CD4+ T cells 14 days after the induction of allograft rejections, whereas other studies analyzed the targeted samples at various time points after organ transplantations. 3) Different techniques used for the studies. Our study used the sequencing-based SAGE method without preselected genes setup before research, whereas others used either single gene-based or microarray-based methods.
In summary, we successfully used a SCID mouse transplant recipient with adoptively transferred wild-type CD4+ T-cell model to find new CD4+ T-cell-related genes that may play important roles in allograft rejection and tolerance. The background is pure enough and the model has a good repeatability. The 185 differentially expressed genes identified in this study provide a rich resource for researching the genes involved in allograft rejection. The open SAGE system makes the comparison with other CD4+ T-cell libraries more convenient. The whole SAGE database that was produced in this study also has value for further microarray studies and for identifying specific gene markers for clinical applications.
Footnotes
Acknowledgments
We thank Yaoqin Gong for her support in this study. This work was supported by grants from National Natural Science Foundation of China (C030471639, G.H.H.), and the Creative Research Team Program of Shandong University (G.H.H.).