
Abstract
Despite aggressive treatment approaches, muscle-invasive bladder urothelial carcinoma (MIBC) patients still have a 50% chance of developing general incurable metastases. Therefore, there is an urgent need for candidate markers to enhance diagnosis and generate effective treatments for this disease. We evaluated four mRNA microarray datasets to find differences between non-MIBC (NMIBC) and MIBC tissues. Through a gene expression profile analysis via the Gene Expression Omnibus database, we identified 56 differentially expressed genes (DEGs). Enrichment analysis of gene ontology, Kyoto Encyclopedia of Genes and Genomes, and Reactome pathways revealed the interactions between these DEGs. Next, we established a protein-protein interaction network to determine the interrelationship between the DEGs and selected 10 hub genes accordingly. Bladder urothelial carcinoma (BLCA) patients with COL1A2, COL5A1, and COL5A2 alterations showed poor disease-free survival rates, while BLCA patients with COL1A1 and LUM alterations showed poor overall survival rates. Oncomine analysis of MIBC versus NMIBC tissues showed that COL1A1, COL5A2, COL1A2, and COL3A1 were consistently among the top 20 overexpressed genes in different studies. Using the TCGAportal, we noted that the high expression of each of the four genes led to shorter BLCA patient overall survival. It was evident that BLCA patients with an elevated high combined gene expression had significantly shorter overall survival and relapse-free survival than those with low combined gene expression using PROGgeneV2. Using Gene Expression Profiling Interactive Analysis, we noted that COL1A1, COL1A2, COL3A1, and COL5A2 were positively correlated with each other in BLCA. These genes are considered as clinically relevant genes, suggesting that they may play an important role in the carcinogenesis, development, invasion, and metastasis of MIBC. However, considering we adopted a bioinformatic approach, more research is crucial to confirm our results. Nonetheless, our findings may have important prospective clinical implementations.
Introduction
Bladder urothelial carcinoma (BLCA) is the most common cancer of the urinary system, with 420,000 new cases and 160,000 deaths each year. The incidence of BLCA increases with age and is higher in men than in women 1 . Many risk factors play a role in the pathogenesis of bladder cancer, such as environmental factors, living factors, and diet factors 2 . Bladder cancers appear in many forms, namely urothelial carcinoma, squamous carcinoma, and adenocarcinoma; among which urothelial carcinoma is the most common, accounting for more than 90% of bladder cancer cases 3 . About 75% of newly diagnosed patients suffer from non-muscle invasive bladder cancer (NMIBC), while the remaining 25% suffer from muscle invasive bladder cancer (MIBC) 4 . The typical response to MIBC is neoadjuvant cisplatin-based chemotherapy followed by radical cystectomy; however, despite all efforts, there remains a 50% chance of developing general incurable metastatic diseases, especially in patients with advanced T-stage and lymph-node positive diseases at the time of operation 5 . Although cytotoxic chemotherapy has always been the main treatment for advanced bladder cancer, there seems to be a lack of high-quality evidence to guide the treatment of rare subgroups that are usually excluded from research 6 . In recent years, the combination of microarray technology and bioinformatic tools has led to the identification of new genes associated with cancer progression, diagnosis, and prognosis; bioinformatic analysis is a feasible and valuable approach that is not only helpful for better understanding the mechanism underpinning MIBC occurrence and development but also permits the identification of novel targets for MIBC diagnosis and prognosis. Therefore, we adopted this approach and effectively screened 56 differentially expressed genes (DEGs) from GEO, among which 10 hub genes were associated with MIBC progression and prognosis; we believe our findings may serve as potential biomarkers for the clinical setting.
Materials and Methods
Microarray Data
Gene Expression Omnibus (GEO) is a public functional genomics data repository of data from high-throughput gene expression analyses, chips, and microarrays (http://www.ncbi.nlm.nih.gov/geo) 7 . Four gene expression profiles (GSE7476, GSE37317, GSE48075, and GSE120736) were downloaded from GEO 8 –11 ; the four datasets contained both NMIBC and MIBC tissue samples (6 vs 3; 8 vs 10; 69 vs 73; and 78 vs 61, respectively) ( Table 1 ). All data are freely available, and the current research does not involve any human or animal experiments.
Statistics of the Four Microarray Databases Derived from the GEO Database.

GEO: gene expression omnibus; MIBC: muscle invasive bladder cancer; NMIBC: non-MIBC.
Identification of DEGs
DEGs were screened in both NMIBC and MIBC samples using GEO2R (http://www.ncbi.nlm.nih.gov/geo/geo2r); GEO2R is an interactive web-based tool through which comparisons between at least two GEO datasets are performed to select DEGs across experimental conditions. We analyzed DEGs in our four datasets taking into account the following cut-off criteria: adjusted P < 0.05 and |log FC| ≥ 1. The intersecting genes were checked using the Venn diagram web tool (http://bioinformatics.psb.ugent.be/webtools/Venn/).
Protein-Protein interaction (PPI) Network Establishment
To construct a PPI network, protein interactions were first analyzed using the Search Tool for the Retrieval of Interacting Genes (STRING, version 11.0; http://string-db.org) 12 . Analyzing functional protein interactions is a useful method for studying the mechanisms underpinning BLCA. We used the STRING database to construct a PPI network with a confidence score above 0.4 as the cut-off criterion. Then, we utilized Cytoscape (version 3.6.1), which is a software platform with an open bioinformatic source 13 , to establish the visualization of the PPI network.
Kyoto Encyclopedia of Genes and Genomes (KEGG) and Reactome Pathway Enrichment Analysis and Gene Ontology (GO) Annotation Analysis of DEGs
GO is considered one of the main bioinformatic methods for analyzing gene biological process 14 ; the KEGG is a database that was established through high-throughput experimental techniques, which allows users to explore biological systems and advanced functions from a wide range of molecular datasets 15 , while Reactome is simultaneously an archive of biological processes and a tool for discovering unexpected functional relationships between datasets, such as gene expression profiles or somatic mutation catalogs of tumor cells 16 . In this study, GO annotation analysis, as well as KEGG and Reactome pathway enrichment analysis of DEGs were executed using STRING (version 11.0; http://string-db.org); adjusted P < 0.05 showed statistical significance.
Hub Gene Selection and Analysis
CytoHubba is a plug-in for Cytoscape that is used to explore the degree of each protein node. In this study, the genes with the top 10 highest degree values were considered as hub genes. The network comprising central genes and their co-expressed genes was analyzed by CytoHubba; the relationship between the gene expression levels of NMIBC patients and MIBC patients was previously analyzed by Sanchez-Carbayo et al. using the online Oncomine database (http://www.oncomine.com) 17 . Moreover, hierarchical clustering was performed to analyze the expression levels of these hub genes in different pathological stages of BLCA using the UCSC Cancer Genomics Browser (http://genome-cancer.ucsc.edu) 18 ; the Kaplan–Meier estimator was utilized to analyze the effect of the hub genes on patient disease-free survival and overall survival via the cBioPortal platform (http://www.cbioportal.org) 19,20 .
Oncomine Database Analysis
Oncomine is an online tool for discovering new biomarkers in a variety of tumor microarray databases (https://www.oncomine.org/). We utilized this tool with the following screening criteria: (1) Cancer Type: Bladder Urothelial Cancer; (2) Data Type: mRNA; and (3) Analysis Type: Bladder Cancer Histology Analysis. We compared the overexpressed genes between MIBC and NMIBC tissues across eight studies in the ONCOMINE database 17,21 –27 .
Analysis of COL1A1, COL1A2, COL3A1, and COL5A2 using TCGAportal, PROGgeneV2, and Gene Expression Profiling Interactive Analysis (GEPIA)
The TCGAportal (http://www.tcgaportal.org/) 28 is an online web tool used to retrieve COL1A1, COL1A2, COL3A1, and COL5A2 expression data in different BLCA grades and stages, and the corresponding overall survival statuses (data from The Cancer Genome Atlas database, https://portal.gdc.cancer.gov/). We determined the prognostic relevance of a multiple-gene signature on overall and disease-free survival in various publicly available gene expression datasets using the PROGgeneV2-Pan Cancer Prognostics Database (http://genomics.jefferson.edu/proggene/) 29 . We also analyzed the correlation between the four genes using the GEPIA database (http://gepia.cancer-pku.cn/index.html) 30 .
Results
Identification of DEGs in MIBC
After acquiring four different gene expression profiles, we identified a large number of DEGs (1156 in GSE7476, 746 in GSE120736, 1093 in GSE48075, and 604 in GSE37317). We then conducted a Venn analysis to examine the intersection among the DEG profiles (Fig. 1A). Ultimately, a total of 56 common DEGs were evident. Notably, the expression level of these DEGs varied between MIBC and NMIBC tissues, as 32 DEGs were significantly upregulated and 24 were significantly downregulated in the former.

Identification of DEGs: Venn diagram and PPI network analyses. (A) A Venn diagram, including the total DEGs, was designed and used to detect DEG profile intersections; a total of 56 DEGs were expressed in the four groups. (B) A protein–protein interaction network was constructed using the differentially expressed genes; purple nodes represent upregulated genes, and green nodes represent downregulated genes. (C) The network of hub genes and their co-expressed genes was analyzed using the CytoHubba tool; purple nodes represent the co-expressed genes, while the other colored nodes represent the hub genes: the red node represents the highest degree gene, and the yellow node represents the lowest degree gene. DEGs: differentially expressed genes; PPI: protein-protein interaction.
KEGG and Reactome Pathway Enrichment Analysis and GO Annotation Analysis of DEGs
As shown in Table 2 , the GO analysis demonstrated that the DEGs were involved in biological process (BP) variations that were markedly enriched in extracellular structure organization; changes in cell components (CC) were prominently enriched in fibrillar collagen trimers. Moreover, the most significantly enriched molecular function (MF) term was platelet-derived growth factor binding. Furthermore, KEGG and Reactome pathway analyses showed that the DEGs were mainly enriched in protein digestion and absorption and extracellular matrix organization, respectively ( Table 2 ).
Significantly Enriched GO Terms, KEGG, and RCTM Pathways of DEGs.
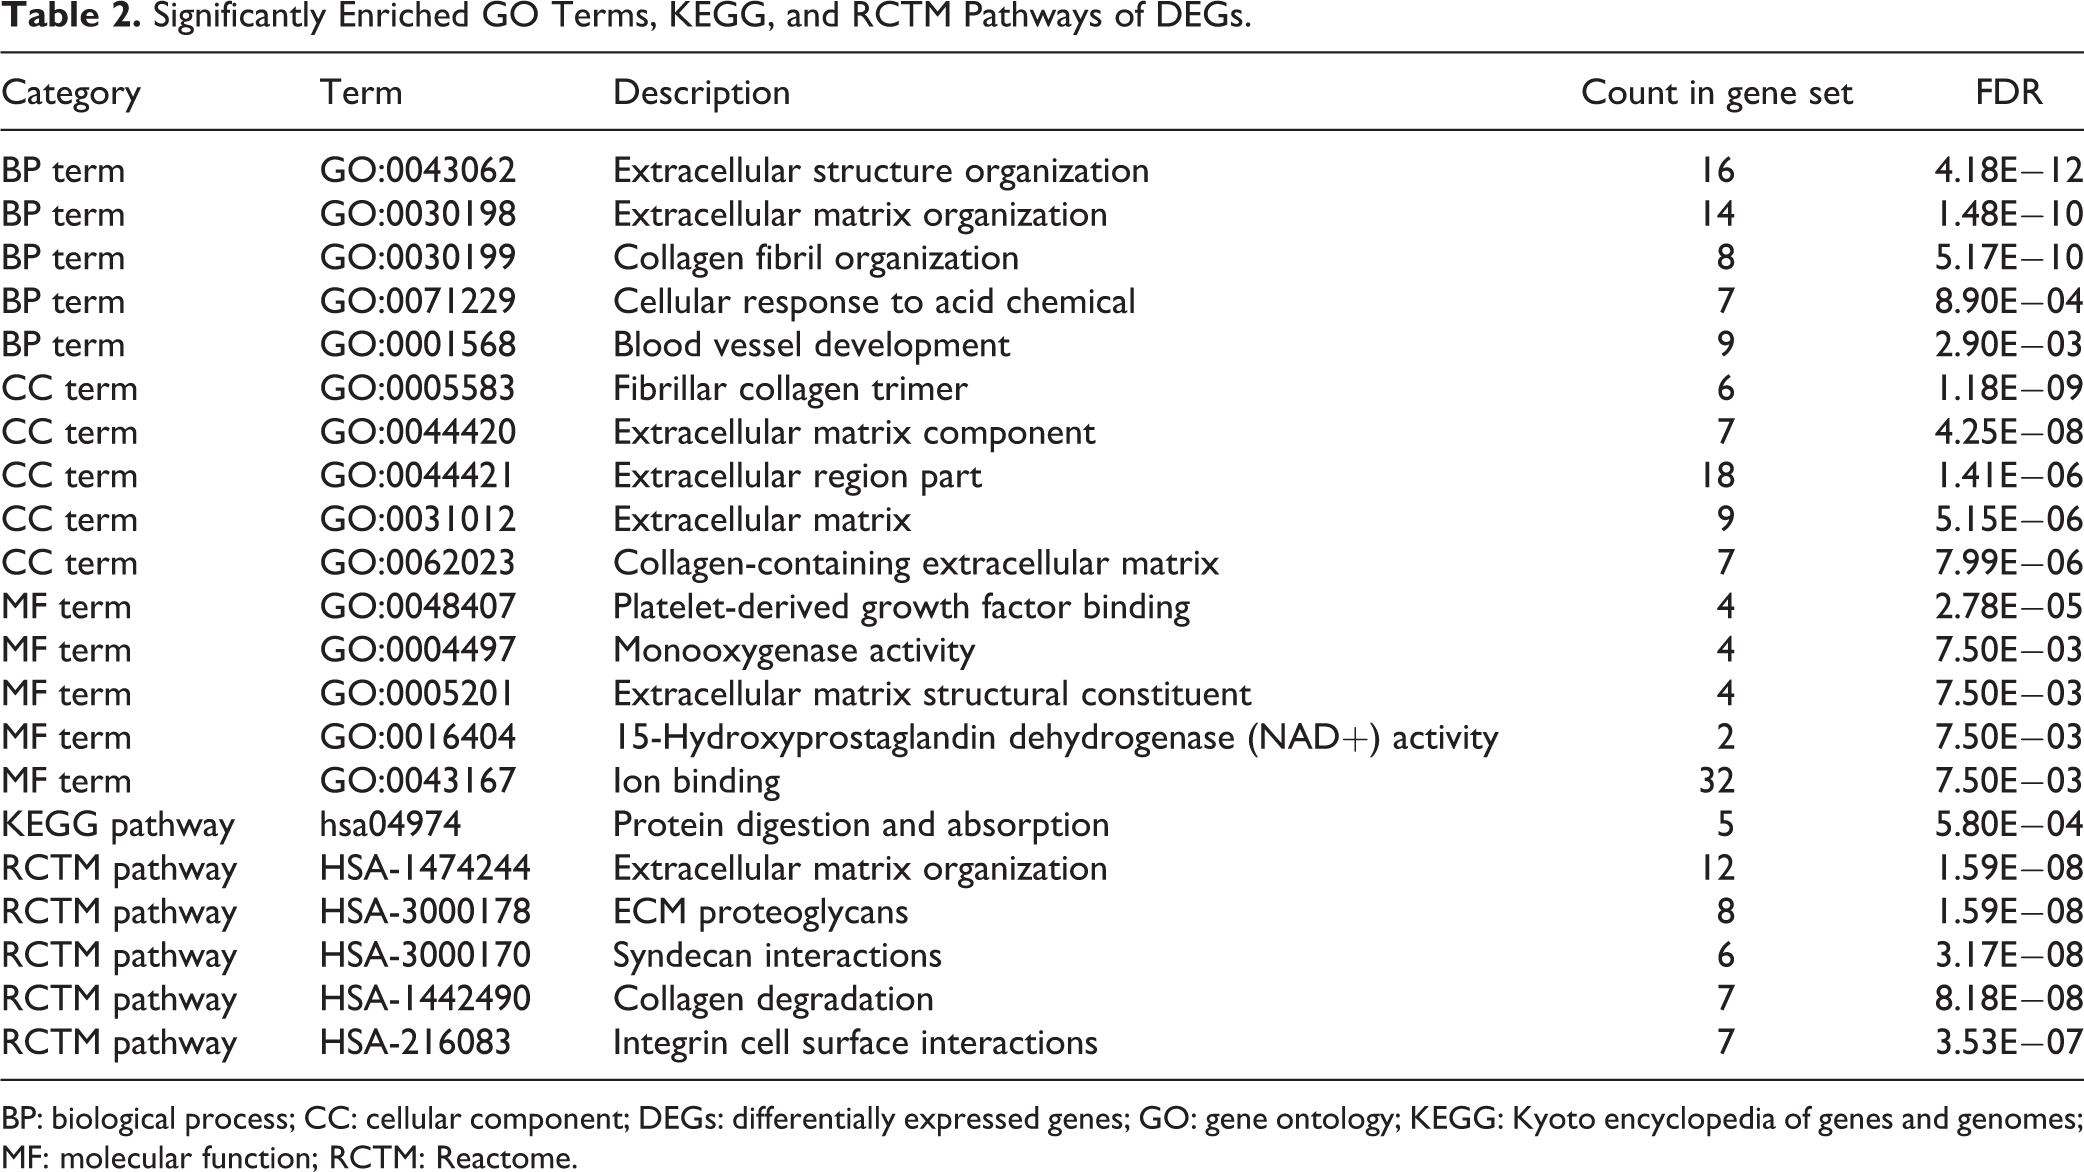
BP: biological process; CC: cellular component; DEGs: differentially expressed genes; GO: gene ontology; KEGG: Kyoto encyclopedia of genes and genomes; MF: molecular function; RCTM: Reactome.
Establishment of a PPI Network and Hub Gene Selection
The PPI network of the 56 DEGs was established via STRING tools and Cytoscape; this network consisted of 71 edges and 37 nodes (Fig. 1B). The DEGs were then ranked according to their degree of interaction, and the top 10 were identified as hub genes ( Table 3 ). We saw that collagen type I alpha 1 chain (COL1A1) was the most significant gene, with a degree = 12, followed by COL3A1, COL1A2, VCAN, COL5A2, COL5A1, LUM, TIMP2, SULF1, TPX2, respectively. All the hub genes were markedly upregulated in MIBC tissues.
Top 10 Hub Genes with Higher Degree.

Analysis for Hub Genes
In Table 3 , we listed the symbols, full names, and aliases of the hub genes. A central gene network along with co-expressed genes was detected by CytoHubba (Fig. 1C). In the Sanchez-Carbayo dataset, the gene expression level of all hub genes, except for TPX2, was higher in MIBC patients than in NMIBC patients (Fig. 2). Notably, hierarchical clustering showed that every hub gene was expressed in BLCA (Fig. 3A); however, gene expression levels in BLCA patients with stage III or IV tumors were significantly higher than those in BLCA patients with stage II tumors, with the exception of TPX2 (Fig. 3B). Subsequently, the effect of these hub genes on the disease-free survival and overall survival rates was analyzed by Kaplan–Meier curve using the online cBioPortal platform. BLCA patients with COL1A2, COL5A1, COL5A2 alterations were associated with poor disease-free survival (Fig. 4A), whereas, BLCA patients with COL1A1 and LUM alterations were correlated to poor overall survival (Fig. 4B).

Comparison of hub gene expression levels between NMIBC and MIBC tissues from the Sanchez-Carbayo Bladder 2 dataset. The gene expression levels in patients with MIBC were higher than that in patients with NMIBC, except for TPX2; 1, infiltrating bladder urothelial carcinoma; 2, superficial bladder cancer. MIBC: muscle-invasive bladder cancer; NMIBC: non-MIBC.

Expression levels of hub genes in different pathological stages of BLCA using the UCSC browser. (A) The hierarchical clustering of hub genes was constructed. BLCA samples were analyzed for gene upregulation (marked in red) and downregulation (marked in blue). (B) Gene expression levels in BLCA patients with stage III or IV tumors are significantly higher than those in BLCA patients with stage II tumors, except for TPX2. BLCA: bladder urothelial carcinoma.

Disease-free survival and overall survival analyses of hub genes via the cBioPortal online platform. (A) BLCA patients with COL1A2, COL5A1, and COL5A2 alterations were associated with shorter disease-free survival (P < 0.05). (B) BLCA patients with COL1A1 and LUM alterations were linked to shorter overall survival (P < 0.05). BLCA: bladder urothelial carcinoma.
Oncomine Database Analysis
The MIBC and NMIBC tissues were analyzed using the Oncomine database. Notably, COL1A1, COL5A2, COL1A2, and COL3A1 were among the top 20 overexpressed genes of both tissues in different studies (Fig. 5). Our findings suggest that these genes are crucial in bladder cancer, revealing that they may play an important role in the carcinogenesis and/or development of MIBC.

Oncomine analysis of overexpressed genes in MIBC tissues from eight studies. Heat maps of the top 20 overexpressed genes in MIBC tissues including the COL1A1, COL1A2, COL5A2, and COL3A1 genes. 1, Blaveri bladder 2 21 ; 2, Dyrskjot bladder 22 ; 3, Dyrskjot bladder 3 23 ; 4, Dyrskjot bladder 5 24 ; 5, Lee bladder 25 ; 6, Modlich bladder 2 26 ; 7, Sanchez-Carbayo bladder 2 17 ; 8, Stransky bladder 27 . MIBC: muscle-invasive bladder cancer.
Analysis of COL1A1, COL1A2, COL3A1, and COL5A2 using TCGAportal, PROGgeneV2, and GEPIA
The expressions of COL1A1, COL1A2, COL3A1, and COL5A2 were directly proportional to the clinical stage and grade of BLCA according to TCGAportal online analysis. Out of 276 BLCA patients, 138 patients were in the low-expression gene group and 138 patients were in the high-expression gene group. High expression of COL1A1, COL1A2, COL3A1, and COL5A2 genes with BLCA patients showed remarkably worse overall survival time using the TCGAportal online tool (Fig. 6). We analyzed the ability of our four-gene signature to predict survival via PROGgeneV2; the results of combined gene expression analyses from public data are presented in Fig. 7A, B . Analyzing the GSE13507 gene array dataset, from the study of Wun-Jae Kim et al., revealed that patients with high combined gene expression had significantly shorter overall survival than those with low combined gene expression in bladder cancer 31 . Whereas, the microarray dataset (GSE31684) by Schmidt et al. indicated that high combined gene expression was associated with poor relapse-free survival in bladder cancer 32 . Furthermore, we analyzed the correlation between our four genes of interest using the GEPIA-BLCA dataset; we found that COL1A1 was positively correlated with COL1A2 (R = 0.97, P < 0.01), COL3A1 (R = 0.97, P < 0.01), and COL5A2 (R = 0.91, P < 0.01), respectively; while COL1A2 was positively correlated with COL3A1 (R = 0.97, P < 0.01) and COL5A2 (R = 0.88, P < 0.01), respectively, and COL3A1 was positively correlated with COL5A2 (R = 0.89, P < 0.01) (Fig. 8).

Analysis of COL1A1, COL1A2, COL3A1, and COL5A2 expression in BLCA using TCGAportal. (A) Expression of COL1A1 in different BLCA grades and stages; BLCA patients with higher COL1A1 expression levels showed a shorter overall survival. (B) Expression of COL1A2 in different BLCA grades and stages; BLCA patients with higher COL1A2 expression levels showed a shorter overall survival. (C) Expression of COL3A1 in different BLCA grades and stages; BLCA patients with higher COL3A1 expression levels showed a shorter overall survival. (D) Expression of COL5A2 in different BLCA grades and stages; BLCA patients with higher COL5A2 expression levels showed a shorter overall survival. BLCA: bladder urothelial carcinoma.

Predicting the effect of the four-gene (COL1A1, COL1A2, COL3A1, and COL5A2) signature on the survival of BLCA patients using PROGgeneV2. Public databases (GSE13507, GSE31684) were used to classify bladder cancer into high combined gene and low combined gene expression subgroups (as per the median). Kaplan–Meier survival curves showed that patients with a high gene expression had significantly shorter overall survival (A) and relapse-free survival (B) than those with low gene expression. BLCA: bladder urothelial carcinoma.

Correlations between COL1A1, COL1A2, COL3A1, and COL5A2 in BLCA. The correlations between COL1A1, COL1A2, COL3A1, and COL5A2 in BLCA were analyzed using Gene Expression Profiling Interactive Analysis; COL1A1, COL1A2, COL3A1, and COL5A2 were positively correlated with each other. BLCA: bladder urothelial carcinoma.
Discussion
Bladder cancer is one of the most common cancers in the world, with about 430,000 newly diagnosed cases each year 33 . Most bladder cancers are of epithelial origin, among which urothelial tumors account for about 90% of the cases. Traditionally, radical cystectomy has been the standard treatment for MIBC; however, this approach is associated with potential complications that might negatively affect the patient’s quality of life 34 . Although early diagnosis and multimodal treatments grant promising results, metastatic diseases are usually incurable and have a frightening 5-year overall survival rate of just 15% 35 . Metastasis and recurrence are the leading causes of death in bladder cancer patients, especially those with MIBC. Therefore, identifying novel biomarkers and further understanding the molecular mechanism of MIBC are crucial for enhanced diagnosis strategies and treatment options for MIBC.
In this study, we identified 56 DEGs that were common to both MIBC and NMIBC; however, 32 DEGs were upregulated and 24 were downregulated in MIBC compared with those in NMIBC. KEGG and Reactome pathway enrichment analyses, along with GO function annotation, suggested that these 56 DEGs were mainly enriched in “extracellular structure organization,” “fibrillar collagen trimer,” “platelet-derived growth factor binding,” “protein digestion and absorption,” and “extracellular matrix organization” terms. PPI network construction allowed the visualization of DEG interconnections, which we then used to determine 10 hub genes. Notably, all our hub genes were overexpressed in MIBC. In the Sanchez-Carbayo Bladder 2 dataset, we found that COL1A1, COL3A1, COL1A2, VCAN, COL5A2, COL5A1, LUM, TIMP2, and SULF1 were differentially expressed in NMIBC and MIBC, except for TPX2, which is consistent with previous findings available on the UCSC platform (http://genome-cancer.ucsc.edu) that compared stage II tumors with stage III or stage IV tumors. Kaplan–Meier estimation revealed that BLCA patients with COL1A2, COL5A1, and COL5A2 alterations were linked to poor disease-free survival, whereas, BLCA patients having COL1A1 and LUM alterations were associated with poor overall survival. While comparing MIBC and NMIBC tissues via the Oncomine database revealed that four genes, COL1A1, COL5A2, COL1A2, and COL3A1, were consistently among the top 20 overexpressed genes in different studies. Combining the results of our different approaches, COL1A1, COL1A2, COL3A1, and COL5A2 were considered to be clinically relevant genes that may play an important role in the carcinogenesis and/or development of MIBC. We further demonstrated that with the increase in disease severity (clinical stage and tumor grade), the expression of COL1A1, COL1A2, COL3A1, and COL5A2 genes also increased. Furthermore, high expression of COL1A1, COL1A2, COL3A1, and COL5A2 led to a shorter overall survival of BLCA patients, as per data retrieved from TCGAportal online tool. We also analyzed that patients with high combined gene expression had significantly shorter overall survival and relapse-free survival than those with low combined gene expression in BLCA by PROGgeneV2 online tool; this finding is even more relevant considering that COL1A1, COL1A2, COL3A1, and COL5A2 were positively correlated according to our GEPIA investigation.
COL1A1 gene encodes the pro-alpha1 chains of type I collagen; Wu et al. previously revealed that the expression of COL1A1 was increased in colorectal adenocarcinoma and that COL1A1 silencing significantly inhibited cell proliferation, migration, and invasion and promoted apoptosis 36 . Furthermore, Ma et al. reported that the siRNA-mediated COL1A1 silencing (siCOLIA1) inhibited the clonality, motility, and invasiveness of hepatocellular carcinoma cells and abolished the Slug-dependent epithelial-to-mesenchymal transition and hepatocellular carcinoma stem gene signatures 37 . Zhu et al. showed that the loss of BMP1 promotes the expression of COL1A1 and EMT progression in colon cancer 38 ; COL1A1 may be a novel prognostic biomarker and a promising therapeutic target for breast cancer 39 , malignant astrocytoma 40 , colorectal cancer 41 , and gastric cancer 42 . Rong et al. have shown that COL1A2, which encodes the pro-alpha2 chain of type I collagen, has a higher expression in gastric cancer than in normal tissues 43 . Additionally, Tamilzhalagan et al. reported that miR-25 can selectively target the COL1A2 gene. Interestingly, miR-25 silencing increased the expression of COL1A2 and inhibited the expression of E-cadherin, revealing the inhibitory effect of mir-25 on diffuse gastric cancer 44 . Notably, COL1A2 was highly expressed in pancreatic cancer 45 , sarcoma 46 , and gastric cancer 47 tissues and promoted cell proliferation, migration, and invasion, which provided insights for mechanistic studies and clinical trials. COL3A1 was found to be the main structural component of hollow organs such as the great vessels, the uterus, and the intestines. Other functions of type III collagen include the interaction with platelets in the coagulation cascade and the signaling in wound-healing processes 48 . The expression of COL3A1 is associated with shorter overall survival of patients with epithelial ovarian cancer of four major tissue types 49 . Qiu et al. reported that abnormal expression of miR-29a/b in nasopharyngeal carcinoma tissue may regulate COL3A1 expression and contribute to migration and invasion 50 , while Su et al. indicated that let-7d can at least partially inhibit growth, metastasis, and macrophage infiltration in renal cell carcinoma by targeting COL3A1 51 . COL5A2, collagen type V alpha 2 chain, encodes an alpha chain that composes one of the low abundance fibrillar collagens, and mutations in this gene are associated with the Ehlers–Danlos syndrome 52 . Zeng et al. demonstrated that COL5A2 was related to the poor clinical outcome and survival rate of patients with bladder cancer, suggesting its potential as a biomarker for bladder cancer 53 . Vargas et al. reported that compared with ductal carcinoma, the in situ expression of COL5A2 increased in invasive breast cancer and was associated with extracellular matrix remodeling, suggesting that COL5A2 is associated with tumor progression in breast cancer 54 . Moreover, the expression of COL5A2 was related to the malignancy of colorectal cancer 55 and tongue squamous cell carcinoma 56 .
In addition to COL1A1, COL1A2, COL3A1, and COL5A2, we found six other hub genes related to MIBC—VCAN, COL5A1, LUM, TIMP2, SULF1, and TPX2. These hub genes may be considered as valuable markers for the diagnosis, treatment, and prognosis of MIBC tumors.
Conclusion
In this study, we performed a comprehensive bioinformatic analysis to identify hub genes that may be involved in the progression, carcinogenesis, and development of MIBC. We found 10 hub genes with this potential; in particular, COL1A1, COL1A2, COL3A1, and COL5A2 caught our attention. Our findings may provide a new perspective for future research on the molecular mechanism of MIBC. However, considering we adopted a bioinformatics approach, further biological experiments are imperative.
Footnotes
Ethical Approval
This study was approved by our institutional review board.
Statement of Human and Animal Rights
This article does not contain any studies with human or animal subjects.
Statement of Informed Consent
There are no human subjects in this article and informed consent is not applicable.
Declaration of Conflicting Interests
The author(s) declared no potential conflicts of interest with respect to the research, authorship, and/or publication of this article.
Funding
The author(s) received no financial support for the research, authorship, and/or publication of this article.