
Abstract
Mesenchymal stem cells (MSCs) are promising candidates for cell therapy and tissue engineering. Increasing evidence suggests that MSCs isolated from fetal tissues are more plastic and grow faster than adult MSCs. In this study, we characterized human mesenchymal progenitor cells from chorionic villi (CV) and amniotic fluid (AF) isolated during the first and second trimesters, respectively, and compared them with adult bone marrow-derived MSCs (BM). We evaluated 10 CV, 10 AF, and 6 BM samples expanded until the MSCs reached senescence. We used discarded cells from prenatal analyses for all the experiments. To evaluate the replicative stability of these cells, we studied the telomerase activity, hTERT gene transcription, and telomere length in these cells. Spontaneous chromosomal alterations were excluded by cytogenetic analysis. We studied the expression of c-myc and p53, tumor-associated genes, at different passage in culture and the capacity of these cells to grow in an anchorage-independent manner by using soft agar assay. We isolated homogeneous populations of spindle-shaped CV, AF, and BM cells expressing mesenchymal immunophenotypic markers throughout the period of expansion. CV cells achieved 14 ± 0.9 logs of expansion in 118 days and AF cells achieved 21 ± 0.9 logs in 118 days, while BM cells achieved 11 × 0.4 logs in 84 days. Despite their high proliferation capacity, fetal MSCs showed no telomerase activity, no hTERT and c-myc transcriptions, and maintained long, stable telomeres. A constant expression level of p53 and a normal karyotype were preserved throughout long-term expansion, suggesting the safety of fetal MSCs. In conclusion, our results indicate that fetal MSCs could be an alternative, more accessible resource for cell therapy and regenerative medicine.
Keywords
Introduction
In recent years, human mesenchymal stem cells (MSCs) have been of great interest due to their potential in clinical applications. In previous studies, the most important source of MSCs was adult bone marrow (BM) (18). Recently, MSCs with similar cell surface markers and differentiation capacity have also been found in developmentally younger tissues, such as amniotic fluid (AF) and chorionic villi (CV) (8,19). MSCs are able to adhere to plastic, to self-renew, and to differentiate into adipose, bone, and cartilaginous tissues (14,16). In culture, MSCs gradually decline in proliferative rate and enter cellular senescence (23). Replicative stability is conferred by telomeres, regions of highly repetitive GC-rich DNA sequence (TTAGGG in human) at the ends of eukaryotic chromosomes (31). Telomere shortening is known to play an important part in the molecular aging of cells (4,30). In certain cell types, telomere loss is counteracted by telomere elongation catalyzed by the enzyme telomerase (24). Telomerase is undetectable in mature cells and highly active in the vast majority of human tumors, and its activity varies across different types of stem cells (31). The telomere regulation mechanisms active in MSCs remain unknown.
Human adipose tissue-derived MSCs and murine BM-derived MSCs undergo spontaneous transformation after numerous passages in culture, exhibiting increased telomerase activity (21).
The aim of this study was to evaluate telomere length, telomerase activity, transcriptional activity of the human telomerase reverse transcriptase (hTERT), the catalytic subunit of telomerase enzyme (12), c-myc and p53 expression levels and karyotype in MSCs isolated from AF and CV compared to bone marrow MSCs. These fetal cells expanded more rapidly than BM MSCs, so we investigated their potential susceptibility to malignant transformation after long-term culture and ascertained the safety of these cells for clinical use.
Materials and Methods
Cell Cultures
CV samples were obtained, after informed consent and permission for studies on human-derived tissue by our institution, from 10 pregnant women at 11–13 weeks of gestation. Contamination by maternal decidua fragments was excluded by an accurate manual selection of the CV at inverted microscope, a technique commonly used in cytogenetic analysis. CV cells was isolated using a villocentesis technique and we used only those cells taken after the first passage of back-up cultures prepared for prenatal diagnosis (generally after 20–30 days of culture) at the end of cytogenetic analysis.
Amniotic fluid samples were collected after informed consent from 10 pregnant woman at 15–18 weeks of gestation. Contamination by maternal cells was excluded during amniocentesis, discarding the first 2 ml of amniotic fluid, a technique commonly used in cytogenetic analysis. Cells were harvested from discarded supernatants of AF cell cultures prepared for prenatal diagnosis. A cell culture was established after centrifugation for 10 min at 2,000 rpm.
BM was harvested from six healthy donors (median age 17 years, range 16–45 years), after obtaining written informed consent. Heparinized BM (5 ml) from each donor was used for MSC generation and expansion. BM was diluted with PBS (PBS Dulbecco's) and layered onto Ficoll (MP Biomedicals). The Ficoll gradient was spun at 1,500 rpm for 30 min at room temperature. The remaining interphase mononuclear cells were collected and washed twice with PBS.
Cells were seeded at 2000 cells/cm2 in DMEM (Biological Industries) supplemented with 20% fetal bovine serum and incubated at 37°C and 5% CO2 in a fully humidified atmosphere. When the cells reached confluence (about 70–80%), they were treated with trypsin for 3 min and replaced for subculture; their proliferative potential was then tested. The proliferative potential and the population doubling (PD) of cultured MSCs were calculated at every passage according to the equations log10 (the number of harvested cells/the number of seeded cells) and log2 (the number of harvested cells/the number of seeded cells), respectively. The finite PDs were determined by cumulative addition of total numbers generated from each passage until the cells ceased dividing.
Immunophenotype Analysis
Ten CV MSCs, 10 AF MSCs, and 6 BM MSCs samples were characterized by flow cytometry at all passages (CV from passage 1 to 11, AF from passage 1 to 15, BM from passage 1 to 9). Cells were trypsinized and stained with fluorescein isothiocyanate (FITC)-, phycoerythrin (PE)-, or peridinin chlorophyll protein (PerCP)-conjugated antibodies against CD45 (BD Biosciences), CD34 (BD Biosciences), CD14 (BD Biosciences), CD31 (Dako), CD133 (Miltenyi), CD117 (Miltenyi), CD271 (Miltenyi), CD90 (BD Pharmingen), CD105 (Immunostep), CD73 (BD Biosciences), CD44 (BD Biosciences), CD13 (BD Biosciences), and CD29 (BD Biosciences). FITC, PE (Dako), and PerCP (Becton Dickinson Pharmingen) negative isotypes were used as control antibodies. Cells were incubated with primary antibodies at 4°C for 30 min. Thereafter, cell fluorescence was evaluated by flow cytometry with a FACSCalibur instrument (Becton Dickinson). The data were analyzed using CellQuest Software.
Osteogenic, Adipogenic, and Chondrogenic Differentiation
Ten CV, 10 AF, and 6 BM samples were cultured in differentiation medium after four, six, and eight passages. Cells were cultured in an adipogenic medium (NH AdipoDiff; Miltenyi Biotech), osteogenic medium (NH OsteoDiff; Miltenyi Biotech), and chondrogenic medium (NH ChondroDiff; Miltenyi Biotech). MSCs were diluted, respectively, to a final concentration of 5 × 10⁴ cells/ml, 3 × 10⁴ cells/ml, and 2.5 × 10⁵ cells/ml in differentiation medium and cultured for 21, 10, and 24 days, respectively. Samples were done in duplicate and we used cells maintained in regular medium as negative control.
Intracellular lipid droplets observed by Oil red O staining (Sigma-Aldrich, St. Louis, MO, USA) indicated adipogenic lineage differentiation. The differentiation potential in the osteogenic lineage was evaluated by calcium accumulation as assessed by Alizarin red S (Sigma-Aldrich) and Von Kossa staining and by alkaline phosphatase activity (Sigma). Chondrogenic differentiation was evaluated with a specific kit (DakoCytomation LSAB System-AP; Dako).
RNA Extraction and cDNA Synthesis
Total RNA was extracted from 10 CV, 10 AF, and 6 BM samples with the Invisorb RNA Kit II (Invitek) according to the manufacturer's instructions. The purity of the RNA was confirmed by determining the 260 nm/280 nm absorbance ratio (>1.8). For each sample, 1 μl of total RNA was reverse-transcribed in a 20 μl reaction containing 1× reaction buffer (Invitrogen, Milan, Italy), 4 mM dNTPs (Biotech, Milan, Italy), 5 mM MgCl2 (Promega, Milan, Italy), 5 mM random hexamers (Invitrogen), 10 mM DTT (Invitrogen), 20 U/μl RNase inhibitor (Takara, Shiga, Japan), and 200 U/μl MMLV reverse transcriptase (Invitrogen). Reactions proceeded for 10 min at 70°C, 10 min at 20°C, 45 min at 42°C, and 3 min at 99°C.
Reverse-Transcription Polymerase Chain Reaction (RT-PCR)
For each PCR reaction 1.5 μl cDNA was amplified in a 25 μl reaction using 1× buffer (Euroclone, Milan, Italy), 3 mM MgCl2 (Euroclone), 10 mM dNTPs (Biotech), 10 μM sense and antisense gene-specific primers, and 5 U/μM Taq (Euroclone). PCR was performed using the following set of primers: COMP (cartilage oligomeric matrix protein) forward 5′-GCAGATGCTTCGG GAACTGCA-3′, reverse 5′-TTGATGCACACGGAGT TGGGG-3′ (500 bp); OCN (Osteocalcin) forward 5′-TCACACTCCTCGCCCTATTG-3′, reverse 5′-AAAG AAGGGTGCCTGGAGAG-3′′(355 bp).
PCR conditions consisted of an initial denaturation at 94°C for 4 min followed by 35 cycles of denaturation at 94°C for 30 s, annealing for 30 s, extension at 72°C for 30 s, and a final step of extension at 72°C for 10 min. Annealing temperatures were dependent on the primers used (60°C for OCN and PCR Touch Down for COMP 60–65°C).
PCR products were separated by electrophoresis in 2% agarose gel, then stained with ethidium bromide and visualized using an UV illuminator.
Culture in Soft Agar
For in vitro testing of anchorage-independent colony development, MSCs of 10 CV, 10 AF, and 6 BM samples were cultured in soft agar at passage 6 for all samples and also at passage 11 and 15 for CV and AF, respectively. Cells were seeded into 0.3% agarosio containing DMEM and 20% FBS on top of a bed of 0.5% agar in 35-mm dishes at 2 × 10⁴ cells per dish. Plating was done in duplicate and 0.75 ml of media was added two times per week to the dishes to avoid drying out and to ensure the cells had sufficient nutrients. Plates were incubated at 37°C and 5% CO2. Two weeks later, plates were evaluated for the presence of colonies. A549 cell line was used as positive control and a plate containing only base and top agar was used as negative control.
Telomere Length Analysis
Telomere length of 10 CV, 10 AF, and 6 BM samples was analyzed with a Telomere Restriction Fragment (TRF) length assay using the TeloTTAGGG telomere length assay (Roche). Genomic DNA was extracted from 1 × 10⁶ cells using a QIAamp DNA Blood Mini kit (Qiagen). DNA concentration and purity was determined by spectrophotometry and gel electrophoresis. Briefly, 2 μg of genomic DNA was digested with the restriction enzymes HinfI and RsaI, separated by electrophoresis at 95V on a 0.8% agarose/TAE gel and transferred onto positively charged nylon membranes (Roche) by overnight capillary blot in 20× standard sodium citrate (SSC) buffer.
TRFs were then hybridized to a digoxigenin-labeled telomeric specific probe (DIG), incubated with a DIG-specific antibody covalently coupled to alkaline phosphate and visualized with a chemiluminescent substrate according to the manufacturer's protocol. Membranes were exposed on the Chemidoc imaging system (Bio-Rad) and analyzed using Quantity One Software (Bio-Rad).
Real-Time PCR Analysis for Telomerase Activity
Telomerase activity of 10 CV, 10 AF, and 6 BM samples was quantified using real-time PCR (TeloExpress Quantitative Telomerase Detection Kit, Elettrofor), which measures the increase in SYBR green fluorescence upon binding to DNA. The extent of repeat amplification is directly proportional to telomerase activity. Briefly, 5 × 10⁵ cells were lysed in Lysis Buffer (Elettrofor) and frozen at −80°C until use. The protein concentration of the extracts was assessed by absorbance at 595 nm after the addition of Bradford Dye Concentrate (USB Corporation, Cleveland, OH, USA). A standard curve was generated following the microassay procedure described in the Bio-Rad Protein Assay Kit (Bio-Rad).
The PCR assay was performed using 1 μl protein extract (8.8–1.100 ng/μl) and a positive control (Telomerase Positive Control Cells, Elettrofor) in a Bio-Rad iCycler TM optical module system. The thermal cycling conditions started with a 20-min incubation at 25°C and a 10-min denaturation step at 95°C, followed by 35 cycles of 95°C for 30 s and 60°C for 90 s. A standard curve was generated with serial dilutions of an oligonucleotide standard (TeloExpress Telomerase Control Oligo, Elettrofor); the curve was used to determine the quantity of telomerase products.
Real-Time PCR for Quantification of hTERT, c-myc, and p53 Transcripts
Real-time PCR assays of 10 CV, 10 AF, and 6 BM samples were developed to quantify either all hTERT transcripts (hTERT-AT) or the full-length transcript only (hTERT-FL), which contains the sites encoding the function of the hTERT protein. The forward and reverse primers AT were 5′-CGGAAGAGTGTCTGGAGCAA-3′ and 5′-GGATGAAGCGGAGTCTGGA-3′, respectively, and the forward and reverse primers FL were 5′-TGTACTTTGTCAAGGTGGATGTGA-3′ and 5′-GCTGGAGGTCTGTCAAGGTAGAG-3′, respectively. The fluorogenic probes AT (FAM 5′-TTGCAAAGCATTGGAATCAGACAGCAC-3′ BHQ1) and FL (FAM 5′-AACCCCAGAACACGTACTGC-3′ BHQ1) were produced by Sigma Genosys (Sigma-Aldrich) (28).
The standard reference curve for quantification of hTERT-AT and hTERT-FL transcripts was generated using sixfold dilutions of the hTERT amplicon, reverse transcribed from RNA isolated from HeLa cells. The cDNA was amplified using the forward primer (5′-AAGTTCCTGCACTGGCTGATG-3′) and reverse primer (5′-CGCAAACAGCTTGTTCTCCAT-3′). Real-time PCR assay of 10 CV, 10 AF, and 6 BM samples was developed to quantify c-myc transcript. The forward primer 5′-TTCGGGTAGTGGAAAACCAG-3′ and reverse primer 5′-CAGCAGCTCGAATTTCTTCC-3′ were designed by Primer3 software (http://frodo.wi.mit.edu/primer3/). The fluorogenic probe was FAM 5′-CCCTCAACGTTAGCTTCACC-3′ BHQ1.
The standard reference curve for quantification of c-myc transcript was generated using sixfold dilutions of the c-myc amplicon, reverse transcribed from RNA isolated from a healthy bone marrow cells. The cDNA was amplified using the forward primer 5′-TCGGGGCTTTATCTAACTCG-3′ and reverse primer 5′-TAGGAGGCCAGCTTCTCTGA-3′. The transcript levels were normalized for the expression of GAPDH constitutive gene. A standard GAPDH reference curve was used to calculate GAPDH copy number. The primers used for GAPDH amplification were forward 5′-CCTGTTCGACAGTCAGCCG-3′ and reverse 5′-CGACCAAATCCGTTGACTCC-3′. The fluorogenic probe was FAM 5′-AGCCACATCGCTCAGACACCATGG-3′ BHQ1.
Real-time PCR assay of 10 CV, 10 AF, and 6 BM samples was used to quantify p53 transcript. Genes amplifications primers/probe sets were provided from Taq-Man Gene Expression Assay (Applied Biosystems, Foster City, CA; assay ID: p53: Hs00153349_m1, GAPDH: Hs99999905_m1). The standard reference curve for quantification of p53 transcript was generated using sixfold dilutions of the p53 amplicon, reverse transcribed from RNA isolated from healthy bone marrow cells. The cDNA was amplified using the forward primer 5′-CATGAGCGCTGCTCAGATAG-3′ and reverse primer 5′-TCAGTCTGAGTCAGGCCCTT-3′. All real-time PCR reactions were performed using a Bio-Rad iCycler optical module system in a 25 μl mixture containing 12.5 μl Hot Star Taq Master Mix (Qiagen), 100 nM fluorogenic probe, 300 nM each primer, and 2 μl cDNA. After 20 min at 95°C, 50 cycles of 15 s at 95°C and 1 min at 60°C were run. Samples were run in duplicate.
Karyotype Analysis
Cytogenetic evaluation was conducted on cells from 6 BM samples after six passages and from 10 CV and 10 AF samples after six and 10 passages. Cells were harvested from a confluent flask, then transferred to petri dishes with a glass slide and expanded in 2 ml of Chang medium (Irvine Scientific). After 24–48 h, the cells were exposed to 200 μl colchicine (Karyomax Colcemid 10 μg/μl) for 1.5–2 h and to 0.075 M KCl for 25 min. Slides were fixed in methanol/acetic acid (3:1) solution, subjected to QFQ banding, and then examined using a Zeiss Axioplan 2 (Carl Zeiss AG, Gottingen, Germany) epifluorescence microscope. Images of meta-phase chromosome spreads were captured and analyzed by PSI MacKtype 4.5 software (PSI, Perceptive Scientific Instruments, Inc.). Karyotypes were described following the recommendations of the 2005 International System for Human Cytogenetic Nomenclature (25).
Statistical Analysis
The data were presented as means ± SDs and analyzed by Student's t-test. The differences were considered statistically significant for p < 0.05.
Results
Expansion Potential
We isolated homogeneous plastic adhesive populations of spindle-shaped MSCs from CV and AF cultures after the first passage, without contamination of maternal cells. Primary cultures of AF MSCs exhibited populations of large, rounded cells and fibroblast-like cells. These rounded cells disappeared after the first passages; a homogeneous spindle-shaped cell population continued to proliferate, forming confluent monolayers until cellular senescence was reached.
Fetal cells showed significant proliferation potential under the culture conditions described in Materials and Methods. MSCs isolated from fetal tissues exhibited a higher expansion capacity than BM-derived MSCs and maintained a constant growth rate from the primary passage until cells ceased to replicate.
The number of cells from CV and AF, which were obtained immediately after the isolation as described in Materials and Methods, was on average 8.7 × 10⁴ (range, 0.5–1.68 × 10⁵) and 8.8 × 10⁴ (range, 0.39–1.49 × 10⁵), respectively.
CV cells achieved 14 ± 0.9 logs (46.48 ± 2.98 PDs) of expansion over 118 days and 11 passages, while AF cells achieved 21 ± 0.9 logs (69.72 ± 2.98 PDs) of expansion in the same culture time after 15 passages. BM cells, meanwhile, expanded 11 ± 0.4 logs (36.52 ± 1.33 PDs) in 84 days after nine passages (Fig. 1).
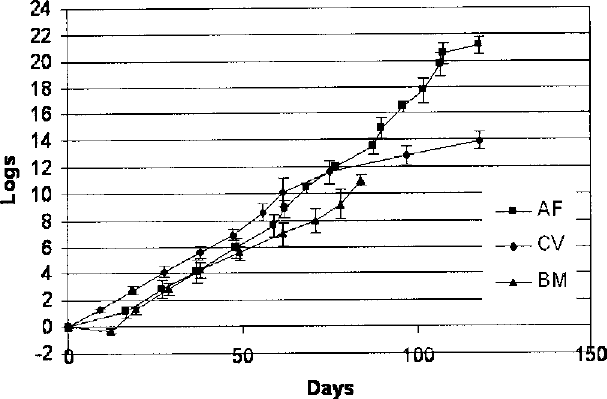
Growth curve for long-term cultured MSCs, defined as log of expansion before observation of senescence. Results were calculated as average values from 10 CV, 10 AF, and 6 BM cell lines at all passages ± SD. Each point on the growth curve represents a single passage of culture.
At passage 8, the expansion rate of the AF and CV cells was higher compared with BM. The proliferation was 12 logs after 77 days for AF, 10.2 after 61 days for CV, and 8.8 logs after 78 days for BM. The differences between the growth rate of all cell types investigated was statistically significant (p < 0.05). Moreover, BM reached a senescence phase at passage 9, while CV and AF continued to proliferate. CV cells at passage 11 and AF at passage 15 lost their capacity to divide and reached the senescence phase. Senescent cells exhibited larger and flatter morphology than their actively dividing counterparts. Cells from all the experiments died progressively during the senescence period and detached spontaneously from the flasks.
Immunophenotype Analysis
The phenotype of fetal cells was analyzed from the first to the last passage and compared with that of the BM cells. A similar pattern of surface markers was observed in both cell lines throughout the expansion. Fetal cells consistently stained positive for CD90, CD105, CD73, CD44, CD13, and CD29, which are surface antigens typical of MSCs, and negative for CD117, CD271, CD31, CD34, CD133, CD45, and CD14 (Fig. 2).

FACS analysis of surface antigen markers on long-term cultured MSCs. The open histograms indicate negative controls. Results are representative of one independent experiment of AF cells at passage 4 of culture.
AF and CV cells showed a constant immunophenotype from the first to last passages of culture, while BM cells began to lose hematopoietic markers and express mesenchymal surface antigens after the third passage (data not shown).
Differentiation Capability of MSC
We investigated the potential for adipogenic, osteogenic, and chondrogenic differentiation in all MSC types tested, after four, six and eight passages. BM cells were able to differentiate into the three lineages tested at all passages. CV and AF cells showed poor adipogenic potential with few and small fat vacuoles observed in cells treated with adipogenic media. However, they were able to differentiate into the two other lineages, with a differentiation potential analogous to that of BM cells, at all passages tested (Fig. 3). There was no differentiation capability in control cultures not induced in differentiation (data not shown).
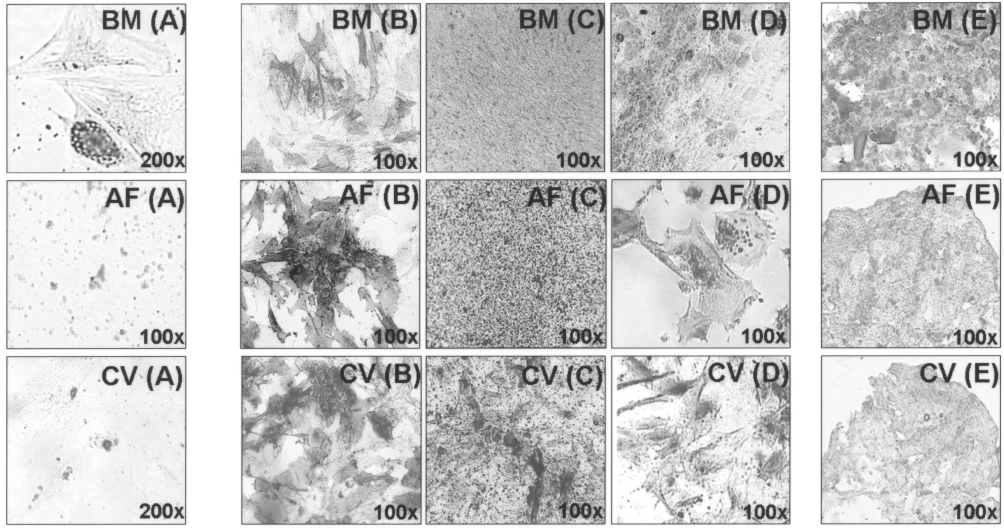
Differentiation capacity of MSCs. Adipogenic differentiation as determined by Oil red O staining (A). Osteogenic differentiation staining as determined by alkaline phophatase (B), Von Kossa (C), and Alizarin red S staining (D). Chondrogenic differentiation as determined by aggrecan staining (E). Results are representative of one independent experiment of BM, AF, and CV cells at passage 4.
Moreover, we investigated the expression of chondrogenic- and osteogenic-specific markers. RT-PCR analysis showed expression of COMP, extracellular matrix proteins of cartilage tissue, and OCN, typical markers of the osteogenic differentiation, in all fetal and adult MSCs tested at passages 4, 6, and 8. β-Actin was used as an internal control (Fig. 4).

Expression profile of AF (lane 1), CV (lane 2), and BM (lane 3) cells for chondrocyte-related gene COMP, cartilage oligomeric matrix protein (A) and osteocalcin OCN, typical markers of the osteogenic differentiation (B). The expression of β-actin was used as RT-PCR control (C) and lane 5 was negative control. Chondrocytes (lane 4) in (A) represents the positive control for COMP and osteocytes (lane 4) in (B) represents the positive control for OCN. Lane L represents the DNA ladder 50 bp. Results are representative of one independent experiment at passage 4.
Anchorage-Independent Growth Assay
CV, AF, and BM cells from all the samples showed no anchorage-independent growth in soft agar after 2 weeks, indicating no malignant transformations. On the contrary, A549 cell line, lung carcinoma cells, showed colony formation in soft agar assay, as positive control (Fig. 5).
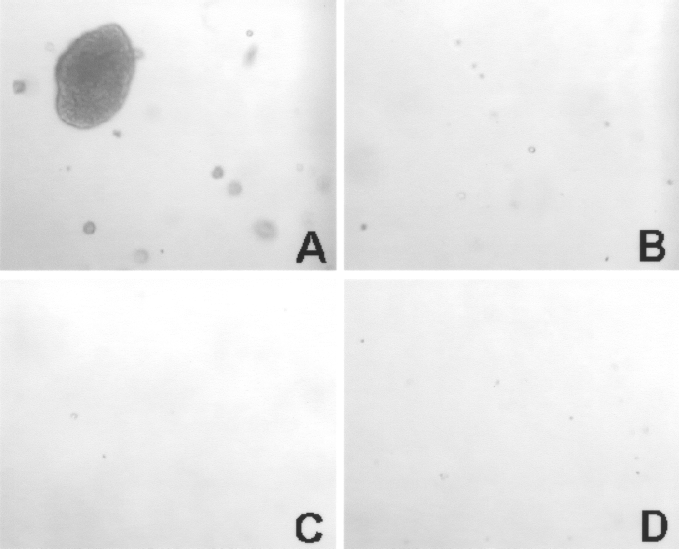
Soft agar assay of fetal and adult MSCs at passage 6. The positive control cell line A549 produced numerous colonies (A). MSCs did not form colonies in soft agar of BM (B), CV (C), and AF (D).
Telomere Length, Telomerase Activity, and hTERT Gene Transcription Analysis
A terminal restriction fragment assay (TRF) was performed for CV, AF, and BM cells at the first and last passage to evaluate the effect of long-term culture on replicative stability. MSCs from all sources tested showed significantly longer telomeres than were seen in the positive control. Our results indicated that in all fetal samples, the TRF length remained stable during the entire culture period (<1 kb change in late cultures), while BM cells exhibited some telomere shortening (<2 kb change in late cultures). The average telomere lengths at the beginning and end of the culture period were 13.42 ± 0.34 versus 12.71 ± 0.68 kb for AF cells, 12.30 ± 1.03 versus 12.14 ± 0.96 kb for CV cells, and 10.72 ± 0.31 versus 9.03 ± 0.01 kb for BM cells (Fig. 6).

Southern blot analysis of telomere length in long-term cultured hMSCs. Results are representative of one independent experiment with AF, CV, and BM cells at first and late passages. HeLa cells were used as positive controls.
We excluded the presence of alternative mechanisms of telomere maintenance (ALT) by the pattern of TRF length distribution. In fact, we did not observe any ALT-type telomeres, which are extremely long and heterogeneous, in the MSCs (9).
MSCs obtained from all donors were tested at an early passage (P2) and later passages (P11, P15, P9 in CV, AF, and BM, respectively) for telomerase activity and hTERT gene transcription. We tested not only the hTERT full-length transcript, but also additional splice variants. Very low levels of telomerase activity (an average of 0.00008 attomol/μl for CV, 0.0004 attomol/μl for AF, 0.00005 attomol/μl for BM) were observed; we considered this a negative result as confirmed by hTERT analysis. No expression of any hTERT transcripts was observed in any of the MSCs, further demonstrating the absence of telomerase activity. HeLa and HL-60, positive controls cell lines, showed high level of hTERT expression. The ratio between the number of FL copies/1 × 106 of GAPDH copies was 200.8 in HeLa and 419 in HL-60, and the ratio between the number of AT copies/1 × 106 of GAPDH copies was 1439.8 in HeLa and 3088 in HL-60. Mononuclear cells isolated from healthy bone marrow were used as negative control and showed low level of hTERT expression, 20.2 FL copies/1 × 106 of GAPDH copies and 208 AT copies/1 × 106 of GAPDH copies.
The c-myc transcript, gene activating telomerase activity, was quantified by real-time PCR assay in CV, AF, and BM samples at passage 3 and 7.
The ratio between the c-myc copy number/GAPDH copy number in CV, AF, and BM was 0.010 ± 0.007, 0.016 ± 0.004, 0.027 ± 0.011, respectively, at passage 3 and 0.014 ± 0.007, 0.006 ± 0.004, and 0.011 ± 0.007 at passage 7. The ratio remained stable and much lower than HL-60 (0.09) and HeLa cell line (0.322), positive controls, at all passages tested.
The p53 transcript was quantified by real-time PCR assay in CV, AF, and BM samples at passage 3 and 7. The ratio between p53 copy number/GAPDH copy number in CV, AF, and BM was 0.059 ± 0.003, 0.058 ± 0.005, 0.026 ± 0.002, respectively, at passage 3 and 0.058 ± 0.002, 0.18 ± 0.005, and 0.048 ± 0.003 at passage 7. The control cell line HL-60, as expected, did not expressed p53 transcript.
Karyotype Analysis
A median of 50 metaphases (range 16–75) were analyzed for each sample at approximately the 350–450 band level. Karyotypes were analyzed after passages 6 and 10 for 10 CV and 10 AF samples and after passage 6 for 6 BM samples. In all investigated cells no clonal abnormalities, no structural abnormalities, and no numerical abnormalities (loss of the same chromosome in three or more metaphases or gain of the same chromosome in two or more metaphases) were found (Fig. 7).

The karyotypes of CV, AF, and BM MSCs revealed chromosomal stability, after long-term culture. Results are representative of one independent experiment of CV, AF, and BM cells at passage 6.
Discussion
The biological features and the absence of ethical issues concerning the applications of fetal MSCs suggest that these cells might be promising candidates for tissue engineering and stem cell therapy (6).
In this study, we have successfully expanded MSCs isolated from human CV during the first trimester of gestation and from AF during the second trimester of gestation.
Fetal MSCs had immunophenotypic characteristics similar to those of MSCs derived from other fetal and adult sources (5,17,19), with high expression of CD90, CD105, CD44, CD73, CD29, and CD13 and no expression of CD45, CD14, CD31, CD34, CD133, CD117, or CD271. In agreement with Bernardo et al. (3), all MSCs tested maintained the typical spindle shape and a constant growth rate, and no immunophenotypic abnormalities were observed during the course of culturing. Conflicting evidence about the transformation propensity of hMSCs was observed by Rosland et al. (20). In this study, the authors reported spontaneous malignant transformation in human BM, showing a significantly increased proliferation rate, and altered morphology and phenotype. Transformed MSCs showed increased expression of CD44 and CD166, whereas CD105 was slightly downregulated. Some markers used to identify MSCs, such as CD73, CD90, and Stro-1, were undetectable in these cells.
CV and AF cells can be induced to differentiate into mesenchymal lineages, even if they were frozen and thawed. They can differentiate toward osteogenic and chondrogenic lineages, after four, six and eight passages, although they showed poor adipogenic differentiation potential. Fetal and adult MSCs expressed molecular markers of ostegenic and chondrogenic differentiation, at all passages tested.
Compared with adult MSCs, fetal tissues have characteristics that appear to be advantageous for cell therapy, in terms of expansion potential and accessibility. Instead, for all the experiments we only used discarded cells taken from cytogenetic analysis. However, their biosafety needs to be investigated carefully. To exclude the occurrence of functional or genetic alterations, we studied long-term in vitro expansion of MSCs.
Our results indicated that MSCs from all sources tested had telomeres longer than bone marrow MSCs. In all CV and AF samples, the TRF length remained stable over the culture period, while there was some telomere shortening in BM cells (<2 kb) in late cultures. We did not observe any evidence of telomerase activity at any time point in any of the cell lines tested. Moreover, in agreement with Bernardo et al. (3), real-time PCR failed to provide evidence of any hTERT transcript expression, indicating that the absence of telomerase activity in cultured MSCs could be ascribed to a lack of hTERT gene transcription. Several authors have expressed concerns about the potential risk of the transformation of telomerase-positive MSCs (15,21,29). Previous publications have shown that c-myc protein overexpression is linked to transformation in human MSCs (21,22). On the contrary, absence or decreased p53 expression is well known to be relevant for the process of neoplastic transformation of various cell types (26). We found a very lower and stable c-myc expression in cultured MSCs when compared to HL-60 and HeLa control cell lines, at different time points tested. On the contrary, p53 was expressed by MSCs and it was completely absent in HL-60 cell line, as expected.
The stability of telomere length, the lack of telomerase activity, and the absence of hTERT transcripts observed after significant expansion here suggest that these cells are not prone to transformation under in vitro culture conditions. However, we analyzed MSCs after a high proliferation rate and prolonged culture in vitro and they did not show any cytogenetic alterations. The presence of a normal karyotype excluded alternative lengthening of telomeres (ALT) as the mechanism responsible for the absence of telomere erosion. The pattern of TRF length distribution further excluded ALT as MSC telomeres were not extremely long and heterogeneous.
Tarte et al. (27) investigated genetic features of BM expanded MSCs. These data suggested that MSCs could exhibit recurring chromosomal alterations independent of the culture process, but at least in part donor dependent. Therefore, genetic alterations of MSCs were not associated with a selective growth advantage in vitro and conferred a growth disadvantage to abnormal cells, likely linked to DNA damage-associated senescence. All MSCs, with or without aneuploidy, became senescent, without transformation features. In our results no clonal abnormalities, no structural abnormalities, and no numerical abnormalities (loss of the same chromosome in three or more metaphases or gain of the same chromosome in two or more metaphases) were found.
Guillot et al. (8) showed that MSCs from neonatal and midgestational fetal tissues exhibit faster growth than do adult MSCs. In that study, they demonstrated that human first-trimester fetal blood, liver, and BM MSCs had longer telomeres, greater telomerase activity, and expressed more telomerase reverse transcriptase than their adult counterparts. They obtained TRFs of 11, 10.8, and 11.2 kb in length from fetal blood, fetal liver, and fetal BM MSCs, respectively.
Human adipose tissue-derived MSCs and murine BM-derived MSCs have been shown to undergo spontaneous transformation after numerous passages in culture with a concomitant increase in telomerase activity (21). Rubio et al. (21) reported that after long-term (4–5 months) in vitro expansion, adipose tissue-derived human MSC populations can become immortalized and transform spontaneously. These cells escape crisis phase spontaneously and continue to proliferate. During this process, MSCs exhibit a change in membrane markers and display chromosome instability. They also exhibit a change in morphology, transitioning from an elongated spindle shape to a small, compact morphology. In our study, fetal MSCs maintained their typical morphology and no immunophenotypic abnormalities were observed during the culture time. These cells reached senescence, but did not bypass the crisis phase and experienced cell cycle arrest. Telomerase activity and hTERT transcription were not detectable in either fetal MSC line at any time point of culture. These data concur with reports linking crisis bypass and cell immortalization with telomerase expression or telomerase-independent mechanisms of telomere maintenance (7).
Zhao et al. (31) described a profile of telomere regulation by the cell cycle-dependent expression of telomerase in MSCs isolated from BM. To address whether telomerase expression was correlated with a specific phase of the cell cycle, they induced hMSC synchronization and monitored the time course of telomerase activity and expression of hTERT mRNA or protein. No detectable telomerase activity could be found in asynchronously dividing hMSCs. However, when cells were synchronized in S phase, positive telomerase activity appeared at 40 h, peaked at 52 h and then declined gradually. In agreement with these data, we detected no telomerase activity or hTERT transcripts. Our results indicated no telomere shortening in fetal MSCs, so we can hypothesize that the expression of active telomerase was cell cycle dependent. Thus, the transient expression of telomerase in hMSCs may play a physiological role in maintaining telomere integrity. Similarly, Jo et al. (13) studied MSCs isolated from umbilical cord blood during extensive expansion and showed stable telomerase activity at all passages examined.
Furthermore, Avanzini et al. (1) demonstrated the genetic stability of MSCs derived from umbilical cord blood. These cells did not appear to express telomerase catalytic activity or hTERT transcription. Low or undetectable levels of telomerase activity have been found in human adult stem cells, including hematopoietic and nonhematopoietic stem cells as diverse as neuronal, skin, intestinal crypt, mammary epithelial, pancreas, adrenal cortex, kidney, and MSCs. Telomerase is upregulated in committed progenitor cells, which have high reproductive capacity, but even these levels are insufficient to stably maintain telomere length (11). In contrast, cancer stem cells with the capacity of indefinite self-renewal and proliferation have stable telomeres and high levels of telomerase activity (10).
Throughout the literature (2), telomere length analysis suggests a clear correlation between the proliferative capacity of MSCs and telomere length. Human BM MSCs seem to lose telomere length at each cell division until they reach a threshold of around 10 kb, at which point cells stop dividing and assumed a senescent phenotype.
We observed that CV and AF cells have longer telomere lengths than adult MSCs, and no telomere shortening, even through the senescence phase, was observed.
Fetal MSCs can be expanded long term with no increase in telomerase activity and no evidence of genetic changes. The telomere length stability and the absence of karyotype alterations suggested that fetal MSCs were not susceptible to malignant transformation after fast expansion. These results are encouraging for potential clinical applications of these cells. Fetal MSCs, as described here, represent a developmentally less mature population of stem cells with advantages over adult MSCs. These cells could be a relatively easily accessible resource for cell therapy and regenerative medicine.
Footnotes
Acknowledgments
This work has been supported by grants from Associazione Italiana contro le leucemie, linfomi e mielomi (AIL), sezione di Ancona-ONLUS.