
Abstract
In recent studies using a rat aortic balloon occlusion model, we have demonstrated that spinal grafting of rat or human neuronal precursors or human postmitotic hNT neurons leads to progressive amelioration of spasticity and rigidity and corresponding improvement in ambulatory function. In the present study, we characterized the optimal dosing regimen and safety profile of human spinal stem cells (HSSC) when grafted into the lumbar spinal cord segments of naive immunosuppressed minipigs. Gottingen-Minnesota minipigs (18–23 kg) were anesthetized with halothane, mounted into a spine-immobilization apparatus, and received five bilateral injections of HSSC delivered in 2, 4, 6, 8, or 10 μl of media targeted into L2-L5 central gray matter (lamina VII). The total number of delivered cells ranged between 2,500 and 100,000 per injection. Animals were immunosuppressed with Prograf® for the duration of study. After cell grafting, ambulatory function was monitored daily using a Tarlov's score. Sensory functions were assessed by mechanically evoked skin twitch test. Animals survived for 6–7 weeks. Three days before sacrifice animals received daily injections of bromodeoxyuridine (100 mg/kg; IV) and were then transcardially perfused with 4% paraformaldehyde. Th12-L6 spinal column was then dissected; the spinal cord was removed and scanned with MRI. Lumbar transverse spinal cord sections were then cut and stained with a combination of human-specific (hNUMA, hMOC, hNSE, hSYN) or nonspecific (DCX, MAP2, GABA, CHAT) antibodies. The total number of surviving cells was estimated using stereological quantification. During the first 12–24 h after cell grafting, a modest motor weakness was observed in three of eight animals but was no longer present at 4 days to 7 weeks. No sensory dysfunction was seen at any time point. Postmortem MRI scans revealed the presence of the individual grafts in the targeted spinal cord areas. Histological examination of spinal cord sections revealed the presence of hNUMA-immunoreactive grafted cells distributed between the base of the dorsal horn and the ventral horn. In all grafts intense hMOC, DCX, and hSYN immunoreactivity in grafted cells was seen. In addition, a rich axodendritic network of DCX-positive processes was identified extending 300–700 μm from the grafts. On average, 45% of hNUMA-positive neurons were GABA immunoreactive. Stereological analysis of hNUMA-positive cells showed an average of 2.5- to 3-fold increase in number of surviving cells compared with the number of injected cells. Analysis of spinal structural morphology showed that in animals injected with more than 50,000 cells/injection or volumes of injectate higher than 6 μl/injection there was tissue expansion and disruption of the local axodendritic network. Based on these data the safe total number of injected cells and volume of injectate were determined to be 30,000 cells delivered in ≤6 μl of media. These data demonstrate that highly reproducible delivery of a potential cell therapeutic candidate into spinal parenchyma can be achieved across a wide range of cell doses by direct intraspinal injections. The resulting grafts uniformly showed robust cell survival and progressive neuronal maturation.
Introduction
Several spinal neuropathological conditions can lead to region-specific neuronal degeneration and resulting loss of neurological function. Depending on the phenotype of the injured/lost neurons and the functional network in which they are involved, such a neurological dysfunction can be qualitatively expressed as paraparesis or fully developed spastic or flaccid paraplegia with a possible degree of sensory dysfunction such as hypoalgesia or allodynia. Accordingly, the pathological conditions leading to the development of these distinct pathological states can be divided into several categories depending on the profile of neuronal loss.
First are those conditions that cause preferential degeneration of small and medium-sized interneurons. In this category, transient spinal cord ischemia has been shown to lead to a selective degeneration of inhibitory interneurons (but with continuing presence of functional α-motoneurons) (25,28,39,40,44). Neurologically the functional deficit in such animals as well as in humans is typically expressed as chronically increased muscle tone (i.e., rigidity), and combined with a stimulus-dependent increase in muscle activity (i.e., spasticity) (17,20,26). Second are those conditions that lead to a selective degeneration of α-motoneurons and corresponding loss of motor tone. Among those, amyotrophic lateral sclerosis (ALS) has been shown to lead to a progressive degeneration of cervical and lumbar α-motoneurons and resulting loss of ambulatory function and ultimately respiratory failure (14,38,47). Third, a selective loss of small inhibitory interneurons localized in the dorsal horn has been described to be involved in part in the development of chronic pain states after peripheral nerve injury (19,37). A separate category is presented by the pathologies that lead to the loss of local myelin (such as seen in multiple sclerosis) and resulting loss of signal conductivity (41).
In previous studies, we have demonstrated that spinal grafting of rat or human spinal neuronal precursors or fully postmitotic hNT neurons is associated with a significant improvement of neurological function in rats after spinal ischemic injury (8,27). Previous reports also describe long-term survival, integration with the host tissue, and functional improvement after spinal grafting of neural precursors or postmitotic neurons in mice or rat spinal injury models or in an ALS transgenic rat model (1,3,22,29–31,34,46,49,52). Jointly, these data suggest that region-specific grafting of neural or neuronal precursors can represent a viable approach for cell replacement therapy intended to modulate a functional deficit particularly when the dysfunction results from a well-defined cell loss.
While there are numerous spinal grafting studies that use rat or mouse degenerative models, there are considerably fewer studies that employ large animals such as cat, dog, minipig, or primates (7,18,33,42,48). Accordingly, there are no systematic data defining the possible differences in the differentiation and survival profile of the same cell line when grafted in larger species. Indeed, prominent differences exist in spinal cord dimensions across species ranging from the commonly employed mouse and rat models to humans. Aside from simple implant survival in different species, it is not clear how spinal dimensions will influence the magnitude of sprouting. It is reasonable to conclude that such information may well impact the number of cells necessary to produce a physiologically relevant contribution after replacing the lost neuron population. Thus, prior to human use, larger animal models must be validated so as to serve in developing optimal cell delivery protocols.
Accordingly, in the present toxicity–dosing study, we characterized the survival and differentiation profile of human spinal stem cells when grafted into the lumbar spinal cord of naive immunosuppressed minipigs. We chose the minipig because of its availability, spinal dimensions, and, as compared to primates, its cost effectiveness. The overall goals of the study were to define: i) the optimal total number of grafted cells per injection as defined by the integrity of the host spinal cord tissue and local inflammatory changes; ii) the optimal volume of the individual injections; and iii) corresponding changes in neurological function associated with spinal grafting.
Materials and Methods
These studies were carried out under protocols approved by the Institutional Animal Care and Use Committee of the Czech Academy of Sciences and were in compliance with The Association for Assessment of Laboratory Animal Care guidelines for animal use. All studies were performed in such a manner as to minimize group size and animal suffering.
Derivation of the Spinal Human Spinal Stem Cells (HSSC)
Human SSCs were prepared from the cervical upper thoracic region of spinal cord tissue obtained from a single 8-week human fetus after an elective abortion. The fetal tissue was donated by the mother in a manner fully compliant with the guidelines of NIH and FDA, and approved by an outside independent review board. The spinal cord tissue was removed of meninges and dorsal root ganglia, and dissociated into a single cell suspension by mechanical trituration in serum-free, modified N2 media. The modified N2 media was composed of: 100 mg/L human plasma apo-transferrin, 25 mg/L recombinant human insulin, 1.56 g/L glucose, 20 nM progesterone, 100 μM putrescine, and 30 nM sodium selenite in DMEM/F12. For growth of the HSSC, 10 ng/ml bFGF as the sole mitogen was added to the modified N2 media (growth media). The initial culture was serially expanded as a monolayer culture in precoated flasks (T-175) or plates (150 mm, Nunc) (16). Briefly, the precoated vessels were prepared by incubating them for 1 h at room temperature with 100 μ/ml poly-d-lysine in 10 mM HEPES buffer at 0.165 ml/cm2. The vessels were washed three times with water and allowed to completely dry aseptically in the hood. They were then further incubated with 100 μg/ml fibronectin/PBS for 5 min or alternatively 25 μg/ml fibronectin/PBS for 1 h. The fibronectin solution was aspirated and the vessels were used immediately without drying.
Approximately 6.1 × 10⁶ total cells were obtained upon the initial dissociation of the spinal cord tissue. All of the cells were plated onto one 150-mm plate in 20 ml of the growth media. The growth media was changed every other day and on the alternate days 10 ng/ml of bFGF was directly added to the culture. The first passage was conducted 16 days after plating. At this point, the culture was composed mostly of postmitotic neurons and mitotic HSSC. The mitotic cells were harvested by brief treatment with trypsin (0.05% + 0.53 mM EDTA). Trypsin was stopped by addition of soybean trypsin inhibitor to 0.05% final concentration. The cell suspension was triturated with a pipette to obtain a single cell suspension and centrifuged at 1400 rpm for 5 min. The cell pellet was resuspended in growth media and the cells were replated in new precoated plates at 1.2 × 10⁶ cells in 20 ml of growth media per 150-mm plate. The cells were harvested at approximately 75% confluence, which occurred in 5–6 days. This process was repeated for 20 passages. At various passages, the cells were frozen in the growth medium plus 10% DMSO at 5 × 10⁶-10 × 106 cells/ml using a programmable freezer. The frozen cells were stored in liquid nitrogen. Upon thawing, the overall viability and recovery was typically 80–95%. The resulting cell line, which was produced by epigenetic means only, using bFGF as the sole mitogen, was named “566RSC.” A cell bank of passage 16 cells was prepared and used for this study (see below).
To characterize the phenotype of HSSC after in vitro differentiation, cells were cultured on poly-d-lysine/fibronectin-coated chamber slides (LAB-TEK, IL) in the presence of DMEM/F12 + 10% FBS for 3 weeks. Cells were then fixed with 4% paraformaldehyde and stained with a combination of doublecortin (1:1000, Chemicon), MAP2 (1:1000; Chemicon), or GFAP (1:1000; Chemicon) antibodies using a standard immunofluorescence protocol (Fig. 1).

Human spinal stem cells cultured on poly-D-lysine/fibronectin-coated chamber slides in the presence of 10% FBS for 3 weeks show differentiation towards DCX- or MAP2-positive neurons (A: DCX—green; C: MAP2—green), and GFAP-immunore-active astrocytes (B: GFAP—red).
General Animal Preparation
Minipigs resulting from cross-breeding of Minnesota and Gottingen strains (both sexes; 18–23 kg) were pre-medicated with intramuscular azaperonum (2 mg/kg) and atropine (1 mg/kg; Biotika, SK) and then induced with ketamine (20 mg/kg; IV). After induction, animals were intubated with a 2.5F tracheal tube. Anesthesia was maintained with 1.5% isoflurane in 50%/50% air/oxygen mixture at a constant 2 L/min flow rate. Oxygen saturation was monitored throughout the procedure using a pulse oximeter (Nellcor Puritan Bennett Inc., Ireland). After induction of anesthesia, animals were placed into a supine position with all four extremities fixed to the operating table. The left jugular vein was exposed and catheterized with an 18-gauge central venous catheter (Certofix Mono V 330; B Braun, Germany). The end of the catheter was externalized on the side of the neck. Animals were then placed into a prone position and prepared for spinal cell grafting (see following paragraph). All surgical interventions followed rigid aseptic procedures. All materials were subjected to autoclaving or gas sterilization.
Immobilization of the Lumbar Spinal Cord and Dorsal L2-L4 Laminectomy (Fig. 2)
To immobilize the lumbar spinal cord, a spinal immobilization apparatus was designed and constructed. It consists of a stainless steel platform (20” × 35”), four vertical bars (2” × 2” and 15' tall), and four horizontal bars. To achieve immobilization of the lumbar spine, the lumbar portion of the animal was lifted 5′ above the operating table and four horizontal bars were slid bilaterally against the lateral portion of the vertebral column just ventral to the L3-L5 paravertebral muscle (Fig. 2B, B'). The skin was left intact. A dorsal laminectomy of L2-L5 vertebrae, corresponding to L3-L6 spinal segments, was then performed and epidural fat removed using cotton swabs. The dura was left intact.

(A) Schematic diagram illustrating the distribution of spinal cord injections in all experimental groups. The distance between injections was more than 1000 μm to permit identification of individual injections. (B, B') To permit spinal injections, the vertebral column is immobilized by using an external spinal immobilization apparatus. (C) In some animals a residual hematoma was found at the site of injections (red arrow). (D) No detectable macroscopic changes were noted in the appearance of the injected spinal cord segments once the dura was removed.
Immunosuppressive Treatment
Immediately after jugular vein catheterization the animals received a bolus (0.1 mg/kg; IV) injection of Prograf® followed by 0.025 mg/kg delivered in 12-h intervals. Prograf® plasma concentration was monitored at 2-day intervals for the first 10–14 days and then at 7-day intervals for the duration of the study using RIA assay. Targeted plasma concentration was 30 ng/ml.
Cell Preparation and Spinal Cell Injections
Three days before grafting HSSC were shipped at −70°C (Neuralstem Inc., MD) to the animal grafting facility. Prior to injections, cells were washed two times in 37°C DMEM, centrifuged, and resuspended in DMEM. Before and after implantation the viability of cells was tested using fluorescein diacetate/propiodium iodide or trypan blue technique. On average, 80–90% viable cells were counted. Three experimental groups were used. In the first group (group A, n = 4), cells were delivered in a fixed volume (2 μl) with increasing total cell number per injection (2,500, 5,000, 10,000, 50,000, or 100,000 cells). In the second group (group B, n = 4), cells were delivered in increasing volume of injections (2, 4, 6, 8, or 10 μl) and increasing total cell number (2,500, 5,000, 10,000, 50,000, or 100,000 cells) (Fig. 2A). In the third group (group C, n = 6), cells were delivered in a fixed volume (6 μl) and fixed total cell number (30,000 cells). The third group was performed after completion of groups A and B study, which identified the optimal cell engraftment criteria (i.e., local tissue injury, inflammation and cell distribution) for a specific injection volume and total cell number.
Each animal received a total of 10 injections (5 on each side) targeted into the intermediate zone (lamina VII) of L2–L5 segments. The distance between individual injections was 1–1.5 mm. In a preliminary study using transverse spinal cord sections prepared from L3–L4 segments of 18–23 kg minipigs, the distance from the surface of the spinal cord to the intermediate zone was measured to be 2.5 mm. The duration of the individual injections was 60 s followed by a 2-min period to allow sufficient distribution of the cells in the individual injection sites before the needle was removed and repositioned.
Spinal Cell Delivery
To deliver cells, the XYZ manipulator (M325; WPI, Sarasota, FL, USA) was used and mounted directly to the operating table. The three-directional range of the manipulator was 3 inches. A Hamilton syringe with a 30-gauge needle was then mounted into the manipulator and connected to the microinjector (Stoelting) using PE-50 tubing. To connect the PE-50 tubing to the Hamilton syringe, the plunger was removed and one end of the PE-50 tubing was inserted 1 cm into the syringe and sealed with silicone. The total length of the PE-50 tubing between the microinjector and the syringe was 35 cm.
Evaluation of Neurological Function
Motor functions were assessed according to a Tarlov's score: grade 0: spastic or flaccid paraplegia—no movement of the joints in the lower limbs; grade 1: slight movement of joints in the lower limbs; grade 2: good movement of joints but unable to stand; grade 3: ability to stand and walk but ataxia persists; grade 4: complete recovery, no detectable deficit. Sensory functions were assessed by the presence of the withdrawal response to a mechanical stimulus. The toes of the front and hind limbs were progressively compressed with Halsted forceps. Typically, partial application of forceps would evoke a vigorous withdrawal response, and the stimulus was stopped immediately. The response was scored as present or absent.
Bromodeoxyuridine (BrdU) Administration
Three days before sacrifice, animals received a daily bolus injection of BrdU (100 mg/kg, IV; Sigma). The solution was injected through the jugular vein catheter and then flushed with 10 cc of saline.
Perfusion Fixation In Vivo
At 6–7 weeks (groups A and B) or 4 weeks (group C) after cell grafting animals were deeply anesthetized with pentobarbital (100 mg/kg) and transcardially perfused with heparinized (4 U/ml) PBS (137 mM sodium chloride, 2.7 mM potassium chloride, 8 mM sodium phosphate dibasic, and 1.47 mM potassium phosphate monobasic), followed by 4% paraformaldehyde (5 L; pH 7.4). The spinal cords were then removed and postfixed for 24 h in 4% paraformaldehyde at 4°C. After postfixation, spinal cord tissue was cryoprotected in 10%, 20%, and 30% sucrose with 0.02% sodium azide and 10–40-μm-thick sections cut on a cryostat or vibratome. Before cryosectioning, lumbar spinal cords were imaged by MRI (see following paragraph).
Postmortem Magnetic Resonance Imaging
The excised spinal columns were imaged while immersed in perfluorocarbon (Solvay Solexis Bollate (MI), Italy). Images were acquired in a horizontal bore 7-T MRI (GE Medical Systems, Milwaukee, MN), with a 10-mm transmit/receive MR imaging surface coil using a 2D FSPGR sequence TR/TE = 10/2.9, FA 20°C, FOV 10 mm, matrix 160 × 128, and a slice thickness of 100 μm. Imaging time was 60 min.
Three-Dimensional Rendering and Anatomical Measurements
Volume and surface rendering of the image data sets was performed manually using AMIRA software (Mercury Computer Systems, Chelmsford, MA) to produce quantitative three-dimensional models. From these computed models, dimensions such as transplant volume and surface area at each transplant site can be determined.
Immunohistochemical Staining
Spinal cord sections were stained using standard immunostaining protocols. The abbreviated list and the description of the primary antibodies and the concentration used are summarized in Table 1. Detection of primary antibodies was performed by fluorescence-conjugated goat anti-rat, anti-rabbit, or anti-mouse secondary antibodies (Alexa 488, 594, 680; 1:250; Invitrogen). All blocking, primary, and secondary antibody preparations were made in 0.1 M PBS/0.2% Triton X-100 + 5% normal goat serum. Following a 3-h block (4°C), sections were incubated in primary antibody for 72 h at 4°C followed by three PBS washes (5 min each) and incubation with secondary antibody for 1 h at room temperature (RT). In control experiments, primary antibodies were omitted. For general nuclear staining, DAPI (1 μl/ml) was added to the final secondary antibody solutions. Slides were analyzed with Leica (DMLB) or Olympus Fluorescence microscope (DMLB). Images were obtained with Olympus or Hamamatsu firewire camera and processed (multiple color overlay) by Adobe Photoshop 7.0 (Adobe Systems, Mountain View, CA). In colocalization analyses, images were captured with an Olympus confocal microscope (Fluoview 1000). In general, optical sections spaced by 0.2–0.5 μm were taken. Digital images of blue, green, red, and far red fluorescence were captured for each optical section. The intensity values for each color were kept within the linear range of the camera. Objectives included 40x and 60x oil immersion (numerical aperture 1.3).
Summary of Primary Antibodies Used in Immunofluorescence Study

This antibody is distributed as human-specific antibody; however, it shows a strong cross-reactivity with the rat and porcine tissue.
Doublecortin is only expressed in embryonic spinal cord neurons but is not present in an adult spinal cord.
Stereological Quantification of Grafted Cells, Qualitative Immunofluorescence Staining, and Confocal Microscopy
The total numbers of grafted cells immunoreactive for the hNUMA antibody were estimated using stereological, unbiased, and systematic sampling (45). Every tenth previously stained section (30 μm thick) taken from animals in groups A and B were used for stereological quantification after applying fractionator sampling scheme. The optical images (1 μm thick) were obtained with a Leica DMLB microscope using a 100x oil objective with numerical aperture 1.3. The total number of grafted cells were then calculated by applying the fractionator formula N = Q × 1/hsf × 1/asf × 1/ssf, where N is a total number of positive nuclei, Q is sum of cells counted, hsf is the height sampling fraction, asf is area sampling fraction, and ssf is slice sampling fraction. Individual cell nuclei were counted by using an optical Dissector (Ellipse, SK). 3D reconstruction from Z-stack confocal optical images (0.5 μm thick) was done utilizing Improvision Volocity software Version 5.0.4. For qualitative immunofluorescence staining, sections prepared from animals receiving between 2,000 and 30,000 cells/injection were used.
Neuronal Quantification in Lumbar Spinal Cord in Mice and Pigs
Naive adult male laboratory mice (C57; 25–30 g; n = 3) and Gottingen-Minnesota minipigs (18–23 kg; n = 3) were terminally anesthetized and transcardially perfused with heparinized saline followed by 4% paraformaldehyde. Frozen transverse spinal cord sections taken from the L3-L5 segments (10 μm) were then prepared, mounted on silane-coated slides (Fisher), and stained with (Ms) anti-NeuN (Chemicon MAB377) 1: 1000, according to standard fluorescent immunohisto-chemical protocol. For quantification, a total of 10 sections were used, with approximately 100-μm spacing between sections. High resolution mosaic images of these sections were obtained with a Zeiss Observer Z1 microscope system with 40x objective using Zeiss AxioVision (Ver 4.7) software, Multidimensional Acquisition MosiaX feature. To facilitate consistent NeuN-positive nuclei counting between sections and species, images were analyzed using the Measuring and Counting feature of Image Pro Version 6.3 (Media Cybernetics) by defining a manual pixel intensity threshold specific for only positive nuclei. Total neuronal surface area (TNS; surface area occupied by NeuN-stained neurons) and gray matter surface area (GMS; surface area in which neurons are distributed) were also determined using calibrated parameters loaded into the Measuring and Counting feature, allowing for the calculation of TNS/GMS ratio (T/G). The primary goal of these quantitative studies were to provide comparative data on the neuronal numbers and the spatial distribution of neurons in the gray matter in commonly used small rodent and preclinical large animal model.
Identification of DCX Expression in Porcine Fetus
One female minipig was euthanized at 86 days of pregnancy. Fetuses were dissected from the uterus and perfusion fixed with 4% paraformaldehyde. For fixation the perfusion cannula was directly inserted into descending aorta and the aorta was then clamped just below the aortic bifurcation. Frozen transverse spinal cord sections (30–40 μm) were then prepared as described before and stained with a combination of DCX and NeuN antibodies.
Results
In Vitro Differentiation of HSSC
Staining of differentiated HSSC with hNUMA, DCX, MAP2, and GFAP antibodies revealed a mixed population of DCX/MAP2+ neurons and GFAP immunoreactive astrocytes at 3 weeks after induction (Fig. 1A–C).
Neurological Assessment
All grafted animals in groups A and B showed near normal motor function upon recovery from anesthesia. In three of eight animals, slight ataxia and motor weakness was noted for the first 24 h (Tarlov score: 3) after surgery, but was no longer seen at intervals longer than 4 days after cell grafting. No detectable changes or deterioration of ambulatory function was then seen for the duration of study (4–7 weeks). Similarly, all animals showed normal responses to a peripheral nociceptive stimulus, which remained unchanged for the duration of the study. In group C, a similar neurological recovery was seen and all animals showed normal motor and sensory function at intervals longer than 1 week after grafting. No spontaneous vocalization was noted in any animal.
Macroscopic Examination of Grafted Spinal Cord Segments
Examination of the epidural space at the site of a previous laminectomy revealed the presence of residual epidural hematoma in two animals (Fig. 2C). No detectable macroscopic spinal cord changes were seen in any animal and both dorsal as well as ventral spinal cord morphology including the dorsal and ventral root entry zone had a normal appearance (Fig. 2D).
Histological Analysis of Grafted Spinal Cords (Figs. 3–7)

(A) Transverse spinal cord sections taken from the grafted spinal segment and analyzed by brightfield microscopy in the absence of any staining. Individual grafts (red arrows) are shown, demonstrating an optical density similar to that of host neurons (blue arrows). (B) MRI image of grafted spinal cord segment. Individual bilateral grafts were identified by the presence of higher intensity structures (red arrows). (C–J) Transverse spinal cord sections taken from an animal that received increasing volumes of injections with increased number of injected cells (group B). Note the cell spread around the injection tract (E) and areas of irregular cell densities (F) after injection volumes of 8 or 10 μl. (K) Using serial MRI images and 3D reconstruction, the majority of individual cell injections were identified in the central gray matter (red—core of the injections; green—needle tracts). (L–N) Transverse spinal cord sections taken from an animal grafted with 50,000 cells, delivered in 8 μl of vehicle and stained with NF and NUMA antibody. Densely packed NUMA-positive grafted cells in the core of the graft can be identified. In the same areas an extensive loss of NF-positive axodendritic network caused by the tissue expansion can be seen. (O, P, R) Transverse spinal cord sections taken from an animal grafted with 30,000 cells, delivered in 6 μl of vehicle and stained with NF and NUMA antibody. Relatively homogenous distribution of NUMA-positive cells and near normal host-derived NF-positive axodendritic network at the site of injection can be seen.
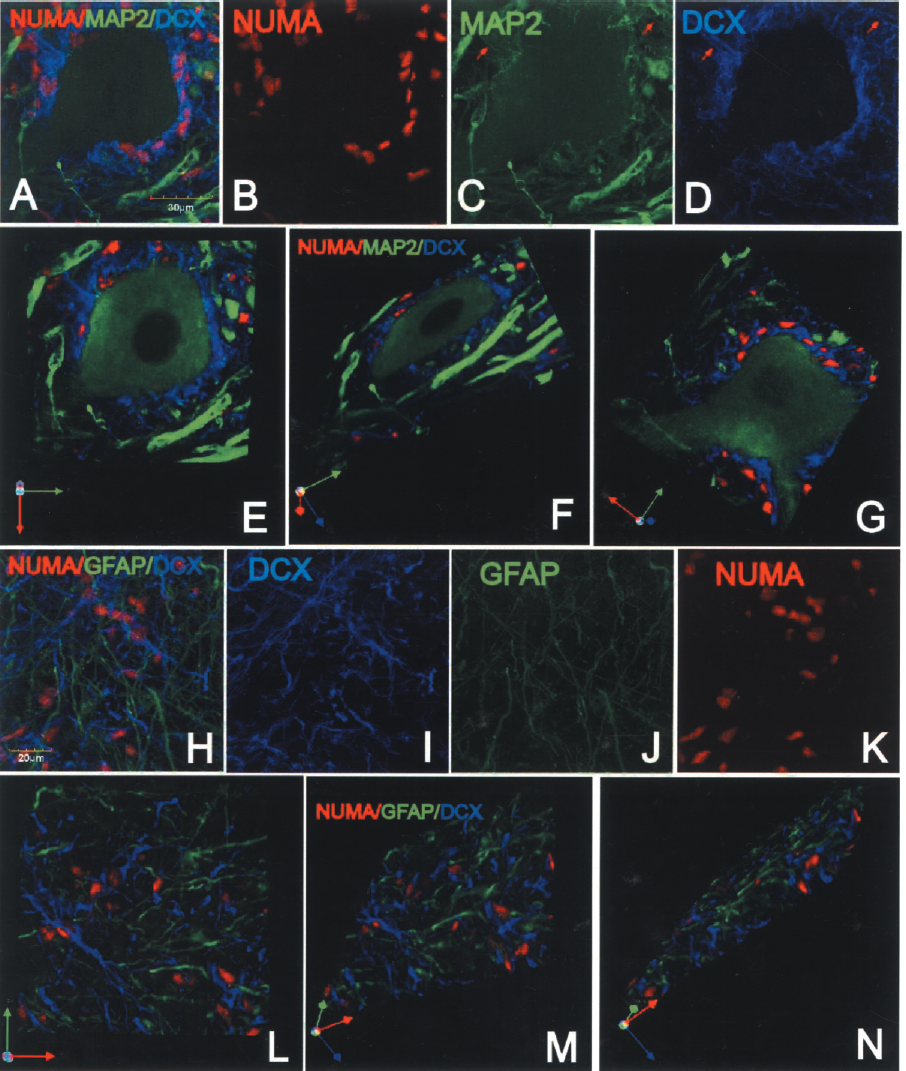
(A–D) Triple labeling of spinal cord sections with NUMA (B), MAP2 (C), and DCX (D) antibody. Numerous solitary DCX/NUMA-positive neurons surrounding ventral α-motoneuron can be seen. Extensive DCX/MAP2-immunoreactive processes associated with grafted cells can also be identified (C, D: red arrows). 3D reconstruction from z-stack of optical confocal images demonstrates a spatial distribution of grafted DCX-immunoreactive neurons (E–G). (H–K) Staining with DCX, GFAP, and NUMA antibodies revealed that the majority of grafted cells were NUMA/DCX positive but GFAP negative. 3D reconstruction from z-stack of optical confocal images demonstrates the lack of GFAP immunoreactivity in NUMA-positive grafted cells (L–N).

(A–D) Triple labeling with synaptophysin antibody, which cross-reacts with both porcine and human antigen (A: SYN— green), human-specific synaptophysin antibody (B: hSYN–red), and DCX antibody (C: DCX—blue). hSYN immuorectivity was seen only in areas of the individual grafts and was topographically associated with DCX-immunoreactive processes (C, D).(E–G) Analysis of 0.3-μm-thick optical sections revealed that virtually all hSYN-positive terminals showed colocalization with human-nonspecific SYN immunoreactivity (yellow arrow). (H) Some DCX-positive processes receiving SYN-positive terminals were also identified (red arrows).

(A–F) Immunostaining with BrdU and NUMA antibodies revealed occasional presence of double-labeled cells. The majority of these cells were localized at the periphery of grafts (yellow arrows).(G–I) Staining with DCX (green), GABA (blue), and NUMA (red) antibodies and coupled with confocal analysis showed numerous GABA-immunoreactive grafted neurons (yellow arrows).

Transverse spinal cord sections taken from control naive animal (A–D) or an animal grafted with 10,000 cells, delivered in 6 μl of vehicle (E–L) and stained with GFAP, IBA1, and NUMA antibody. In comparison to control naive animals, no detectable differences in GFAP (compare A to F and D to H) or IBA1 (compare B to J and D to L) staining pattern were seen. Only in some sections occasional hypertrophic astrocytes surrounding grafted NUMA-positive cells could be seen (H).
Brightfield analysis of frozen transverse spinal cord sections was performed. In the absence of any staining, transverse spinal cord sections prepared from grafted spinal cord segments revealed that the grafts were visually distinguishable (Fig. 3A, red arrows). Using analysis of sequentially cut sections, the presence of all individual injections as well as needle tracts could be identified in all animals. The optical density of the grafts was very similar as seen in the host neurons (Fig. 3A, blue arrows).
MRI Analysis
Individual grafts were clearly identified by the presence of an increased density in the gray matter, which corresponded to the locations of individual injections (Fig. 3B, red arrows). Using the stack of MRI images, a 3D reconstruction of the spinal cord confirmed the localization of the individual injections as well as needle tracts (Fig. 3K, green—needle track, red—core of cell injections). The localization of individual grafts identified by MRI analysis was then confirmed by matching the spinal cord sections prepared from the same injected region and stained with human specific NUMA antibody (Fig. 3C–F).
Immunofluorescence Staining and Cross-Reactivity of Human-Specific Antibodies with Porcine Spinal Cord Cells
Five different human-specific antibodies were used, which included: hMOC, hNUMA, hNSE, and two synaptophysin antibodies. hMOC and hNUMA showed no detectable cross-reactivity with the host tissue. In contrast, NSE was strongly expressed in all porcine spinal cord neurons. The first hSYN antibody showed strong reactivity in the porcine spinal cord. The second hSYN antibody (see Table 1 for details) was only expressed in the areas of the individual grafts, but also showed a moderate level of nonspecific staining in the nuclei of neurons as well as in glial cells of the host.
Effect of Injection Volume on Spinal Morphology
Using injection volumes of 2, 4, or 6 μl per injection and total cell numbers between 2,000 and 30,000/injection, no detectable morphological changes were identified and the majority of deposited cells were typically concentrated around the core of the injection (Fig. 3C, D). At 8–10 μl per injection (total cell number delivered 50,000 or 100,000, respectively), the distribution of injected cells was more irregular, often forming partially fused two to three areas of relatively high cell densities (Fig. 3F). In addition, a much more pronounced spread of injected cells in the injection tract was noted (Fig. 3E, red arrow).
Effect of Injected Total Cell Numbers on Spinal Morphology
In animals injected with 50,000 or 100,000 cells per injection, clear tissue expansion was seen in individual injection sites. This was evidenced by the loss of neurofilament-stained processes in the areas densely packed with grafted NUMA-positive cells (Fig. 3L–N). High power microscopic analysis of these areas showed disruption of NF-positive processes derived from the host neurons (Fig. 3M, inset). The degree of tissue expansion was independent of the volume of injectate used to deliver 50,000 or 100,000 cells (i.e., 2, 8, or 10 μl) while, as indicated above, more cell spread was noted in injection volumes of 8 or 10 μl.
While small areas of densely packed cells were also identified in animals receiving 2,000, 5,000, 10,000, or 30,000 cells/injection (delivered in 2, 4, or 6 μl), the degree of tissue expansion was much less pronounced. An example of an animal receiving 30,000 cells/injection in 6 μl is shown in Figure 3O, P, and R.
Grafted hNUMA-Positive Cells Show Colocalization with MAP2 and DCX
Triple labeling with hNUMA, DCX, and MAP2 antibody showed numerous solitary DCX/NUMA-positive neurons that migrated towards ventral α-motoneurons and were found to reside in the vicinity of α-motoneuronal membranes. Associated with these solitary neurons was an extensive dendritic tree colocalized with MAP2 immunoreactivity (Fig. 4A–G, see red arrows). No CHAT immunoreactivity was found in grafted cells.
Staining with GFAP, hNUMA, and DCX antibody revealed only occasional presence and weakly stained GFAP/NUMA-positive cells (not shown) with the majority of NUMA-positive cells being DCX immunoreactive (Fig. 4H–N).
Staining with hNSE antibody, while clearly identified within the grafts, showed a relatively weaker expression as compared to the host neurons (not shown). Omitting the primary hNSE antibody showed no specific staining in the graft or in the host neurons.
Development of Synaptophysin Immunoreactivity in Grafted Neurons
Staining of spinal cord sections with human nonspecific SYN antibody (Fig. 5A), human-specific SYN antibody (Fig. 5B), and DCX antibody (Fig. 5C, blue) revealed numerous DCX-positive processes extending 300–700 μm from the grafts. In the same region, a dense hSYN immunoreactivity was identified. All hSYN-positive terminals were associated with DCX-positive axons and dendrites. Confocal analysis of 0.3-μm-thick optical sections stained with human nonspecific and human-specific SYN antibody showed a colocalization of both antibodies (Fig. 5D–G). Some DCX-positive fibers were also found to receive SYN-positive terminals (Fig. 5H).
Incorporation of BrdU in Proliferating hNUMA-Positive Grafted Cells
Double labeling with BrdU and hNUMA antibody showed less than 2% of BrdU/hNUMA-positive cells. The majority of these cells were localized at the periphery of the individual grafts (Fig. 6A–F). In addition, a dense population of BrdU-positive cells was noted, which were hNUMA negative, and localized in structures that morphologically resembled the distribution of endothelial cells in newly formed vasculature (not shown).
Development of GABA Immunoreactivity in a Subpopulation of Grafted Neurons
Staining with GABA antibody showed numerous GABA-immunoreactive neurons that colocalized with hNUMA antibody (Fig. 6G–I). Quantification of NUMA/GABA-immunoreactive cells showed that, on average, 45 ± 11% of hNUMA-positive cells were GABA immunoreactive.
Changes in Endogenous GFAP and IBA1 Immunoreactivity
In comparison to control naive animals, no detectable differences in GFAP or IBA1 staining pattern in any cell-grafted group were seen (Fig. 7A–L). Only in some sections occasional hypertrophic astrocytes surrounding grafted NUMA-positive cells were seen in the core of the graft (Fig. 7H). The presence of hypertrophic astrocytes was independent of the total number of cells injected or volume of injectate. Similarly, no detectable differences in IBA1 staining pattern was seen in any cell-grafted group and no sign of microglial activation was identified if compared to control naive animals (Fig. 7; compare B vs. J and D vs. L).
Stereological Quantification of hNUMA-Positive Cells
Systematic stereological quantification of hNUMA-positive cells in groups A and B revealed an average of 2.5- to 3-fold increase in the total number of cells as compared with the number of cells injected (Table 2). A relative increase in the total number of cells was similar across the grafts with variable initial total number of cells injected and volume of injectate.
Summary of Neuronal Quantification in Experimental Groups A and B

Neuronal Quantification in Lumbar Spinal Cord of Naive Mouse and Minipig
Systematic quantification of total neuronal numbers in lumbar spinal cord sections taken from an adult naive mouse and minipig (Fig. 8A, B) showed on average 692 ± 46 neurons in mouse and 584 ± 17 in minipig. The gray matter surface area (GMS) measured in mouse was 0.857 mm2 and was 2.9 mm2 in minipig. The total neuron surface area (TNS) in mouse was 0.10 mm2 and was 0.11 mm2 in minipig. Calculated TNS/GMS ratio in mouse was 4.7 while in pig it was 26.4. Expressed in percentage, neurons in L2–L5 segments occupy 21% of gray matter in mouse while it is 4% in pig.

Transverse spinal cord sections (10 μm thick) taken from L4 spinal segment in pig (A) and mouse (B) and stained with NeuN antibody. For comparative purposes both images have the same spatial scale bar (200 μm). Note the much larger interneuronal/neuropil space in pig when compared to mouse spinal cord section.
Expression of DCX in Developing Porcine Spinal Cord
In a separate control experiment, staining of transverse spinal cord sections taken from 86-day-old pig fetus revealed the presence of clearly stained DCX-immunoreactive and NeuN-positive neurons. The majority of these neurons were localized in the center of gray matter (Fig. 9A). No DCX expression was seen in adult minipig spinal cord (Fig. 9B).

Transverse spinal cord sections taken from L4 spinal cord segment of 86-day-old porcine fetus or an adult minpig and stained with NeuN (red) and DCX (green) antibody. Numerous DCX-immunoreactive neurons can be identified in porcine fetus but no DCX immunoreactivity could be seen in adult spinal cord.
Discussion
Reaction of the Host Spinal Cord to HSSC Grafts
As we have demonstrated in the present study, individual grafts were readily identified in grafted spinal cord segments with the total number of counted cells at 6–7 weeks after grafting being two- to threefold higher than the total number of cells that were originally injected. Analysis of local host tissue reaction to a progressively increased number of injected cells showed no significant differences and the GFAP and IBA1 staining pattern was similar as seen in control nongrafted animals. Only in some sections occasional presence of reactive astrocytes was seen, but the presence of these reactive astrocytes was independent of the volume of injectate or the total number of cells injected. In addition, a homogenous presence of host-derived astrocytes within individual grafts was noted. We speculate that the lack of any significant inflammatory changes in grafted animals is in part the result of immunosuppressive treatment and resulting lack of graft rejection. These data are in agreement with our previous data using immunosuppressed rats spinally grafted with HSSC or hNT neurons (8,27).
A second criterion that was used in the present study to define the safety of the injection protocol was the optimal volume of injection as a function of homogenous cell deposition in the targeted area and the degree of integrity of the host tissue at the site of injection. As we have demonstrated, the volume of injectate higher than 6 μl was associated with irregularly oriented/organized cell deposits and backflow of cells around the injection needle (see Fig. 3E, F) while volumes of injections between 2 and 6 μl led to a homogenous deposition of cells in the targeted area. We speculate that the irregular distribution of cells seen after using higher injection volumes is the result of local tissue expansion/disruption.
The third criterion taken into consideration was the optimal total number of cells that can be delivered in a single injection. As we have demonstrated, there was a clear and extensive tissue expansion in animals injected with 50,000 or 100,000 cells/injection. This tissue expansion was associated with extensive loss of the axodendritic network formed by neurofilament-immunoreactive processes of the host. Much less pronounced tissue injury was seen in animals receiving 2,000–30,000 cells/injection.
While no permanent neurological deficit was seen in any experimental group (A and B), we have concluded that the safe volume of injectate is ≤6 μl and the optimal total number of cells delivered is around 30,000/injection in five bilateral injections (total of 10 injections) format. This assumption was further tested in a separate group of animals that received five bilateral injections (total of 10 injections) of 30,000 cells/injection delivered in 6 μl of media (group C) and showed no detectable neurological dysfunction and a comparable distribution of injected cells at 4 weeks after grafting.
Strategies for Multisegmental and Multilaminar Cell Delivery in Different Animal Species and in Humans
As discussed before, several spinal neurodegenerative disorders such as ALS, multiple sclerosis, spinal ischemia-induced paraplegia, or hypobaric-induced spinal embolism (4,51) are characterized by a multisegmental neuronal/glial degeneration. Recent experimental data using mice and rat transgenic models of ALS or rat spinal ischemic paraplegia demonstrate that spinal grafting of rat or human neuronal precursors or human neurons (hNT) derived from the NTera2 teratocarcinoma cell line leads to a clinically relevant improvement in motor function and that such behavioral improvement corresponds with long-term survival and maturation of grafted neurons (8, 27). These initial rodent studies indicate that segment- and laminae-specific cell grafting of human neuronal precursors can represent a viable therapeutic approach in patients suffering from such neurodegenerative disorders.
From the perspective of clinical application of such neuraxial cellular replacement, several basic and preclinical translational issues need to be considered. These include: i) escalation of cell dosing when compared across rodent studies, large-animal preclinical models, and humans; ii) volume of injections; and, iii) number and segmental/laminar distribution of injections.
As demonstrated in the present study, the anatomical comparison of the spinal cord between the mouse and the pig, for example, show a more than threefold increase in the lumbar cross-sectional gray matter area measured in the lumbar L2–L4 segments. This simple comparison would lead us to the assumption that a significantly higher number of injected cells (assuming similar morphological phenotype of grafted cells) will be required in larger animal species and in humans in order to achieve the same cellular repopulation effect. To the contrary, despite clear differences in the overall gray matter dimensions, the relationship between the size/volume of the gray matter and the total number of neurons is not linear. Previous systematic stereological and tissue volumetric studies have demonstrated that the total spinal cord gray matter volume in an adult mouse is 25 mm3 while in the adult rat it is 120 mm3. However, the total number of counted neurons is increased by only 30% in the rat if compared to mouse (6.4 million in the rat vs. 4 million in mouse) (5,6). In our current study, we have seen similar differences if comparing the mouse versus pig lumbar spinal cord sections. Thus, while the number of neurons was not significantly higher in 10-μm-thick sections, the total gray matter surface area was more than threefold bigger. The total gray matter area occupied by neurons was 21% in mice but was only 4% in pig. Similarly, previous studies have demonstrated that the glial index (i.e., number of glial cells/number of neurons) is significantly higher in rat than in mouse (1.6 vs. 0.7), indicating that glial cells contribute primarily to the overall increase in the gray matter volume. These data are in agreement with demonstrated increased contribution of glial elements in the composition of the gray matter in higher mammals.
These anatomical and histological characteristics appear to point to several principal issues that will define our strategies for spinal cell delivery when translated from rodent studies to higher animal species and to humans: i) the total number of cells delivered into a specific segmental and laminar region should be similar across several species; ii) the volume of injectate can be increased in higher species (reflective of the neuropil volume). In the present study, we have shown that the maximum safe volume of the individual injections in the näive noninjured minipig lumbar spinal cord is in the vicinity of 6 μm. As discussed, this volume was not associated with erratic cell spread around the needle tract and provided a well predictable cell deposition into the targeted area; iii) the total number of injections (while cumulatively delivering the similar number of cells) should be increased to permit a more homogenous cell deposition in a larger gray matter area.
As discussed in the present study, by using spinal morphological criteria, a safe cell dose was identified to be in the vicinity of 30,000 cells per single injection when delivered in 2–6 μl of vehicle. It needs to be emphasized, however, that this definition strictly reflects the properties of this particular cell line when grafted into noninjured pig spinal cord and will likely be different for other cell lines potentially used for spinal grafting in preclinical animal injury models and in humans. The variability in the cell dosing between individual cell lines will likely reflect differences in: i) the degree of proliferation and/or apoptosis after grafting; ii) injury model employed (i.e., cavity-forming injury vs. discrete loss of specific cell populations); iii) migration of grafted cells; and, iv) the change in the cell body size during maturation of grafted cells.
Accordingly, in several previous studies that demonstrated a therapeutic effect after spinal cell grafting of human or rat neural precursors, a variable number of cells delivered in different injection volumes were reported. In a mouse spinal trauma model, for example, on average 19,000 cells (human CNS-derived neural precursors) delivered in 250 nl of vehicle were used for spinal grafting. A total of four bilateral injections were used (10). Similarly, using the same human spinal stem cell line as used in our current minipig study, 50,000 cells in 1 μl of media (total of four bilateral injections) were used for spinal grafting in a rat SOD-positive model (49). In a rat spinal trauma model, 800,000 cells (acutely dissociated fetal CNS tissue) delivered in 10 μl into contused T8 spinal segment was reported (36). In a cat spinal trauma model, a total of 100,000 cells (NRP; mouse lineage-restricted neural precursors) delivered in 25 μl of media was used to infiltrate contused spinal cord (2).
Techniques for Spinal Cell Delivery
In our current experiment, a vertically advanced needle was used for spinal parenchymal cell delivery. This technique has been used in numerous experimental animal studies including mice, rat, minipig, or nonhuman primate (3,10,23,35,42) and is primarily reflective of the surgical anatomical characteristics of the spinal column (i.e., dorsal laminectomy is typically performed to achieve relatively easy access to the dorsal surface of the spinal cord). One key limitation of this technique, however, is a relatively small number of injections that can be delivered in a timely fashion. As used in the present study, for example, a total of 10 bilateral injections were performed. The average time required to perform one injection is about 4–5 min (including the time of cell injection and needle repositioning). Depending on the overall volume of the specific targeted area, it is estimated that the total number of injections required to achieve a desirable cell repopulation (if multiple segments are targeted) in humans can be in the hundreds. In a recent clinical study, for example, 481 spinal parenchymal injections were performed on average in patients with spinal traumatic injury (11). Clearly, the time required to perform such a number of injections, even if performed in an accelerated fashion, is a major limitation.
Recently, an alternative approach to deliver cells into an injured spinal cord was described by using a direct intrathecal injection of rat neural precursors (21). Finally, intravenous injections of bone marrow cells has been shown to lead to an accumulation of injected cells at the spinal cord injury site as defined by MRI and immunohistochemistry (15,43). It is unclear whether intra-arterial delivery of neural precursors will lead to a similarly effective migration of injected cells into spinal parenchyma if associated with a specific spinal pathology (i.e., spinal trauma with blood–brain barrier opening, or progressive neuronal degeneration as seen in ALS or spinal ischemia). However, it is likely that intrathecal or intra-arterial cell delivery, while superior by the nature of its relative noninvasiveness, will lead to only a limited parenchymal migration and desired multisegmental cell repopulation. From this perspective, direct parenchymal cell delivery (while more invasive) has a clear advantage as it provides a targeted and well-controlled cell delivery into a specific spinal segment and lamina. However, as discussed, there is a clear need for the development of new techniques (such as multi-needle devices), which would permit more effective spinal parenchymal cell delivery.
Survival and Neuronal Differentiation of HSSC After Grafting
In the present study, proliferating, nestin-positive HSSC were used for spinal grafting. At 4–7 weeks after transplantation the majority of grafted cells developed a neuronal phenotype as evidenced by the expression of the human-specific MOC antibody or coexpression of hNUMA and DCX immunoreactivity. Previous studies have shown that DCX is expressed in early postmitotic spinal cord neurons throughout embryonic and fetal development, but is absent in the adult nave or traumatic-injured mouse or rat spinal cord (9,12). Similarly, in the present study, analysis of E86 porcine spinal cord (the total gestational period in pigs is 120 days) showed, in addition to the presence of NeuN-immunoreactive neurons, a clear population of DCX neurons. DCX immune-reactivity was absent in the adult porcine spinal cord. These data demonstrate that at 6–7 weeks after grafting HSSC-derived neurons are in a relatively early stage of development, with an already developed neuronal phenotype.
In a previous study using HSSC grafted into ischemia-injured spinal cord in the rat, we have demonstrated that only a subpopulation of HSSC-derived neurons retain DCX immunoreactivity at 3 months after grafting, while the expression of NSE is much more pronounced (8). Previous studies have demonstrated that the NSE is expressed during the advanced stage of neuronal maturation and coincides with synapse formation (24). In accordance with that data in the same rat study, we demonstrated intense human-specific SYN immunoreactivity derived from grafted neurons. In contrast, only very modest NSE expression was seen in HSSC-derived neurons in the present minipig study.
Jointly, these data indicate that in the porcine spinal cord, a much longer period will be required for full maturation of HSSC-derived neurons. While the rate of maturation of grafted human neurons can be influenced by the specific signaling system of the host and is accelerated in lower animals species (32), based on the data from the rodent studies and current minipig study, we estimate that in the adult porcine spinal cord, 4–6 months will be required to achieve more advanced stage of neuronal maturation.
Continuing Proliferation of HSSC at 6–7 Weeks After Grafting
In the present study, animals survived 45–55 days after grafting and received BrdU injections during the last 3 days of survival. At this time point, confocal analysis showed some (less than 1–2%) BrdU/hNUMA-immunoreactive cells. The majority of these cells were found at the periphery of the grafts or appeared to migrate from the injection site. Stereological quantification of grafted cells showed an average of 2–2.5 doublings of hNUMA-positive cells. Based on these data, we speculate that the majority of grafted cells will continue to proliferate shortly after grafting. After this period, however, only small populations of cells will remain mitotically active. In a more recently completed study, we have found a similar level of proliferation of HSSC at 9 months after grafting into lumbar spinal cord in naive immunodeficient rats. In addition, a robust migration of grafted cells in the white and the gray matter was seen (13). In agreement with these data, a similar proliferation and differentiation profile of these cells is reported when grafted spinally in a transgenic ALS rat model (49) or in nave or trauma-injured spinal cord of immunodeficient rats (50).
Expression of Human-Specific Synaptophysin in Grafted Cells
At 6–7 weeks after grafting, clear expression of human-specific synaptophysin was identified within the grafts. Analysis of 0.3-μm optical confocal images showed that hSYN was associated with DCX-immunoreactive processes derived from grafted hNUMA-positive neurons.
Analysis of hSYN immunoreactivity in the gray matter showed no apparent specific projection pattern with respect to the host neurons. We hypothesize that this may be the result of a relatively short survival period after grafting. In accordance with this hypothesis, in our previous rat spinal ischemia study, a clear presence of hSYN immunoreactivity was seen in the vicinity of ventral α-motoneurons at 3 months after grafting (8). Even more robust hSYN expression was seen at 9 months after grafting in the lumbar spinal cord in immunodeficient rats (13). Similarly, in recent studies, the development of synapses between expanded human brain neuronal precursors and the host neurons when grafted into control spinal cord in nude mice was demonstrated at 3–6 months after grafting (10).
Summary
In conclusion, the current data show that spinally grafted human spinal stem cells when transplanted in naive immunosuppressed minipig show long-term survival and preferential development of neuronal phenotype. For this particular cell line, the safe total number of cells injected per injection was identified to be approximately 30,000 cells delivered in ≤6 μl of vehicle when injected into an adult lumbar spinal cord in an adult minipig. Jointly, these data demonstrate that the use of this human spinal cord precursor cell line represents a viable cell candidate for cell replacement therapies targeting region-specific spinal pathologies such as segmental spinal cord trauma or spinal ischemic injury or ALS.
Footnotes
Acknowledgments
This work was supported by the California Institute for Regenerative Medicine (RC1-00131-1-M.M.), Neuralstem Inc (MD), APVV-O314-06 (Slovak Academy of Sciences), and by NIH (NS051644 -M.M. and P30 NS047101).