
Abstract
During the last decade, much progress has been made in developing protocols for the differentiation of human embryonic stem cells (hESCs) into a neural phenotype. The appropriate agent for cell therapy is neural precursors (NPs). Here, we demonstrate the derivation of highly enriched and expandable populations of proliferating NPs from the CCTL14 line of hESCs. These NPs could differentiate in vitro into functionally active neurons, as confirmed by immunohistochemical staining and electrophysiological analysis. Neural cells differentiated in vitro from hESCs exhibit broad cellular heterogeneity with respect to developmental stage and lineage specification. To analyze the population of the derived NPs, we used fluorescence-activated cell sorting (FACS) and characterized the expression of several pluripotent and neural markers, such as Nanog, SSEA-4, SSEA-1, TRA-1-60, CD24, CD133, CD56 (NCAM), β-III-tubulin, NF70, nestin, CD271 (NGFR), CD29, CD73, and CD105 during long-term propagation. The analyzed cells were used for transplantation into the injured rodent brain; the tumorigenicity of the transplanted cells was apparently eliminated following long-term culture. These results complete the characterization of the CCTL14 line of hESCs and provide a framework for developing cell selection strategies for neural cell-based therapies.
Keywords
Introduction
Human embryonic stem cells (hESCs) are derived from the inner cell mass of preimplantation embryos and retain the developmental potency of embryonic founder cells. hESCs have the ability to differentiate into cells and tissues of all three germ layers in vitro and in vivo (44, 51, 58). During the last decade, great progress has been made by several teams in optimizing protocols for hESC differentiation into a neural phenotype. Recent studies have shown the differentiation of hESCs into the main neuronal and glial subtypes: DOPAergic (19, 25, 46, 56), GABAergic (13), and glutamatergic (20) neurons, astrocytes (11, 24), and oligodendrocytes (11, 38). However, the appropriate agent for cell therapy is neural precursors (NPs) because it is impossible to transplant terminally differentiated cells. The high risk of tumor formation by NPs currently remains the greatest obstacle in using hESC-derived NPs for transplantation.
Thus, the question of the characterization and analysis of NP populations derived from hESCs remains open. Furthermore, there are currently no published data that provide a connection between the properties of this kind of cell in vitro and their behavior after transplantation in vivo: the ability to survive, proliferate, migrate, differentiate, maintain a neural phenotype, and/or form a tumor. We present a novel in vitro protocol for the efficient generation of hESC-derived NPs. Moreover, we show a correlation between the profile of pluripotent and neural marker expression as analyzed by flow cytometry and the elimination of the tumorigenicity of hESC-derived NPs in vivo after their long-term propagation in vitro. We also confirm the ability of NPs to differentiate into a neuronal phenotype and to develop into functionally active neurons in vitro.
Materials and Methods
hESC Culture
The CCTL14 line of human ESCs was derived by the Department of Molecular Embryology, Institute of Experimental Medicine, Academy of Sciences of the Czech Republic. (Complete information on the derivation and characterization of hESCs is available at http://www.isscr.org/science/sclines.htm.) Cells were cultured on a feeder layer of mitomycin-C-treated mouse embryonic fibroblasts (MEFs) in gelatin-coated tissue culture dishes. The culture medium (CM) was Dulbecco's modified Eagle medium (DMEM/F-12 without l-glutamine) supplemented with 15% fetal bovine serum, 1% nonessential amino acids, 2 mM l-glutamine, penicillin and streptomycin at 50 U/ml (all from GIBCO, Rockville, MD), 0.1 mM β-mercaptoethanol (Sigma-Aldrich, St. Louis, MO), and 4 ng/ml human recombinant fibroblast growth factor (hrFGF) (Invitrogen, Carlsbad, CA). Colonies of hESCs were passaged every 4–7 days using either mechanical scraping with a glass pipette to provide low-density cultures of undifferentiated cells or enzymatic dissociation with collagenase type IV (GIBCO) to provide high-density cultures of undifferentiated cells (Fig. 1, Stage 0).

Schematic drawing of the in vitro differentiation protocol of hESCs into a neuronal phenotype. MEF, mouse embryonic fibroblasts; FBS, fetal bovine serum; FGF, fibroblast growth factor; EGF, epidermal growth factor; BDNF, brain-derived neurotrophic factor; NT-3, neurotrophin-3; IGF-1, insulin-like growth factor-1; AA, ascorbic acid; IHC, immunohistochemical analysis; EF, electrophysiological investigation; FACS, fluorescence-activated cell sorting analysis; RT-PCR, reverse transcription polymerase chain reaction.
Neural Progenitor Generation, Propagation, and Differentiation
To induce neural differentiation, clusters of undifferentiated hESC colonies were plated onto 0.1% agarose-coated culture dishes containing CM. Initially, the cells were cultured for 4 days in CM without hrFGF (Fig. 1, Stage 1, 0–4d) and then the medium was supplemented with 500 ng/ml mouse recombinant noggin (mrNoggin) (R&D Systems, Minneapolis, MN) for another 4 days (Fig. 1, Stage 1, 4–8d). Half of the medium was replaced every other day. At this time, 70–90% of the colonies formed spherical bodies or embryoid bodies (EBs). Aggregates whose diameter exceeded 0.5 mm were dissected into smaller clumps with a 20-gauge surgical blade and then transferred into serum-free medium or NP medium (NPM). NPM consisted of DMEM/F12 (1:1), B27 supplement (1:50), 2 mM l-glutamine, and penicillin and streptomycin at 50 U/ml (GIBCO), supplemented with 20 ng/ml human recombinant epidermal growth factor (hrEGF) (R&D Systems) and 20 ng/ml hrFGF. The cells were cultured for 6 days (Fig. 1, Stage 1, 8–14d). At this stage, cells in the EBs were defined as NPs passage 1 (P1).
For long-term propagation of hESC-derived NPs, the EBs were dissociated by accutase (Sigma-Aldrich) and the cells were plated onto laminin (Sigma-Aldrich)-coated culture dishes. Neural precursors were cultured in NPM and passaged by accutase each 5–7 days.
For terminal differentiation into a neuronal phenotype, the aggregates were dissociated by accutase and plated onto poly-d-lysine (PDL)/laminin-coated coverslips (Sigma-Aldrich). Plated cells were cultured in serum-free medium supplemented with B27 (1:50), 2 mM l-glutamine, penicillin and streptomycin at 50 U/ml, 10 ng/ml hrFGF (Invitrogen), 10 ng/ml neurotrophin-3 (NT-3) (R&D Systems), 10 ng/ml brain-derived neurotrophic factor (BDNF), 1 ng/ml insulin-like growth factor-1 (IGF-1), and 160 μM ascorbic acid (AA) (all from Sigma-Aldrich) for 4 weeks (Fig. 1, Stage 2). The medium was replaced every other day. During the first 7 days of differentiation and weekly thereafter, a number of coverslips were chosen for immunocytochemical analysis.
To confirm the stability of the karyotype, the chromosome number and size were scored using G-banding before beginning the experiment.
Fluorescence-Activated Cell Sorting Analysis
The colonies of undifferentiated hESCs were detached from culture by collagenase type IV, centrifuged, and dissociated to a single cell suspension by accutase during 2 min. Neural precursors were dissociated from monolayers by accutase (Sigma-Aldrich) for 2–5 min. After rinsing with PBS, the cell suspension (10 × 106 cells/ml and no less than 3 × 10⁵ cells per sample) was used for flow cytometric analysis using a Becton Dickinson FACSAria flow cytometer (BD Bioscience, San Diego, CA). Data analysis was performed using BD FACSDiVa software. To analyze the undifferentiated hESCs and hESC-derived NPs, conjugated antibodies against CD29, CD271 (neural growth factor receptor), HLA-ABC (BD Pharmingen, San Diego, CA), CD15 (SSEA-1), CD56 (neural cell adhesion molecule), CD24 (Exbio Antibodies, Prague, CR), CD133/1, CD133/2 (Miltenyi Biotec, Bergisch Gladbach, Germany), Nanog, TRA-1–60, and SSEA-4 (eBioscience, San Diego, CA) were used, along with unconjugated primary antibodies against nestin and neurofilament 70 kDa (NF70) (produced in mouse, Abcam, Cambridge, UK) and a secondary rat anti-mouse IgM conjugated with FITC (eBioscience). As negative controls, IgG1 isotype conjugated with FITC or RPE and IgG2a isotype conjugated with RPE (Dako Cytomation, Glostrup, Denmark) were used, as well as rat anti-mouse IgM conjugated with FITC without the addition of the primary antibody.
RNA Extraction and Reverse Transcription
Three parallel samples of undifferentiated hESCs and five parallel samples of hESC-derived NPs after five passages (P5) and eight passages (P8) were collected, washed with PBS buffer, and frozen at −70°C and stored. Total RNA was extracted using a RNeasy Micro kit (Qiagen). RNA concentrations were determined with the Nanodrop® ND1000 quantification system (Nanodrop Inc.), and RNA quality was assessed with the Experion system (BioRad) using the HighSense chip (BioRad). cDNA was synthetized using 200 ng of total RNA and 1.5 μl of a mixture of 10 μM 25-dT oligo and 10 μM random hexamers (1:1). The mixture was incubated at 72°C for 10 min, then cooled to 4°C, and 100 U MMLV reverse transcriptase (Promega), 12 U RNasin (Promega), and 5 nmol dNTPs were added to a total volume of 10 μl and incubation continued at 37°C for 70 min. The reactions were subsequently diluted to 100 μl and frozen.
Primers for nestin, Nanog, Oct4, Cripto, AFP, and Sox2 were used from the Truly Stem kit (TATAA Biocenter). Primers for SSEA-1, α-actin, VGEFR, Nodal, GATA4, and Prom1 (CD133) were designed using Primer3 software. Realtime PCR assays had a final volume of 20 μl and contained 3 μl of cDNA, 10 μl of SYBRGreen JumpStart Taq ReadyMix for Quantitative PCR (Sigma), and 500 nM primers. PCR was performed using a CFX 96 (BioRad) with a cycling protocol of 95°C for 2 min, followed by 40 cycles at 95°C for 15 s, 60°C for 20 s, and 72°C for 30 s. After cycling the melting curve was recorded between 95°C and 65°C.
Gene expression data were analyzed using Excel and GenEx software MultiD Analysis. Expression data were normalized to total RNA and corrected assuming a PCR efficiency of 95% for all genes. Each gene expression is presented relative to the average expression in the hESCs.
Statistical Analysis
Statistical analysis of the differences between cell samples for realtime PCR was evaluated using a t-test. Values of p < 0.05 were considered significant.
Antibodies and Immunocytochemistry
Cells plated onto poly-d-lysine/laminin-coated coverslips were washed in phosphate-buffered saline (PBS, 10 mM, pH 7.2) and fixed with 4% paraformaldehyde or 0.25% glutaraldehyde in PBS for 30 min. Prior to immunostaining, the fixed cells were washed twice in PBS. Permeabilization and blocking were carried out in a blocking buffer consisting of 0.1% Triton, 5% goat serum, and 1 mg/ml bovine serum albumin in Tris buffer for 20 min. To identify undifferentiated hESCs, a Human Embryonic Stem Cell Marker Antibody Panel (R&D Systems) was used. To identify NPs and differentiated neurons, antibodies directed against synaptophysin (Chemicon, Temecula, CA), β-III-tubulin, neurofilament 160 kDa (NF-160), γ-aminobutyric acid (GABA), and glutamate (produced in mouse, Sigma-Aldrich) were used. To analyze proliferative activity of cells, antibodies directed against Ki67 (rabbit polyclonal, Abcam) were used. To visualize primary antibody reactivity, appropriate secondary antibodies were used: goat anti-mouse IgG conjugated with Alexa-Fluor 488 and 594 and goat anti-rabbit IgG conjugated with Alexa-Fluor 594 (Molecular Probes, Eugene, OR).
After immunostaining, the coverslips with cells were mounted using Vectashield mounting medium (Vector Laboratories, Burlingame, CA) and examined using a spectral confocal microscope (LEICA TCS SP) equipped with an Ar/HeNe laser or a ZEISS AXIO Observer.D1 microscope (Carl Zeiss, Germany).
Quantitative analysis was carried out by counting the number of immunoreactive cells and comparing that number to the total number of viable cells as determined by DAPI staining. A minimum of 20 random fields were counted for each marker.
Middle Cerebral Artery Occlusion and Cell Transplantation
Adult male Sprague-Dawley rats weighing 280–350 g were used for experiments. Transient focal cerebral ischemia (90 min) was induced by intraluminal occlusion of the right middle cerebral artery (MCAO) (17). Anesthesia was induced with isoflurane (Foran, Abbott Laboratories Ltd., Queenborough, UK) (5%) and maintained during surgery (2.5%) in an air mixture (1:2). After a midline incision at the neck, the right carotid bifurcation was exposed, and the common carotid artery (CCA) was occluded with a clamp while the external carotid artery branch was electrocoagulated distally. A nylon thread (0.08 mm diameter) with a terminal cylinder of silicon (3 mm length, 0.24 mm diameter) was inserted into the lumen of the external carotid artery and then gently advanced into the internal carotid artery up to the origin of the middle cerebral artery (MCA). After suture, animals were allowed to recover from anesthesia in their home cage. Ninety minutes later, the animals were reanesthetized for reperfusion: the clamp placed on the CCA as well as the nylon threads were gently removed. Shortly after surgery and daily during the following week, all animals received 1 ml of physiological saline intraperitoneally, in order to prevent postsurgical dehydration. The animals recovered from anesthesia and were placed back in their home cages.
Cell transplantation was carried out 7 days after the induction of ischemia. Using aseptic technique, a small hole was drilled into the skull above the lesion (0.5 mm anterior to bregma, 3 mm lateral to the midline). Neural precursors were dissociated from monolayers by accutase (Sigma-Aldrich) for 2–5 min, then 3 μl of a cell suspension (100,000 cells/μl) were slowly injected over a 5-min period into the lesion using a Hamilton syringe with its tip placed 4.5–5 mm deep from the cortical surface. For immunosuppression, 10 mg/kg intraperitoneal Sandimmun (Novartis Pharama AG, Basel, Switzerland), 4 mg/kg intraperitoneal Immuran (GlaxoSmith-Kline, USA), and 2 mg/kg intramuscular Solu-Medrol (Pfizer, Puurs, Belgium) were administered each day.
Brain Slices, Staining, and Cell Quantification
Rats were sacrificed 1–3 months after transplantation. The anesthetized animals were perfused with 4% paraformaldehyde in 0.1 M PBS (pH 7.4). Fixed brains were dissected and immersed in PBS with 30% sucrose. Frozen coronal sections (40 μm) were cut through the areas of interest. To identify NPs transplanted into the rat brain, antibodies directed against mitochondria (MTCO2), neuron-specific enolase (NSE), Ki67 (produced in mouse, abcam), human nuclei (HuNu), nestin (produced in mouse), and neural cell adhesion molecule (NCAM) (produced in rabbit) (Chemicon) were used. To visualize primary antibody reactivity, appropriate secondary antibodies were used: goat anti-mouse IgG conjugated with Alexa-Fluor 488 and 594 and goat anti-rabbit IgG conjugated with Alexa-Fluor 594 (Molecular Probes).
Cell numbers were assessed using an Olympus CAST-Grid system (Olympus). The surface areas in sections covered by grafted HuNu-positive cells were delineated. The total number of cells within the grafts was estimated by CAST software. The Ki67 index was calculated as the ratio of Ki67-positive cells to the total number of HuNu-positive cells.
Electrophysiology
Cell membrane currents were recorded using the patch-clamp technique in the whole-cell configuration (16). Recording pipettes with a tip resistance of 6–8 M were made from borosilicate capillaries (Rückl & Sons, Otvovice, CR) using a Brown-Flaming micropipette puller (P-97, Sutter Instruments Company, Novato). Electrodes were filled with a solution containing (in mM): KCl 130.0, CaCl2 0.5, MgCl2 2.0, EGTA 5.0, HEPES 10.0. The pH was adjusted with KOH to 7.2. For immunohistochemical identification after patch-clamp measurements, the recorded cells were filled with either Lucifer Yellow (LY) (Sigma-Aldrich) or Alexa-Fluor hydrazid 488 (Molecular Probes) by dialyzing the cytoplasm with the patch pipette solution. All recordings were carried out on cells perfused with artificial cerebrospinal fluid (ACF) at a temperature of 22–25°C. The ACF contained (in mM): NaCl 122.0, KCl 3.0, CaCl2 1.5, MgCl2 1.3, Na2HPO4 1.25, NaHCO3 28.0, d-glucose 10.0. The pH was adjusted to 7.4 by gassing the ACF with 95% O2/5% CO2. Osmolarity was confirmed to be 300 ± 10 mmol/kg with a vapor pressure osmometer (Vapro 5520, Wescor Inc., Logan).
The cells attached to PDL/laminin-coated coverslips were placed in a chamber mounted on the stage of a fluorescence microscope (Axioskop FX, Carl Zeiss). They were approached by the patch electrode using an INFRAPATCH system (Luigs&Neumann, Ratingen, Germany). The cells and the recording electrodes were imaged with a digital camera (Axiocam HRc, Carl Zeiss). Current signals were amplified with an EPC-10 amplifier (HEKA Elektronik, Lambrecht/Pfalz, Germany), low-pass filtered at 3 kHz, and sampled at 5 kHz by an interface connected to an AT-compatible computer system, which also served as a stimulus generator. Data acquisition, storage, and analysis were performed with PatchMaster/Fitmaster (HEKA Elektronik). Capacitance and series resistance were compensated (typically 60–80%). The liquid junction potential was adjusted according to previously published methods (4) using JPCalcW software.
After recording, the coverslips were fixed in phosphate buffer (0.2 M PB, pH 7.4) containing 4% paraformaldehyde for 15 min and then transferred to PBS (10 mM, pH 7.2).
Resting membrane potential (Vrest) was measured by switching the EPC-10 amplifier to the current-clamp mode. The holding potential was −70 mV. Membrane capacitance (Cm) was determined automatically during acquisition by PatchMaster. Current patterns were obtained by clamping the cell membrane from a holding potential of either −70 or −50 mV to values ranging from −160 to +40 mV, at intervals of 10 mV. Pulse duration was 50 ms. In order to isolate voltage-gated delayed outwardly rectifying K+ (KDR) and inwardly rectifying K+ (KIR) current components, a voltage step from −70 to −60 mV was used to subtract the time- and voltage-independent passive currents as described previously (3, 37). To activate only KDR currents, the cells were held at −50 mV, and the amplitude of the KDR current was measured at +40 mV at the end of the pulse. The A-type K+ current component (KA) was isolated by subtracting current traces clamped at −110 mV from those clamped at −70 mV, and its amplitude was measured at the peak value. The amplitudes of KIR currents were measured at −160 mV at the end of the pulse. Tetrodotoxin (TTX)-sensitive Na+ currents were isolated by subtracting the current traces measured in 1 μM TTX-containing solution from those measured under control conditions. Na+ current amplitudes were measured at the peak value. Action potential generation was carried out by switching the EPC-10 amplifier to current clamp mode and by injection of the current in increasing steps of 10 pA. Duration of each step was 500 ms.
Pharmacology of Voltage-Dependent K+ and Na+ Channels and Receptors
TTX (1 μM; Alomone Lab, Israel) was used to identify TTX-sensitive Na+ channels. To identify voltage-dependent KA and KDR channels, 4-aminopyridine (4-AP; 2 mM) and tetraethylammonium (TEA; 10 mM) were used, while CsCl2 (1 mM) was used to inhibit KIR. To study the expression of functional ionotropic glutamergic or GABAergic receptors in differentiated cells, 100 μM glutamate, 50 μM GABA, and 50 μM bicuculline (all from Sigma) were used. Precise application of drugs was achieved using a pressurized 8-channel perfusion system (AutoMate Scientific, Inc. Berkeley, CA). All reagents were diluted in ACF.
Results
FACS Analysis of Undifferentiated hESCs
hESCs (CCTL14 line) were maintained on a layer of mouse embryonic fibroblasts, where they formed colonies of undifferentiated cells (Fig. 1, Stage 0). Genetic analysis showed that the cells had a normal 46,XX karyotype before beginning the experiment (data not shown). Immunohistochemical staining showed that undifferentiated hESCs expressed high levels of the pluripotent markers OCT-3/4 and Nanog, which are nuclear-localized transcription factors, and surface antigen SSEA-4. Single cells in the colonies were positive for SSEA-1. No positive staining for NCAM, NF70, nestin, or β-III-tubulin was found (data not shown).
To analyze the expression of several pluripotent and neuroectodermal markers in undifferentiated hESCs before starting the differentiation procedure, single cell suspensions were labeled with antibodies directed against Nanog, SSEA-4, SSEA-1, TRA-1-60, CD24, CD133, CD56 (NCAM), β-III-tubulin, NF70, nestin, CD271 (NGFR), CD29, and HLA-ABC (Table 1, Fig. 2). The expression profiles were categorized as follows, based on the percentage of positive cells: 0–5% negative, 6–39% low, 40–79% moderate, and 80–100% high. Flow cytometric analysis revealed high levels of Nanog and SSEA-4 expression, moderate levels of TRA-1-60, CD24, and β-III-tubulin expression, and low levels of SSEA-1, nestin, and HLA-ABC expression. Undifferentiated hESCs were negative for several neuroectodermal markers: CD133, NCAM, NF70, NGFR, and CD29. Overall, this analysis showed that the undifferentiated cells were positive for several pluripotent markers and did not express typical neural markers.

Fluorescence-activated cell sorting profiles of pluripotent and neural markers in undifferentiated hESCs and hESC-derived NPs during long-term propagation in vitro. (A) FACS profile of pluripotent and neural markers present in undifferentiated hESCs. (B) Comparative analysis of pluripotent and neural marker expression in undifferentiated hESCs and in hESC-derived NPs (P4–P10). (C) FACS profile of pluripotent and neural markers present in P8 NPs.
Comparative Analysis of the Expression of Pluripotent and Neural Markers in Undifferentiated hESCs and hESC-Derived Neural Precursors at Different Stages of Long-Term Propagation In Vitro

All results expressed as percentages of the whole population: 0–5%, negative reaction; 6–39%, low level of marker expression; 40–79%, moderate level of marker expression; 80–100%, high level of marker expression.
Derivation of Neural Precursors From hESCs and Their Propagation In Vitro
In this study, we used the CCTL14 line of hESCs, the differentiation characteristics of which have not been previously described. To induce neuroectodermal differentiation, clumps of hESC colonies were scrubbed and cultured under nonadherent conditions in suspension culture in hESC culture medium. During the first 4 days, the medium did not contain any mitogen or growth factor (Fig. 1, Stage 1, 0–4d), while for the next 4 days the medium was supplemented with mouse mrNoggin (Fig. 1, Stage 1, 4–8d), which suppresses nonneural differentiation and facilitates the production of a highly enriched population of NPs (20). Under these conditions, clusters formed tightly packed spherical structures called embryoid bodies (EBs). For another 6 days (Fig. 1, Stage 1, 8–14d), EBs were cultured in NP medium: serum-free medium supplemented with B27, hrFGF (20 ng/ml), and hrEGF (20 ng/ml). Such a growth factor combination is known to be effective for the propagation of human fetal- and adult-derived neuroectodermal progenitors (50, 52) and facilitated the sequential propagation and expansion of the sphere cultures. After these 6 days (a total of 14 days after starting the induction of differentiation) cells in the EB culture were defined as hESC-derived NPs passage 1 (Fig. 1, 14d, P1). Further expansion of NPs (P1–P10) was performed in a monolayer on laminin-coated 6-cm petri dishes in NPM (Fig. 1, P1–P8 and later). Between two passages the number of cells increased 2.5–3.5-fold, and the period between passages increased from 3–4 to 5–7 days during P1–P10. NPs that had been frozen and stored in liquid nitrogen for 2–12 months survived well after thawing and plating them on laminin-coated dishes, and their proliferative activity did not change (data not shown). The karyotype of the cells was normal throughout the entire period of the experiment (from undifferentiated hESC to P10 hESC-derived NPs).
FACS Analysis of hESC-Derived Neural Precursors During Their Propagation In Vitro
To monitor the expression of pluripotent and neural markers in hESC-derived NPs during their long-term propagation in vitro and then to correlate the expression profile with the behavior of these cells in vivo, a series of FACS analyses was performed. From P4 to P10, cell suspensions were labeled with the same antibodies as used with undifferentiated hESCs, directed against: SSEA-4, SSEA-1, TRA-1-60, CD24, CD133, CD56 (NCAM), β-III-tubulin, NF70, nestin, CD271 (NGFR), and CD29 (Table 1, Fig. 2). Flow cytometry results revealed that NPs were negative for TRA-1-60 and Nanog and had a high level (or a moderate level for P4) of expression of several neuroectodermal markers, NCAM, β-III-tubulin, NF70, nestin, and CD29, throughout the entire period of observation. NPs were negative for SSEA-4 from P4 to P8, but low-level expression of this marker was detected at P9–P10. The expression of SSEA-1 and CD24 decreased from a moderate to a low level at P4–P5 and then remained at the same low level to the end of the experiment. A high level of CD271 expression was found from P4 to P8. From P8 to P10, CD271 expression decreased, which correlated with the decreasing proliferative activity of the NPs in vitro. HLA-ABC antigen expression steadily increased over time during the long-term propagation of hESC-derived NPs. The most interesting expression profile was that of CD133, one of the controversial markers of NPs. We found that CD133 expression increased from low to moderate levels from P4 to P9, eventually reaching a high level at P10.
Taken together, these data confirm that the derived population of cells consists of neuroectodermal precursors and demonstrate the decreased pluripotent marker expression and proliferative activity of hESC-derived NPs during their long-term propagation in vitro.
Expression Analysis by Real-Time RT-PCR
The expression of 12 genes (Sox2, Oct4, Nanog, nestin, Prom1, SSEA-1, α-actin, Cripto, VGEFR, α-fetoprotein, Nodal, and GATA 4) was measured in undifferentiated hESCs (Fig. 1, Stage 0) and in hESC-derived NPs from P5 and P8 (Fig. 1, P5, P8). Figure 3 shows the gene expression levels found in the NPs normalized to the average expression levels in undifferentiated hESC. Two different expression profiles were found. Sox2, Oct4, Nanog, α-actin, Cripto, VGEFR, and GATA 4 genes were expressed mainly in undifferentiated cells, and during long-term propagation in vitro their expression rapidly decreased. This is in agreement with our earlier findings using several different hESC lines (39). Nestin, Prom1 (CD133), SSEA-1, α-fetoprotein, and Nodal genes showed different expression patterns in undifferentiated hESCs as well as in hESC-derived NPs of both passages when compared to the patterns of Sox2, Oct4, and Nanog gene expression. SSEA-1 expression decreased from P5 NPs to P8 NPs (p = 0.007, two-sided t-test replicate samples), while Prom1 (CD133) expression increased (p < 10−5). Both nestin and α-fetoprotein showed an almost significant decrease from P5 NPs to P8 NPs (p = 0.055 and p = 0.07, respectively). The expression of the Nodal gene did not significantly change from undifferentiated hESC to P8 NP.

Expression analysis by real-time RT-PCR. Gene expression profiles of undifferentiated hESCs and hESC-derived neural precursors from passage 5 (P5) and passage 8 (P8).
These data demonstrate that as a result of the induction of neural differentiation, the expression of pluripotent (Sox2, Oct4, and Nanog), mesodermal (α-actin, Cripto, and VGEFR), and endodermal (GATA4) genes was markedly downregulated.
Transplantation of hESC-Derived NPs Into the Rat Brain
An increasing number of animal studies provide evidence that regenerative cell-based therapies can lead to functional recovery after stroke (8). To assess the survival and differentiation of hESC-derived NPs in vivo, we grafted them into the rat brain 7 days after a stroke induced by MCAO. Undifferentiated hESCs and NPs at different stages of their development (P1, P5, P8, and P10) were prepared in the form of single cell suspensions and were injected into the striatum of the lesioned hemisphere. In the grafts, cells were detected 2–12 weeks after transplantation by immunostaining for HuNu antigen.
In animals grafted with undifferentiated hESCs (n = 12), histological analysis revealed tumor formation at 2, 3, and 4 weeks after grafting (Table 2). Transplantation of P1 NPs (n = 10) gave the same results: tumors were found in 10 of 10 animals. The transplanted P5 NPs also survived for 4–6 weeks, but only in 5 of 11 grafts was tumor formation detected (i.e., a 50% decrease in the tumorigenicity of the transplanted cells). Moreover, a migration of the grafted cells was noted in 2 of 10 animals that received P5 NPs. Rats (n = 8) implanted with P8 NPs were sacrificed at 8 or 12 weeks posttransplantation. We used staining for HuNu or MTCO2 to identify grafted cells. During this period no tumor formation was found, only one graft failed to survive, and in 5 of 7 recipients the migration of the grafted cells was detected (Fig. 4A and B). The majority of the migrating HuNuor MTCO2-positive cells were costained for NCAM (Fig. 4C), nestin (Fig. 4E), and/or NSE (Fig. 4D). Some grafts contained cell numbers in the range of 400–600 × 103, exceeding the number of implanted cells and suggesting proliferation after grafting. The last group of animals was implanted with P10 NPs, and rats were sacrificed at 4, 8, or 12 weeks after transplantation. The survival of the grafted cells was much worse than in any of the other groups (only 5 of 8 grafts survived) and did not correlate with the length of time posttransplantation. A small number of grafted cells were found in brain sections; the cells did not form tumors and migrated poorly in 2 of the 8 recipients.
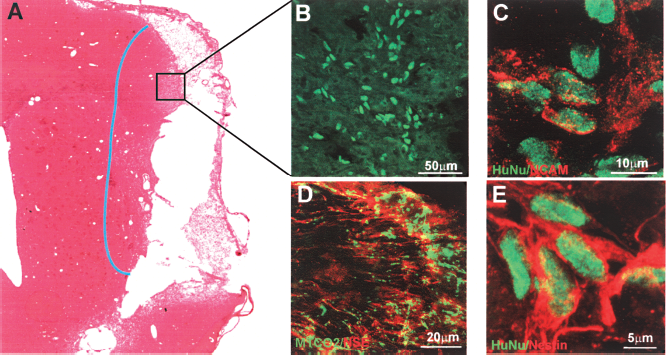
Immunohistochemical identification of hESC-derived neural precursors (P8) transplanted into the rat brain after the induction of a stroke. (A) Rat brain section 8 weeks after the transplantation of P8 NPs. The blue line shows the region of cell migration. (B) Immunohistochemical identification of human cells by HuNu and double-labeling for HuNu/NCAM (C), HuNu/Nestin (E), and MTCO2/NSE (D).
Analysis of Several Series of hESC-Derived Neural Precursor Transplantation During Their Long-Term Propagation In Vitro

To evaluate the proliferative activity of P8 and P10 hESC NPs in vitro and in vivo (after grafting), the Ki67 index was calculated. For in vitro expanded P8 and P10 hESC NPs, the Ki67 index was 32.9 ± 0.23% and 16.2 ±0.24%, respectively. Eight weeks after transplantation, the number of Ki67-positive cells decreased to 25.1 ± 0.26% and 8.2 ± 0.05% for P8 and P10 NPs, respectively. By the 12th week after grafting, the number of surviving P10 NP cells was very small; therefore, it was not possible to determine the Ki67 index. However, the number of Ki67-positive P8 NPs was found to be 12.2 ± 0.04%. These data demonstrate that the proliferative activity of both groups of cells significantly decreased during the postengraftment period. Taken together, the analysis of the Ki67 index and the fact that the total number of grafted cells increased after transplantation suggest that even this low level of proliferative activity was enough to maintain a positive balance between cell proliferation/death and to ensure the good survival of the grafts in the case of P8 NPs.
Summarizing the results of cell transplantation, we suggest that hESC-derived NPs lose the capacity to form tumors after 7 passages in vitro while acquiring the ability to migrate, in most cases, to the lesioned brain tissue. Longer term propagation of cells in culture (P10), however, decreases the survival of the grafts and the ability of the cells to migrate towards the lesion site.
In Vitro Differentiation of hESC-Derived NPs Into a Neuronal Phenotype
To confirm the ability of hESC-derived NPs to give rise to functional neurons, terminal differentiation in vitro was induced (Fig. 1, Stage 2). EBs (P1) were dissociated using accutase and plated onto PDL/laminin-coated coverslips at a density of 100,000 cells/ml. During the next 4 weeks, NPs were cultured in a medium containing 10 ng/ml hrFGF, 10 ng/ml NT-3, 10 ng/ml BDNF, 1 ng/ml IGF-I, and 160 μM AA. Within a few days after plating, most cells developed small processes. After only 2 weeks (Fig. 1, Stage 2, 2w), differentiating NPs showed the polar morphology of immature neurons: a spherical cell body with two long processes. Immunocytochemical analysis revealed that the majority of cells with the morphology of immature neurons were β-III-tubulin positive (Fig. 5A), while a few of them expressed low-molecular-weight neurofilaments, NF70 (Fig. 5B). From 15 days on, the cell processes had formed prominent fiber bundles and, frequently, small migrating cells were seen in close association with the fibers. Immunostaining for β-III-tubulin 3 weeks after plating (Fig. 1, Stage 2, 3w) revealed that the main portion of the differentiating cells were immature neurons (Fig. 5C). The fiber bundles were positive for synaptophysin (Fig. 5G) and for high-molecular-weight neurofilaments, NF160 (Fig. 5E), as well as for β-III-tubulin (Fig. 5B). The lower layer of the differentiating culture was populated by cells expressing glial precursor markers such as NG2 and S100β; some of these cells were positive for β-III-tubulin (data not shown) and evidently played the role of feeders for the terminally differentiating cells. At this time point, several coverslips were chosen for electrophysiological investigation. By the fourth week after plating (Fig. 1., Stage 2, 4w), the culture of hESC-derived neurons contained cells expressing neurotransmitters such as glutamate (Fig. 5I) and GABA (Fig. 5J). The main volume of the culture was populated by neurons positive for synaptophysin and NF160 (data not shown). These results show that NPs derived from the hESC CCTL14 line are able to differentiate into neurons in vitro under defined culture conditions.

Immunocytochemical characterization of differentiating hESC-derived neurons. Immunostaining for β-III-tubulin (A) and NF70 (B) at stage 2 (2 weeks). Immunostaining for β-III-tubulin (C), NF160 (E), and synaptophysin (G) at stage 2 (3 weeks). (D, F, H) Higher magnification views of details of the staining shown in (C), (E), (G), respectively. (C) Immunostaining for glutamate (I) and GABA (J) at stage 2 (4 weeks).
Quantitative analysis revealed that after in vitro differentiation, P1 hESC NP cultures contained 68.5 ± 1.12% β-III-tubulin-positive cells/total cells, 15.2 ± 0.91% NG2-positive cells/total cells, 20.4 ± 0.25% S100β-positive cells/total cells, and 0.5 ± 0.002% glutamate-positive cells/total cells.
To determine the influence of long-term storage and the freeze–thaw cycle on differentiation potential, we performed terminal differentiation of P8 NPs, using the same protocol as described for P1 NPs. By the fourth week after the start of differentiation, quantitative analysis of the cultures revealed 42.4 ± 1.03% β-III-tubulin-positive cells/total cells, 20.1 ± 0.81% NG2-positive cells/total cells, 38.2 ± 0.15% S100 β-positive cells/total cells, and 0.1 ± 0.001% glutamate-positive cells/total cells. These data demonstrate that after prolonged maintenance in culture, hESC NPs retained their differentiation potential, but the percentage of neurons (β-III-tubulin-positive cells) decreased with a parallel increase of glial cells (NG2- and S100β-positive cells).
Electrophysiological Investigation of hESC-Derived Neurons
The electrophysiological analysis of differentiated hESCs was carried out using the patch-clamp method in the whole cell configuration, 3 weeks after plating the cells on PDL/laminin-coated coverslips (Fig. 1, Stage 2, 3w). After 3 weeks a large number of β III-tubulin-positive cells was detected (Fig. 6A). Initially, the recordings were performed in voltage-clamp mode to determine whether differentiated hESCs express some voltage-activated K+ and Na+ channels. Voltage steps from a holding potential of −70 mV to a range of test potentials between −160 and +40 mV (10-mV increments; 50-ms duration) were employed. We found that the β-III-tubulin-positive cells displayed outwardly rectifying K+ currents, including fast activating and inactivating A-type (KA) and delayed outwardly rectifying currents (KDR) (Fig. 6B) sensitive to 2 mM 4-AP and 10 mM TEA. Moreover, they expressed TTX-sensitive Na+ currents (INa) (Fig. 6C). The following membrane parameters of β-III-tubulin-positive cells (n = 37) are summarized in Table 3: resting membrane potential (Vrest), input resistance (IR), membrane capacitance (Cm), and KDR, KA, and INa current densities. Among a total of 37 β-III-tubulin-positive cells, the application of 100 μM GABA elicited an inward current sensitive to bicuculline (Fig. 6D) in 12 of these cells, while no cell responded to 100 μM glutamate. Besides β-III-tubulin-positive cells, we also found 4 cells displaying passive, symmetrical currents, but we were not able to identify them as either astrocytes or oligodendrocytes based on GFAP- or MOSP-positive staining. These cells were usually found in the layer beneath the β-III-tubulin-positive cells, and their number was negligible compared to those expressing a neuronal-like current pattern. Subsequently, recordings were performed in current-clamp mode to determine whether β-III-tubulin-positive cells could generate an action potential. In response to the injection of square current pulses (500-ms duration), 10 of 24 hESC-derived neurons fired trains of action potentials (Fig. 6E). The cells usually fired one to three action potentials in response to a sustained current injection with duration of ~10 ms.

hESC-derived neural precursors express a typical neuronal current pattern in vitro. (A) Cell labeled with Alexa-Fluor-hydrazid-488 during patch-clamp recording (left) and its immunohistochemical identification (right). The upper photomicrograph demonstrates the typical morphology of hESC-derived neurons in vitro. Note the long bipolar processes. The higher magnification photomicrograph shows a detailed image of a β-III-tubulin-positive cell process. (B) Typical membrane current pattern of a β-III-tubulin-positive cell prior to (see the insets for voltage protocols) and after the application of 1 μM tetrodotoxin and the tetrodotoxin-sensitive current. (C) The corresponding I/V relationship. (D) Fast activating A-type K+ current (KA, red color) and delayed outwardly rectifying K+ current (KDR, green color). (E) Corresponding I/V relationships for KDR (filled circles) and KA (filled squares). (F) Action potential generation by β-III-tubulin-positive cells demonstrated by representative voltage responses to an increasing current injection (in 10-pA steps). (G) GABA-evoked currents (left) and corresponding I/V relationships for control traces prior to (filled diamonds), during (filled squares), and after GABA washout (filled triangles, right).
Membrane Properties of hESCs 5 Weeks After the Induction of Differentiation In Vitro (Fig. 1. Stage 2, 3w)

Vrest, resting membrane potential; Cm, membrane capacitance; IR, input resistance; KDR/Cm, KA/Cm, and INa/Cm, KDR, KA, and INa current densities.
These data demonstrate that 5 weeks after the induction of differentiation in vitro (Fig. 1. Stage 2, 3w), functional KA, KDR, and INa channels are present in hESC/β-III-tubulin-positive cells and 32% of these cells express functional GABAA receptors. Moreover, 41% of cells are able to generate an action potential.
Discussion
We demonstrate here the elimination of the tumorigenicity of hESC-derived NPs after long-term propagation in vitro. Transplantation of undifferentiated hESCs resulted in 100% graft survival and 100% tumor formation and/or hyperproliferation. In general, the cells were not able to migrate or incorporate into the host tissue, but rather showed invasive tumor growth. Based on immunostaining, RT-PCR, and FACS analysis, the population of undifferentiated hESCs is characterized by the high expression of typical markers of immature hESCs: Sox2, Oct4, Nanog, SSEA-4, and TRA-1-60. Interestingly, a low level of SSEA-1, nestin, and β-III-tubulin expression was shown by FACS. Moreover, RT-PCR revealed that the expression of the SSEA-1 and nestin genes was similar to that of Sox2, Oct 4, and Nanog. SSEA-1 is a typical marker for mouse ESCs, but it was shown by Adewumi and coworkers (1) that 20–30% of hESC lines can be positive for SSEA-1. While nestin and β-III-tubulin are among the early neuroectodermal markers, the expression of these molecules in undifferentiated hESCs was not demonstrated in our experiments by immunohistochemistry, a result that can be explained by the relatively low sensitivity of this method compared to FACS and RT-PCR.
Our results showed a 50% decrease in tumor formation after the transplantation of P5 NPs, compared to undifferentiated hESCs and P1 NPs. Graft survival was similar to the earlier groups (10 of 11 P5 grafts). The difference between these populations of cells consisted of the complete downregulation of the expression of the main pluripotent markers (Sox2, Oct4, Nanog, SSEA-4, and TRA-1-60) as well as mesodermal markers such as α-actin, Cripto, and VGEFR, a significant decrease of GATA4 gene expression and the strong upregulation of typical neuroectodermal markers (NCAM, β-III-tubulin, NF70, nestin, CD271, and CD29) in P5 NPs. However, such changes in pluripotent/neural marker expression do not provide enough safety from tumor formation, and thus the population of P5 NPs can still be dangerous for in vivo transplantation.
Transplantation of P8 NPs yielded the best results from among all the experimental groups; no tumor was found during 3 months of observation after transplantation, and in most grafts (5 of 7 recipients) the cells migrated towards the lesion. Immunohistochemical analysis revealed the costaining of transplanted cells for HuNu/nestin, HuNu/NCAM, and MTCO2/NSE, confirming that P8 NPs maintained a neural profile. It is unclear whether they could differentiate further to a mature neuronal phenotype because the observation period of 3 months is not sufficient for the terminal differentiation of hESC-derived NPs in vivo. The differences in the in vitro characteristics of the P8 NP population from the P5 NPs consist of a fourfold decrease in CD24 and SSEA-1 expression and a twofold increase in CD133 expression. According to several authors (7, 41, 43), the role of these three markers is critical in the process of differentiation of neural stem and progenitor cells. Mouse CD24 is expressed in vivo in the developing mouse brain and in the zone of secondary neurogenesis in adults (6), while in vitro this surface molecule appears in immature neurons and in a subpopulation of adult DRG neurons (47). Pruszak and coworkers (43) suggested that the expression of CD24 is upregulated during neural differentiation. In contrast, our study shows that the expression of this marker in P8 NPs decreased almost 10-fold compared to that in undifferentiated hESCs. CD133 (prominin-1) is present in cells within neuroepithelial rosette-like structures, similar to the location of prominin-positive neuroepithelial cells during development (10, 32). Moreover, CD133 has been shown to be one of the most reliable markers for human neural stem cells (hNSCs) (15). At the same time, CD133 was identified as a marker of glioblastoma stem-like cells (30, 49). Our results demonstrate that upregulation of CD133 expression correlates with the elimination of the tumorigenicity of hESC-derived NPs. SSEA-1 (CD15) is not only a marker of embryonic stem cells, but its expression was demonstrated in human embryonic NSCs (27) and in mouse postnatal, adult, and embryonic NSCs (6, 26, 27). Here we demonstrate that a decrease in CD15 expression correlates with a decrease in the rate of tumor formation, confirming the suggestion of Gocht and coworkers (14) that in human gliomas, the staining intensity for CD15 inversely correlates with the grade of malignancy.
Taken together, our results show that the population of hESC-derived NPs that is appropriate and safe for in vivo use has a CD133hi/CD24lo/CD15lo expression profile. However, because the role of these proteins in neurogenesis, the development of the human nervous system, and tumor formation is still unclear, further research into neural marker expression profiles should yield new insights relevant to future strategies for cell-mediated therapies.
The transplantation of P10 NPs was completely safe in terms of tumor formation, but the survival of the grafted cells was much lower (only 5 of 8 grafts survived). P10 NPs did not proliferate, and very weak migration was found in all grafts. Their surface marker expression profile did not reveal significant differences from that of P8 NPs, only the expression of CD271 was lower by 50% and the expression of HLA-ABC reached a high level (88.5%). CD271 (nerve growth factor receptor) is essential for normal development of the nervous system, because NGF promotes the survival and differentiation of sympathetic and sensory neurons during the embryonic development of peripheral neurons (5, 18). In addition, during long-term propagation in vitro, the proliferative activity of hESC-derived NPs decreased significantly, especially between P8 and P10. As was shown by Li and colleagues (28), undifferentiated hESCs have immune-privilege properties, so that when injected into immunocompetent mice, hESCs are unable to induce an immune response. According to our results, the level of expression of HLA-ABC was similar for undifferentiated hESCs and for P5 NPs, but constantly decreased from P5 to P10. Evidently, the 88.5% positivity for HLA-ABC was critical for the survival of the grafted cells. We suggest that increasing the immunogenicity of the NPs and decreasing their proliferative activity during long-term propagation in vitro resulted in poor survival, weak proliferation, and limited migration after transplantation in vivo.
It has been reported previously that the MCAO model generates an endogenous proliferation and migration response (29, 48, 57). According to our findings, endogenous neurogenesis was substantially activated and occurred close to the site of the lesion and diffusely throughout the entire right hemisphere of the ischemic rat brain. However, such activity was not morphologically and immunohistochemically colocalized with the grafted cells.
Finally, we have shown that hESC-derived NPs can differentiate in vitro into functional neurons. Since 1998, when J. Thomson first isolated human embryonic stem cells, great progress has been made in developing protocols for the neural differentiation of several lines of cells (45, 46, 56, 58). Here we demonstrate the terminal differentiation of NPs derived from CCTL14 hESCs into a neuronal phenotype. As early as 2 weeks after plating and starting the terminal differentiation protocol, the cells were morphologically and immunohistologically characterized as immature neurons. During the next 2 weeks the maturation process of the neurons in vitro was revealed by electrophysiological recording as well as by immunohistochemical staining. Finally, by the fourth week of terminal differentiation, the differentiated neurons started to accumulate the neurotransmitters glutamate and GABA. Our hESC-derived NPs can be easily cryopreserved without losing their proliferative ability. However, long-term propagation in culture influences their differentiation potential. Terminal differentiation of P8 NPs revealed a lower percentage of neuronal and a higher percentage of glial cells compared to P1 NPs, which is in agreement with the findings of Itsykson et al. (20) and Erceg et al. (11).
Using whole-cell patch-clamp recordings, we have demonstrated that β-III-tubulin-positive cells displayed passive membrane properties in vitro that were within the range of mature neurons and expressed KA, KDR, and Na+ currents, a typical neuronal current pattern. Their passive membrane properties, such as Vm, Cm, and IR, and their KA and KDR current densities were similar to those previously published for hESCs (23, 24, 42). Despite the fact that the amplitudes of TTX-sensitive Na+ currents in these cells were smaller than those of fully differentiated neurons (35), they were able to fire an action potential (AP). However, the AP duration in these cells was longer than that described by Johnson et al. (24), and also repetitive trains of action potentials were not observed. Because it has been shown that with progressing maturation the AP duration gets smaller and repetitive AP trains are more frequent, the longer AP duration and lack of repetitive AP trains observed in our cells might be due to a shorter period of differentiation. Furthermore, β-III-tubulin-positive cells expressed functional GABAA receptors; however, they responded to GABA application with an inward current and cell membrane depolarization, a typical GABA action described in immature neocortical neurons (55), newly generated neurons in the adult brain (12), or neurons derived from embryonic NSCs in vitro (21, 40, 53, 54). Depolarizing GABAergic transmission is required for the formation of glutamatergic synapses via GABAARs (2, 31).
Using an immortalized NS/PC line, Jelitai et al. (22) showed that despite the early presence of the NR1 and NR2A subunits, functional NMDA-gated channels appeared only later, in parallel with the formation of dense networks of neuronal processes. These authors also demonstrated that the appearance of NR2B protein in the membrane protein fraction showed a remarkable coincidence with the onset of receptor activity. Because the NR2B subunit protein has been proposed to be a limiting factor in the coassembly and cell surface targeting of the receptor (22, 33, 34), the lack of the mature form of NR2B protein might explain the lack of a response to glutamate in hNSCs. In addition, cultivating neural stem/progenitor cells in medium containing bFGF might cause a downregulation of mRNA for the NMDA receptor NR1 subunit as described in neurospheres (36). Furthermore, the NMDA receptors already present in the cell membrane can be affected by glycolysation and phosphorylation (9).
Footnotes
Acknowledgments
We thank Radek Sindelka for contributing to the RT-PCR expression analysis and James Dutt for critical reading of the manuscript. Support was provided by grants AV0Z50390703 and AVO250520701 from the Academy of Sciences of the Czech Republic, grants 1M0538 and LC554 from the Ministry of Education, Youth and Sports of the Czech Republic, grant IAA500520809 from the grant agency of the Academy of Science, 305/09/0717 and 309/08/H079 from the Grant Agency of the Czech Republic, the EC FP6 projects STEMS (LSHB-CT-2006-037328), and ENINET (LSHM-CT-2005-019063).