
Abstract
Transplantation of human neural progenitor cells (hNPCs) is a promising therapeutic approach for various diseases of the central nervous system (CNS). Reliable testing of hNPC transplantation in animal models of neurological diseases requires that these cells can be produced in sufficient amounts, show consistent homogeneity as a neural cell population, and be reliably labeled for in vivo tracking. In addition, the cells should be characterized as being at the optimal state of differentiation favoring successful engraftment. Here, we show that high numbers of purified hNPCs can be produced from human embryonic stem cells (hESCs) by manually selecting specifically sized and shaped spheres followed by fluorescence-activated cell sorting based on the relative cell size. In addition, we report that labeling of hNPCs with ultra-small superparamagnetic iron oxide (USPIO) particles does not affect the cellular morphology or growth. More importantly, we show that the transduction with lentiviral vector encoding green fluorescent protein (GFP) decreases the neurality of the cell population. We conclude that our cost-effective protocol of generating hNPCs is widely applicable for preclinical studies on CNS disorders. This improved method of producing large quantities of high-purity hNPCs maybe useful also when generating hNPCs from human induced pluripotent stem (hiPS) cell lines. However, caution should be used when lenti-GFP transduction is applied for hNPC labeling.
Keywords
Introduction
Neurological disorders and injuries represent leading causes of disability in Western countries. Very few brain diseases are curable, and most of them worsen over time. This is especially true for neurodegenerative diseases, stroke, and traumatic injuries of the central nervous system (CNS) (9, 16). Thus, there is a compelling need to develop novel therapeutic strategies for brain disorders.
Stem cell transplantation is one promising therapeutic approach, which may be further developed as a monotherapy or a combination therapy encompassing cells, small molecules, and gene transfer (31). It is conceivable that multipotent human neural progenitor cells (hNPCs) represent a key cell population of cell-based restorative therapy for brain diseases. These cells can be differentiated from pluripotent human embryonic stem cells (hESCs) or induced pluripotent stem (hiPS) cells derived from adult somatic cells.
Stem cell therapy is currently at the preclinical phase worldwide including studies in animal models of different diseases, which are a prerequisite for human trials (4). To narrow the gaps between human and animal studies, transplantation should first be tested in rodent models of neurological diseases with human cells. These cells need to be produced in sufficient amounts, show consistent homogeneity as a neural cell population, and be reliably labeled for in vivo tracking. In addition, the cells should be characterized as being at the optimal state of differentiation favoring successful engraftment.
To obtain hNPCs, hESCs can be differentiated either in a suspension or in an adherent culture, in which differentiation occurs on top of stromal cells or matrix in the presence of neuralizing growth factors [reviewed in Dhara and Stice (14) and Nishikawa et al. (34)]. When suspension cultures of spherical embryoid bodies (EBs) are used, a heterogeneous cell population representing all germ layers is obtained. This requires further purification to isolate the neural cells. Nat et al. (33) modified a suspension method by growing hESCs in a specific neural induction medium that facilitated the cells toward a neural pathway. However, the cues provided by the medium were not sufficient to exclusively generate neurospheres, the structures capable of producing the main phenotypes of the CNS (neurons, astrocytes, and oligodendrocytes) (6, 38). Instead, the culture also contained EB-like spheres (33). More recently, it has been found that the addition of compounds inhibiting mesodermal and endodermal lineages into the medium of an adherent hESC culture accelerated neuralization and resulted in a homogenous neural cell population (11). Unfortunately, the amount of transplantable hNPCs obtained by the adherent culture method was low, possibly due to the advanced neural differentiation. Moreover, the use of mesodermal and endodermal inhibitors is costly. For these reasons, the suspension method (33) providing a high amount of hNPCs, although requiring cell purification, is more suitable for in vivo transplantation purposes than the adherent culture method.
It is crucial that the transplantable cells are at the optimal state of differentiation to be able to integrate and migrate into the host tissue. Endogenous NPCs start to express doublecortin (DCX), a microtubule-associated protein, at the onset of cell division. The daughter cells continue to express DCX for 2–3 weeks throughout maturation into neurons (8). DCX is essential for neuronal migration into the cerebral cortex (18). Mutations in the DCX gene cause abnormal cortical structures, such as a four-layered cortex, due to incomplete neuronal precursor migration (5, 18). It has also been shown to be expressed almost purely in developing neurons (8), and therefore, DCX is a widely used marker for both neurogenesis and neuronal precursor migration.
Detection of transplanted hNPCs in the host tissue requires labeling of the hNPCs either prior to or after grafting. The labeling method can be selected based on whether the cells need to be observed noninvasively at several time points or only at the end point. Labeling the cells with ultra-small superparamagnetic iron oxide (USPIO) particles enables noninvasive in vivo tracking of the cells by magnetic resonance imaging (MRI) and at the end point histochemically by Prussian blue staining (12, 19). Even though cell tracking by MRI is a powerful method, the availability of MRI for small-sized rodents may limit its use. Also, USPIO particles are not transferred equally to the daughter cells, which may result in a diluted MRI signal of the transplanted cells that have divided. In addition, positive MRI signals can be produced even by minor bleeding, which frequently occurs with animal stroke models. This would confound the interpretation of the results. Another option is to utilize a cell membraneintegrating fluorescent dye, chloromethylbenzamido-1,1′-dioctadecyl-3,3,3′3′-tetramethylindocarbocyanine perchlorate (CM-Dil) (17, 27), but it quenches in approximately 1 month and is able to transfer from labeled to unlabeled cells (25), which makes it unsuitable for long-term tracking. Yet, another alternative is to transduce the cells with an integrating virus vector encoding green fluorescent protein (GFP) or other fluorescent proteins, allowing a long-term and specific detection of the transplanted cells. However, integrating viruses may both disturb the normal function of the cells and have an effect on differentiation (42). Incidentally, GFP has been reported to be toxic to a variety of primary and secondary cell lines (2, 28) and to adult stem cells (39). These effects render this option suboptimal. Finally, transplanted human cells can also be detected by immunohistochemistry using human specific antibodies. Evidently, this application does not affect the differentiation process or function of the cells but is limited to the end-point analysis. Moreover, finding specific and high-quality antibodies may be challenging.
In this study, we optimized the suspension method described by Nat et al. (33) to be used in several mouse models of neurological disorders. We show that high numbers of purified hNPCs can be produced from hESCs by manually selecting specifically sized and shaped spheres, followed by fluorescence-activated cell sorting (FACS) based on the relative size of individual cells. In addition, we report that USPIO labeling of hNPCs does not affect cellular morphology or growth. More importantly, we show that the transduction with lentiviral vector encoding GFP decreases the neurality of hNPCs.
Materials and Methods
Maintenance of hESC Cultures
Human embryonic stem cells [hESC, line HS306; passages 62–67; originally derived at the Karolinska Institute (22)] were grown on top of mitomycin C (10 μg/ml for 2.5 h; Sigma-Aldrich, St. Louis, MO, USA)-treated human foreskin fibroblasts (CRL-2429, ATCC, Manassas, VA, USA) in knock-out Dulbecco's modified Eagle's medium (DMEM) supplemented with 20% serum replacement, 2 mM Glutamax, 1% nonessential amino acids, 50 IU/ ml penicillin, 50 μg/ml streptomycin and 0.1 mM 2-mercaptoethanol (all from Invitrogen, Carlsbad, CA, USA). Basic fibroblast growth factor (bFGF; R&D Systems, Minneapolis, MN, USA) was added to the medium at 8 ng/ml. The culture was maintained at 37°C and 5% CO2 in a humidified incubator. Medium was changed daily, and hESC colonies were enzymatically passaged by TrypLE Express (hereinafter TrypLE; Invitrogen) in the presence of 10 μg/ml Rho-associated coiled-coil kinase (ROCK) inhibitor Y-27632 (Sigma-Aldrich), which has been shown to inhibit apoptosis, increase survival of single ESCs, and improve colony formation (40).
Neural Differentiation in Floating Spheres
Neural differentiation was performed according to Nat et al. (33) with minor modifications. Briefly, hESCs were detached from feeders and grown in neural induction medium (NIM) containing a 1:1 mix of DMEM/F12 and neurobasal medium supplemented with 1× retinoic acid-free B27, 1× N2, 2 mM Glutamax, 50 IU/ml penicillin, and 50 μg/ml streptomycin (all from Invitrogen) for 4–5 days. After induction, floating spheres were moved into ultra-low adherent dishes (Corning Life Sciences, Amsterdam, the Netherlands) and cultured in the presence of neural proliferation medium (NPM), which was NIM supplemented with 25 ng/ml bFGF, for at least 6 weeks. During differentiation, the medium was renewed every second day, spheres were manually cut out 1–2 times a week, and the samples for cellular characterization (see below) were taken once a week. Eight individual batches of differentiating spheres were analyzed using immunocytochemistry, quantitative RT-PCR, and flow cytometry.
Adherent Cultures of hNPCs
Due to various sizes of differentiating spheres (Fig. 1A), we collected separately round, homogenous, small-sized (0.3–0.4 mm) spheres (type 1 hereinafter; Fig. 1B) and EB-like spheres that contained three-dimensional, hollow, translucent internal structures (type 2 hereinafter; Fig. 1C). Both sphere types were treated with TrypLE for 7 min in order to obtain single-cell suspensions. Dissociated progenitor cells were then seeded on wells that had been coated with 50 μg/ml polyornithine (Sigma-Aldrich) at 37°C for 2 h and then with 10 μg/ml human laminin (Sigma-Aldrich) at 4°C overnight. The seeding concentrations were 150,000 cells per 24-well plate and 700,000 cells per six-well plate in 0.5 and 2 ml of medium, respectively.

Removal of embryoid body-like spheres (type 2) enriched neural population and improved the loss of pluripotency. Spheres from a heterogenous population (A) were selected based on their size (diameter 0.3–0.4 mm) and shape (rounded) and termed as type 1 (B). The neurality of type 1 spheres was compared to type 2 (C). Individual cells isolated from these two distinct spheroidal structures had different morphology: those from type 1 spheres had neuronal-like appearance with bright and small cell body (D, arrows) and long projections (D, arrowheads), whereas those from type 2 spheres were more ambiguous (E, arrows). Scale bar: 100 μm.
Labeling of hNPCs
Two days after seeding (see above), hNPCs were transduced with either empty (mock) or GFP-carrying lentivirus (Biocenter Kuopio, National Virus Vector Laboratory, Kuopio, Finland) at a multiplicity of infection (MOI) 5, which was the lowest virus concentration yielding readily detectable fluorescence intensity. Viral particles were removed 18 h later by changing the medium. For USPIO labeling, the cells were incubated with a mixture of 200 μg/ml USPIO (PMP-50, Kisker, Steinfurt, Germany) and 375 ng/ml poly-l-lysine (Sigma-Aldrich) for 24 h at 37°C, after which they were washed once with 1× phosphate-buffered saline (PBS; Invitrogen).
Immunocytochemistry
The cells were fixed with 4% paraformaldehyde (PFA; Sigma-Aldrich) at room temperature for 20 min, washed 2× with PBS, and permeabilized [except for cell surface markers Tra-1-81 and stage-specific embryonic antigen-4 (SSEA-4)] with 0.2% Triton X-100 (Sigma-Aldrich) in PBS at room temperature for 1 h. Cells were incubated overnight at 4°C with primary antibodies at appropriate dilutions in 5% goat serum (Millipore, Billerica, MA, USA)-PBS. After 4×10-min PBS washes, the Alexa Fluor secondary antibody [goat anti-mouse 488 (A110011) and goat anti-rabbit 568 (A11011), Molecular Probes, Invitrogen] was added at 1:300 dilution in 5% goat serum-PBS and incubated at room temperature in the dark for 1 h. The cells were washed again in PBS and stained with 5 μg/ml Hoechst 333042 (Molecular Probes). Imaging was done with an Olympus DP70 digital camera attached to an Olympus IX71 inverted epifluorescence microscope (Hamburg, Germany). Primary antibodies to detect pluripotency were anti-Nanog (1:200; AF1997; R&D Systems), anti-octamer-binding transcription factor 4 (Oct4; 1:400; MAB4401), anti-SSEA-4 (1:400; MAB4304), and anti-Tra-1-81 (1:200; MAB4381; all Millipore). Neuronal markers were anti-doublecortin (DCX, 1:200; 4604; Cell Signaling Technology, Danvers, MA, USA), anti-microtubule-associated protein 2 (Map-2; 1:200; MAB3418, Millipore), and anti-βIII-tubulin (Tuj1; 1:400; MMS-435P; Covance, San Diego, CA, USA). Polyclonal anti-glial fibrillary acidic protein (GFAP; 1:400; Z0334; Dako, Glostrup, Denmark) was used for detection of astrocytes.
Quantitative RT-PCR (qRT-PCR)
The extraction of total RNA and reverse transcription of RNA into cDNA were performed using TaqMan Cells-to-CT Kit (Applied Biosystems, Foster City, CA, USA). Samples of 50,000 hNPCs were taken in duplicates for RNA extraction. TaqMan gene expression assays (Applied Biosystems) containing 6-carboxyfluorescein (FAM) dye were used to measure the RNA expression of Nanog (Hs02387400_g1), DCX (Hs01035496_m1), Map-2 (Hs00258900_m1), and paired box 6 (Pax-6; Hs00242217_m1) genes. For each sample, the expression of endogenous β-actin (ACTB) gene containing VIC-dye (Applied Biosystems) was determined.
For qRT-PCR analysis, 4 μl of samples was added to PCR mixture (16 μl) containing TaqMan Gene Expression Master Mix (Applied Biosystems) and specific primers described above. The amplification of the target gene was done with the ABI Prism 7500 sequence detection system (Applied Biosystems), and data analysis was performed with the Q-gene program (Equation 2) (32). A comparative CT method was used to assess relative changes in Nanog, DCX, Map-2, and Pax-6. The results were shown either as normalized expression or as fold change in normalized expression. In normalized expression, the expression levels of the target gene were normalized to that of endogenous β-actin gene. Due to big variation in the neurality between individual differentiation batches, some RT-PCR results were shown as fold change in normalized expression, in which the change in the target gene expression was compared to control separately within each differentiation batches.
Flow Cytometry
The hNPCs were detached with TrypLE and centrifuged at 300 × g for 5 min, and the pellet was resuspended in PBS. The cell suspension was filtered through a 35-μm cell strainer (34 2235; BD Biosciences, San Jose, CA) and then counted. For DCX staining, 100,000 cells were fixed in 1% PFA for 10 min on ice, washed with 5% FBS-PBS, and permeabilized with 0.5% saponin (Acros, St. Louis, MO, USA) for 20 min on ice. Then, the cells were stained with anti-DCX (1:50 in 0.1% saponin, Cell Signaling) at room temperature for 20 min, washed twice in 0.1% saponin, and stained with F(ab′)2 goat anti-rabbit phycoerythrin (1:400; A10542, Invitrogen) or goat anti-rabbit Alexa Fluor 488 (1:4,000; A11008, Invitrogen), in 0.1% saponin, at room temperature, in the dark, for 20 min. The stained cells were washed twice in 0.1% saponin, resuspended in 5% FBS-PBS, and filtered again. Cells were analyzed on either a FACSCalibur (BD Biosciences) equipped with a single 488-nm argon laser or FACSAria III (BD Biosciences) equipped with 488- and 633-nm argon lasers. The transduction efficiency (amount of GFP-positive cells) was analyzed by running live, single-cell suspension stained with propidium iodide (5 μg/ml; Fluka, Sigma-Aldrich) for 10 min at room temperature or DRAQ 7 (5 μl/ml; Biostatus, Shepshed, Leicestershire, UK) for 10 min at room temperature to exclude dead cells. Data analysis was performed using CellQuest Pro or FACSDiva software (both from BD Biosciences).
Cell sorting was performed on a FACSAria III with a 100-μm nozzle, 20-psi sheath pressure, and flow rate of 1.0 ms–1. Single-cell suspensions (5–6×10⁶ cells/ml) were then stained with the 633-nm excitable DRAQ7 as above to exclude dead cells. Sorting gates were set up by sequential Boolean gating. After cell doublet discrimination from linear populations of forward scatter-height (FSC-H) by forward scatter-area (FSC-A) and then side scatter-height (SSC-H) by side scatter-area (SSC-A), live cells were gated away from DRAQ7 positive by bivariate plot FSC-A by DRAQ7. These live cells were further discriminated on a scatter plot FSC-A by GFP-A. Cell populations were sorted for GFP-positive and either FSC-A-high (for large) or FSC-A-low (for small) cells.
Monitoring hNPC Growth by Continuous Live Cell Imaging and Analysis System (Cell-IQ)
A continuous live cell imaging system, Cell-IQ v.2 equipped with a phase-contrast microscope with a 10× objective (Chip-Man Technologies, Tampere, Finland), was used to follow up the recovery and growth of labeled or unlabeled (see above) hNPCs. One day after USPIO exposure or lenti-GFP or mock transduction, medium was renewed, and the plate fitted with a Cell-Secure lid (Chip-Man Technologies) containing ventilation filters. The incubation conditions were maintained at 37°C, 5% CO2, 19% O2, and 76% N2, and medium was changed every other day. The culture was time-lapse imaged every 12 h for 5 days by Imagen Mode. Nine individual grids were captured from each well. Cell growth curves (i.e., number of living cells) were determined by using Analyser Mode.
Statistics
The statistical significance of the data was analyzed with paired t test, with one-way analysis of variance (ANOVA) followed by Tukey's test or with two-way ANOVA with Bonferroni post hoc test as appropriate, using GraphPad Prism version 5 (GraphPad Software, Inc., San Diego, CA). Values of p < 0.05 were considered statistically significant.
Results
Neural Differentiation Method Produces a Heterogenous Sphere Population
The neural differentiation of hESCs in floating aggregates produced a high amount of spheres, which showed considerable variation in their shape, size, homogeneity, and transparency (Fig. 1A). It is unlikely that this mixed population of spheres contains only neurospheres generating purely hNPCs. Therefore, we separated the two main subpopulations of the spheres: small-sized (0.3– 0.4 mm in diameter) rounded spheres without an evident hollow center (type 1, Fig. 1B) and spheres resembling EBs with a hollow three-dimensional structure (type 2, Fig. 1C), and characterized them by the extent of their neurality.
The cells dissociated from type 1 and type 2 spheres were further grown on polyornithine-laminin-coated wells and appeared to have substantially different morphologies (Figs. 1D, E and 2). Most cells from type 1 spheres showed typical neuronal morphology (i.e., bright and small cell body with a halo) with one or two projections (Figs. 1D and 2A, C, E), whereas in type 2 spheres, the majority of the cells were large and flat, having relatively great-sized nuclei, and lacked any distinct projections (Figs. 1E and 2B, D, F). In addition, numerous hollow three-dimensional centers of the sphere remnants (Fig. 2B, F) were seen in type 2 sphere cultures but never in type 1 sphere cultures. At the end of differentiation (6 weeks), a gene marker of pluripotency, Nanog, was expressed at significantly higher levels (threefold; p < 0.05) in type 2 spheres compared to type 1 spheres (Fig. 3). In addition, there was a fivefold increase in the expression level of Pax-6, a neuroectodermal gene marker, and 10-fold increase of DCX and Map-2, neural gene markers, in type 1 spheres when compared to type 2 (Fig. 3). Immunocytochemistry supported the gene expression data, as type 1 spheres produced more Map-2-and DCX-positive cells with long projections (Fig. 2A, E) than did type 2 spheres (Fig. 2B, F).
Neuronal marker expression in cells dissociated from type 1 (A, C, E) and type 2 (B, D, F) spheres at protein level. Pictures of immunostained cell samples revealed that type 1 spheres produced a more neuronal population with long projections (A, E) than the cells from type 2 spheres (B, F). Nuclear staining (Hoechst 333042, in blue) showed that neuronal cells had smaller nuclei than those that were negative for neuronal markers (C, D). Map-2, microtubule-associated protein 2; DCX, doublecortin.

Pluripotent and neuronal marker expression in hNPCs dissociated from type 1 and type 2 spheres at RNA level. Expression of neural and pluripotent markers was determined at RNA level by using the comparative RT-PCR method. The results are shown as normalized expression in which the expression of the target genes is normalized to that of endogenous β-actin gene. Results are expressed as mean ± SD from three independent differentiation batches (n = 6). *p < 0.05, ***p < 0.001, paired t test. hNPCs, human neural progenitor cells; Pax-6, paired box 6.
These findings indicate that type 2 spheres that resembled EBs were not sufficiently differentiated into neural tissue but, instead, still contained pluripotent cells and possibly also differentiated nonneural cells, making these spheres an unreliable source of hNPCs. Therefore, we decided to use only type 1 spheres in the further studies.
Removal of FGF Enhances Further Maturation of hNPCs
Removal of FGF from the culture medium has been reported to induce neural maturation of hNPCs (26, 44). We found that the removal of FGF from the culture medium of hNPCs increased the RNA expression of DCX and Map-2 genes 2.5 times, whereas Pax-6 expression remained unchanged (Fig. 4A). This is reasonable because DCX and Map-2 are expressed in immature to mature neurons, whereas Pax-6 is a marker for early ectodermal generation during embryogenesis (33).

Removal of basic FGF at the end of differentiation induced expression of neuronal markers. At the end of neural differentiation, the hNPCs were plated on polyornithine-laminin-coated wells and were grown with or without fibroblast growth factor (FGF) for 6 days. The expression of neuronal markers was determined by comparative RT-PCR (A). In cytometric dot plots (C and D are representative pictures), expression of cells for DCX with secondary Alexa Fluor 488 is plotted against forward scatter, which represents size and refractive index (FSC-H). The high DCX-expressing cells (DCXhi) were gated, and the percentages shown are number events DCXhi/number events DCX total (B–D). In the cytometric histogram plot (E), the DCX intensity of the cells with and without FGF is shown. The RT-PCR results are shown as mean ± SD from four independent differentiation batches and expressed as fold change normalized to the baseline gene expression of cells grown in the presence of FGF. Immunocytochemistry: Representative pictures of immunostained βIII-tubulin (green) (F, G), and DCX (red) and Map-2 (green) (H, I). MFI, mean fluorescence intensity.
Flow cytometric data showed that the removal of FGF did not change the total number (over 90%) of DCX-positive cells but, instead, resulted in a 3.8-fold increase in the fraction of high DCX-expressing cells (p < 0.05) (Fig. 4B–D) and doubling of median fluorescence intensity (Fig. 4E). According to immunocytochemistry, the neuronal cells (DCX, βIII-tubulin, and Map-2) were enriched in FGF-deprived medium (Fig. 4F–I). Notably, ablation of FGF decreased the cell proliferation (see confluency in Fig. 4F–I).
Type 1 Spheres Contain a Minor Population of Nonneural Cells
Careful inspection of type 1 sphere-derived cell populations showed that although the majority of the cells possessed neuronal properties (see above), there was still a minor population of large and flat cells present. Immunocytochemistry showed that the small cells expressed neuronal markers, whereas large cells were not positive for neuronal (e.g., DCX, βIII-tubulin, Map-2) or astrocyte (GFAP) markers (data not shown). Thus, we decided to further enrich the neural cell population by sorting the small-sized neural cells from the large ones. For sorting, single-cell suspensions (5–6×10⁶ cells/ml) were stained with DRAQ7 to exclude dead cells. Sorting gates were set up from live cells that were GFP positive and forward scatter (FSC-A) high (for large) or low (for small).
After sorting, the cells were cultured for 1 week and analyzed for neuronality. RT-PCR demonstrated that the expression of neuroectodermal (Pax-6) and neuronal (DCX and Map-2) markers was threefold higher in small-sized cells compared to large-sized cells (n = 4, p < 0.001) (Fig. 5A). According to flow cytometry, all the cells were DCX positive, but there were clear differences in the intensities between small and large sorted cell populations. In the large cell population, 22% of the cells expressed DCX at high levels (Fig. 5B, bottom right corner), whereas in the small cell population, half of the cells were high expressors (Fig. 5C, bottom right corner). These results were supported by immunocytochemistry (Fig. 5D, E), where only high DCX-expressing cells were detectable.

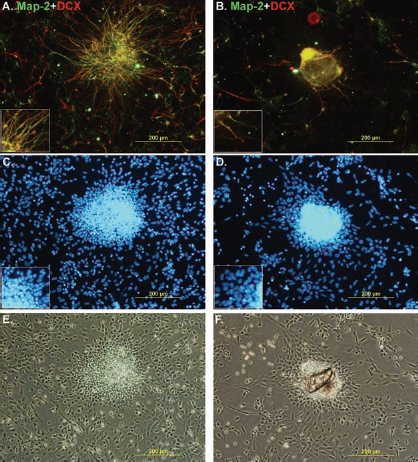
Enrichment of the small-sized cells by FACS improved neuronality of the hNPC population. At the end of differentiation, single cells from type 1 spheres were seeded on polyornithine-laminin-coated wells. After 2 days, part of the cells was transduced with lenti-green fluorescent protein (GFP) [multiplicity of infection (MOI) 5], grown for another 2 days, and sorted by fluorescence-activated cell sorting (FACS) based on the relative size of the cells [small (s) vs. large (l)]. These size-sorted cells were reseeded in new wells, and after 1 week, the cells were analyzed for neuronal properties at RNA (A) and protein (B, D: large cells; C, E: small cells) levels. The DCX positivity of the both type of cells was determined by flow cytometry (B, C) and by immunocytochemistry (D, E; red). The RNA results are shown as β-actin-normalized expression [mean ± SD from two separate differentiation batches; n = 4; *p < 0.05, ***p < 0.001, one-way analysis of variance (ANOVA) followed by Tukey's test].
GFP Changes the Phenotype of hNPC Population
While determining the optimal MOI of 5 for microscopically detectable GFP with minimal toxicity, we observed that the large-sized cells were transduced more efficiently than the small-sized cells (data not shown). Moreover, we noticed that lenti-GFP transduction decreased the amount of small cells, which was probably due to the toxicity of lenti-GFP. Therefore, we decided to study the influence of lenti-GFP transduction on the neuronality of these cells.
In order to clarify whether the above observation was due to lentiviral transduction itself or the expressed GFP protein, we transduced hNPCs with mock or GFP-containing lentivirus. In addition, the effect of USPIO labeling was evaluated. In general, GFP transduction decreased the RNA expression of neuronal markers by 25–45% (Fig. 6A), whereas, mock transduction and USPIO labeling had only a slight, if any, effect on neurality. A similar trend was seen in the DCX immunostaining of GFP-hNPCs (Fig. 6B, C). Flow cytometric studies showed that the high DCX-expressing small-sized cells decreased by 30% after lenti-GFP transduction compared to nontransduced cells (data not shown). These data were supported by a continuous live cell imaging system. Morphology (Fig. 7A) and growing rate (Fig. 7A, B) were similar for control, USPIO-treated, and mock-transduced cell populations, whereas GFP-lentiviral transduction clearly weakened the cell growth and enriched the number of nonneuronal type of cells. Our data indicate that GFP and not the lentivirus itself is responsible for the toxic effects seen in the hNPC population.

Lenti-GFP transduction impact on the cellular phenotype of hNPCs. At the end of differentiation, cells were plated on polyornithine-laminin-coated wells and were grown for 2 days. Then, the cells were either transduced with mock-lentivirus or GFP-encoding lentivirus (MOI 5) or exposed to ultra-small superparamagnetic iron oxide (USPIO) particles. The influence of different treatments on neural marker expression at RNA level was analyzed after 5 days (A). Results from four independent differentiation batches ± SD are expressed as fold change normalized to the baseline expression of untreated cells. The effects of lenti-GFP transduction on DCX protein expression (in red) was studied by immunocytochemistry (B, C). Left panels show the expression of GFP, and right panels, the nuclear staining (Hoechst 333042).

GFP-lentiviral transduction weakened the growth of hNPCs and enriched the number of nonneuronal type of cells. One day after USPIO exposure or transduction with either mock or GFP lentivirus (MOI 5), the cells were located and followed by Cell-IQ for 5 days. From each well, nine images were taken every 12 h. (A) Representative pictures from days 0, 2, and 4. (B) Cell growth (number of cells per area) as a function of time. The cell growth of GFP-transduced cells was significantly lower (***p < 0.001, two-way ANOVA with Bonferroni post hoc test) than that of control, USPIO-treated, or mock-transduced cells.
The effect of lenti-GFP transduction was also observed in the sorted hNPCs. In the small-sized cells, there was a statistically significant 25% reduction in Pax-6, DCX, and Map-2 expression by RT-PCR (Fig. 5A). Interestingly, in the large-sized cells, the GFP did not have a significant effect on the expression of the above markers (Fig. 5A). Thus, the high sensitivity of small-sized hNPCs to GFP appeared to be a major contributory factor to the enrichment of large-sized cells after lenti-GFP transduction.
Discussion
Increasing data indicate that cell-based restorative treatment has a therapeutic potential in the diseases of the central nervous system. Numerous clinical trials have entered phase 1 on testing stem cell therapy in neurological diseases such as stroke, multiple sclerosis, spinal cord injury, amyotrophic lateral sclerosis, and Huntington's disease (1, 3). In addition, transplantation of rodent or hNPCs to rodent models of neurological diseases has been reported to provide some functional benefit [reviewed in Feng and Gao (16)]. However, when developing the restorative therapy based on hNPCs toward clinical applications, there are several issues to be solved before successful proof-of-concept studies can be achieved. A key question is the criteria of transplantable cells, especially regarding the optimal phenotype, purity, and developmental stage of differentiation. Once these criteria have been selected, reproducibility is needed for their large-scale production. This would encourage high-quality studies in rodent models of CNS diseases. A typical cell transplant contains hundreds of thousands of cells per site (19, 21), and for reliable analysis of functional outcome with sufficient statistical power, treatment groups of 10–25 animals are required. This means that tens of millions of cells would be needed for each experimental setup. Large-scale cell production would especially be necessary to make human clinical trials feasible.
For in vivo transplantation purposes, the suspension method of neural differentiation is suitable as it produces high amounts of hNPCs. A disadvantage of this and other differentiation methods is that the induction cues provided by medium components are not sufficient for directing all the cells simultaneously into a neural pathway. Supporting this, we observed, as others have earlier (26, 33, 42), that large, flat, epithelial-like cells that were not positive for a wide variety of neuronal and glial cell markers appeared during the differentiation. The germ layer origin and function of flat cells are not clear. It is possible that they are remnants from endodermal and mesodermal layers of embryoid bodies. Moreover, several groups have reported that at the late stages of differentiation, the characteristics of the differentiating cell population can change (i.e., a switch from neuronal toward glial cell phenotype) (15, 33). All these aspects underline the importance of carefully monitoring the progression of differentiation and selecting the cells for transplantation at the optimal phase.
In this study, we fine-tuned the method of Nat et al. (33). During the differentiation, many types of spheres were observed. We showed that EB-like spheres (termed type 2) expressed markers of pluripotency and much lower levels of neuronal markers (Pax-6, DCX, and Map-2) than the homogeneous small-sized (diameter 0.3–0.4 mm: type 1) spheres. To improve the purity of hNPCs, we suggest that type 2 spheres should be removed from the cultures as soon as they appear. In addition to sphere selection, we found that the population of DCX-positive hNPCs, capable of migration and neurogenesis (18), could be further enriched by sorting the individual cells according to their relative size.
As tracking the transplanted cells is a prerequisite, we used USPIO and lenti-GFP transductions to label the hNPCs. In our hands, lenti-GFP (MOI 5) transduction decreased the neuronal properties of the cells, which is contradictory to previous reports (7, 13). Blits et al. (7) transduced fetal rat cortical NPCs with lenti-GFP, and Dhara et al. (13) did the same for hESC-derived hNPCs. In both studies, the expression of neural markers did not reveal any significant difference when the transduced and nontransduced cells were compared. Our results showed that lenti-GFP transduction increased the percentage of flat, large-sized cells (presumably nonneuronal) over the small-sized cells. The expression of neuronal markers in the large-sized cells did not alter in response to lenti-GFP transduction. In contrast, small, morphologically neuronlike cells were sensitive to lenti-GFP as determined by the decreased expression of neuronal genes both at RNA and protein levels, and by following the growth of the cells by a continuous live cell imaging system. Importantly, the lenti mock-transduced cells did not show signs of toxic response, indicating that GFP and not the lentivirus vector per se is detrimental to neuronally differentiating hNPCs. The reason why GFP expression altered the neurality of the hNPCs is unclear. Transfer of lentiviral vectors carrying GFP to the hippocampal neurons in culture or intracerebrally to the hippocampus is widely reported to be well tolerated (23, 30, 41). Also, there are no detailed studies whether GFP alters the expression of neuronal genes in primary cells. However, GFP is known to be potentially toxic, as homozygotic transgenic mice expressing GFP driven by actin promoter and cytomegalovirus enhancer die within the first 2 weeks following birth (36). Even though we cannot define the specific role of GFP as a foreign protein in the response with altered neuronality of hNPCs, our data suggest that the dose of the lentivirus carrying GFP is critical and should be adjusted to the minimal effective level when transducing hNPCs.
An alternative way to obtain GFP-expressing hNPCs is the transduction of hESCs prior to differentiation (35). However, according to the literature, transduction efficiency varies drastically from 25% (10) to over 90% (29, 37) between the different hESC lines. These controversial results have been explained by the choice of lentiviral construct (promoter dependent gene suppression) (43), viral concentration, hESC line, and the method (flow cytometry vs. microscopical method) used to detect the cells expressing the transgene. In addition, the transgene expression may become silenced during long-term maintenance (43) and also during differentiation, even when the gene has been carried by an integrating lentiviral vector. It is also poorly understood how the lentiviral GFP transduction influences the differentiation capacity, except for the few studies that show no effect (24, 29). According to our preliminary studies (Puttonen et al., unpublished data), the transduction efficiency of the hESC line HS306 was inefficient and required very high MOI (75–100) values.
In agreement with previous studies (20, 26), we found that withdrawal of bFGF at the end of the differentiation strongly increases the expression of neuronal markers both at mRNA and protein levels. However, these matured neuronal cells are not necessarily suitable for transplantation because, being fully differentiated, their plasticity to become different types of CNS cells has decreased. Moreover, it is difficult to detach the fully differentiated neurons from the plate surface without damaging their projections. After all, it is the host tissue that provides the most favorable environment for directional guidance of transplanted hNPCs, rather than in vitro artificial conditions. Therefore, it is essential that the transplantable cells are at the optimal stage of differentiation.
In conclusion, our results show that sufficient numbers of purified hNPCs from hESCs can be produced by selecting specifically sized and shaped spheres followed by FACS based on the relative cell size. These cells were successfully labeled with a lentivirus-embedded fluorescent marker enabling them to be monitored for their migration, differentiation, and long-term survival in the CNS of various neurological mouse models. However, caution should be used when lenti-GFP transduction is applied for hNPC labeling. To this end, we suggest that our cost-effective protocol of generating hNPCs is widely applicable for preclinical studies on CNS disorders. Even though the current study included only hESC-derived hNPCs, our protocol would be useful also when producing hNPCs from hiPS cell lines.
Footnotes
Acknowledgments
This study was supported by the Academy of Finland, the Finnish Funding Agency for Technology and Innovation and Sigrid Juselius Foundation. The National Virus Vector Laboratory (Kuopio, Finland) is acknowledged for providing lentiviruses. The authors declare no conflict of interest.