
Abstract
Emerging information indicates that epigenetic modification (i.e., histone code and DNA methylation) may be integral to the maintenance and differentiation of neural stem cells (NSCs), but their actual involvement has not yet been illustrated. In this study, we demonstrated the dynamic nature of epigenetic marks during the differentiation of quiescent adult rat NSCs in neurospheres. A subpopulation of OCT4+ NSCs in the neurosphere contained histone marks, trimethylated histone 3 on lysine 27 (3me-H3K27), 2me-H3K4, and acetylated H4 (Ac-H4). A major decrease of these marks was found prior to or during differentiation, and was further diminished or reprogrammed in diverse subpopulations of migrated NSCs expressing nestin or β-III-tubulin. The DNA methylation mark 5-methyl-cytosine (5-MeC), and DNA methyltransferase (DNMT) 1 and 3a expression also correlated to the state of differentiation; they were highly present in undifferentiated NSCs but downregulated in migrated populations. In contrast, DNA methyl-CpG-binding protein (MBD1) was low in undifferentiated NSCs in neurospheres, but highly appeared in differentiating NSCs. Furthermore, we found an outward translocation of DNA methylation marker 5-MeC, DNMT1, DNMT3a, and MBD1 in NSCs as differentiation began and proceeded; 5-MeC from homogeneous nucleus to peripheral nucleus, and DMNT1a and 3a from nuclear to cytoplasm, indicating chromatin remodeling. Treatment with DNA methylation inhibitor, 5-aza-cytidine, altered DNA methylation and disrupted migration as indicated by a reduction of migrated neurons and differentiation. These results indicate that chromatin is dynamically remodeled when NSCs transform from the quiescent state to active growth, and that DNA methylation modification is essential for neural stem cell differentiation.
Introduction
Epigenetics are structural adaptations of chromosomal regions that register, signal, or perpetuate altered activity states (7). Epigenetic modification includes histone acetylation, methylation, ubiquitination, phosphorylation, and sumoylation; DNA methylation; and chromatin remodeling (12). These epigenetic marks not only regulate intrinsic gene expression, but can also be passed through dividing cells or gametes as epigenetic memory to regulate gene expression of daughter cells or progeny (6). Thus, epigenetic modification has a pronounced role in influencing cell fate and phenotypes of differentiating cells.
The study of epigenetic changes during embryonic stem (ES) or neural stem cell (NSC) differentiation is ideal for elucidating the mechanisms specific to these epigenetic regulatory processes. Recent studies have been focusing on the regulation of ES cell pluripotency, differentiation, and potential regulation of OCT4, Nanog, and Sox2 by epigenetic mechanisms (16–18,25); however, the epigenetic modification during NSC differentiation is largely unknown. Nevertheless, erroneous epigenetic alterations are known to interrupt developmental events, particularly in the nervous system, leading to conditions such as Rett's syndrome (3), immunodeficiency centromeric instability and facial syndrome (ICF) (9,14), and Prader-Willi/Angelman syndrome (15,24).
In this study, we asked what is the status of primary epigenetic marks during the quiescent stage of the neural stem cells? Will DNA methylation and histone methylation and acetylation, which mediate chromatin modification, modify at the cellular level preceding or during activation from the quiescent to the differentiation stage? To this end, we utilized previously established dorsal root ganglia (DRG) NSCs (22), which were cultured in a quiescent state as neurospheres in maintenance medium and can be to enriched medium for close observation of differentiation. We have previously characterized their differentiation profile and phenotypes in the differentiating population (22), which allowed us to evaluate the epigenetic modification at the single cell basis with a known differentiation status. Both key epigenetic marks, histone code and DNA methylation, were studied: the dimethyl-histone H3-lysine 4 (2me-H3K4) (20) and acetylated histone H4 (Ac-H4), associated with transcriptionally active euchromatin (10), and 3me-H3K27, associated with transcriptional repression (5,10,11), were highlighted in this study. The DNA methylation site 5-methyl cytosine (5-MeC), methyl binding domain (MBD1), and DNA methyltransferase (DNMT) 1 and 3, mediating DNA methylation (2,23), were analyzed. To further examine the function of DNA methylation during NSC differentiation, treatment with the DNA methylation inhibitor of 5-aza-cytidine (AZA) was also studied.
Materials and Methods
Procurement and Maintenance of Neural Stem Cells
The adult rat DRG-derived NSCs (DRG-NSCs), previously established in our laboratory (22), were maintained in Dulbecco's modified Eagle medium/F12 Nutrient Mix (DMEM/F12) media containing N2 supplement (12 μl/ml, Invitrogen, Carlsbad, CA) and penicillin-streptomycin (12 μl/m, Sigma, St. Louis, MO), and grown in a humidified incubator at 37°C and 5% CO2. Media was supplemented with 10 ng/ml epidermal growth factor (EGF, Harlan Bioproducts for Science, Indianapolis, IN) and basic fibroblast growth factor (bFGF, PeproTech, Rocky Hill, NJ) twice per week for maintenance of NSCs. The NSCs were maintained in neurosphere form. During the medium changes throughout the years, no passaging (trypsin digestion and cell transferring, except dividing into multiple flasks) was performed. All neurospheres for analyses were screened by size, ≤0.5 mm diameter (postdifferentiation, round neurosphere), for their robust growth.
Differentiation Studies
The undifferentiated and differentiating neurospheres were defined as follows. The undifferentiated neurospheres (up to 100+ in 0.5–1 ml culture media) were obtained from the above culture medium that was deprived of EGF + bFGF for 2 days. The neurospheres for differentiation experiments were withdrawn from EGF + bFGF supplementation and equilibrated for 5–10 min in Neurobasal media (no supplements) before being subplated into 16-well chamber slides (Nunc, Rochester, NY) coated with poly-D-lysine (20 mg/ml, Sigma) and laminin (1 mg/ml, Sigma). No more than three neurospheres were placed per well. Neurospheres were allowed to differentiate for 4 days in differentiation media consisting of Neurobasal media supplemented with 10% fetal bovine serum, 1.2% B27, and 1.2% penicillin-streptomycin. All cells were fixed in freshly prepared fixative [4% paraformaldehyde (PFA) in phosphate buffer].
5-Aza-Cytidine Studies
The differentiating neurospheres, with the paradigm described above, were divided into two groups: 5-aza-cytidine (AZA, 50 ng/ml, Sigma) (n = 16 wells) or medium vehicle only (control, n = 16 wells). Control and AZA treatments were conducted simultaneously, but each were separated to their own 16-well chamber slides to avoid cross-transfer between treatment and control wells. AZA was administered at the beginning of differentiation; no additional treatment or medium changes were provided during the 4-day differentiation period. At the end of the differentiation period, the cells were washed with 0.1 M PBS and fixed with the same fixative above for immunocytochemical analyses.
Antibodies and Immunocytochemistry
Histone methylation was studied using immunofluorescence cytochemistry with polyclonal antibodies against dimethyl-histone H3 on lysine 4 (rabbit-anti-2me-H3K4, 1:200, Millipore, Temecula, CA), a bivalent marker for the transition of transcriptional activation (20). Repression of developmentally regulated genes was investigated using a rabbit polyclonal antibody against trimethyl-histone H3 on lysine 27 (3me-H3K27, 1:750, Active Motif, Carlsbad, CA) (5). Histone H4 acetylation, known to be involved in transcriptional activation, was investigated by immunocytochemistry [rabbit-anti-Ac-H4 (lysine 5, 8, 12, 16), 1:500, Millipore]. DNA methylation was investigated using antibodies against 5-methyl-cytosine (goat-anti-5-MeC, 1:250, GeneTex, San Antonio, TX). Changes in expression of the enzyme responsible for DNA methylation, DNA methyltransferase (DNMT), were investigated using polyclonal antibodies against DNMT1 (made in goat, 1:200, Santa Cruz Biotechnology, Santa Cruz, CA), which is responsible for maintaining DNA methylation, and DNMT3a (made in goat, 1:200, Santa Cruz Biotechnology), responsible for de novo methylation. Methylation of CpG-dinucleotides was detected using a rabbit polyclonal antibody against methyl-CpG binding domain 1 (MBD1, 1:200, Millipore). AZA-treated cultures were processed for immunocytochemical staining to assess DNA methylation (DNMT1a and 3a; 5-MeC antibodies) and histone marks (2me-H3K4, 3me-H3K27 antibodies) (n = 4–5 of 14/ staining; 2 control with preimmune serum) and was confirmed in triplicate. The above antibodies were commercially characterized for their titer as well as specificity, and screened through our initial staining in vivo with embryonic tissue for confirmation of their intranuclear staining and known distribution. There were four to five wells for each immunostaining containing two to three neurospheres per well; neurospheres were sampled from each of the four wells for analysis.
Immunostaining followed a routine procedure as previously established for stem cell cultures in our laboratory (8,26). In brief, endogenous peroxide was quenched with 3% H2O2, and 0.3% Triton X-100 was applied for 30 min to permeabilize the cell membranes. For 5-MeC staining, cells were incubated with 2N HCl. Nonspecific binding was blocked using 4% normal serum from the species used to make the secondary antibody, plus 0.1% Triton X-100 in PBS. Primary antibodies (detailed above) were incubated overnight at room temperature in the blocking buffer corresponding to the species of the secondary antibody. For immunofluorescent staining, the NSCs were washed with PBS and incubated with an Alexa 488 or 635 fluorophor conjugated secondary antibody (against the primary antibody species) at room temperature for 90 min and counterstained with 4′,6-diamidino-2-phenylindole (DAPI A-T-specific DNA stain at 350 nm wavelength, Invitrogen). Staining of undifferentiated NSCs was done in a 1.5-ml Eppendorf centrifuge tube following the procedures above.
Double-staining was done to confirm the phenotype and degree of differentiation. The pluripotent stem cell marker, OCT4 (goat, 1:400, Santa Cruz Biotechnology), was stained to assess retention of pluripotency. Proliferating cells were stained with a monoclonal antibody against proliferating cellular nuclear antigen (PCNA, 1: 500, Calbiochem, Gibbstown, NJ). Assessment of neural stem cell gene expression was done by the immunostaining of Sox2 (rabbit, 1:750, Millipore) or nestin (mouse, Developmental Studies Hybridoma Bank, University of Iowa, 1:400). Immunostaining for glial cells was performed with polyclonal antibody against the glial fibrillary acidic protein (GFAP, 1:400, DAKO, Carpinteria, CA). Controls included omission of the primary antibody, incubating with preimmune serum, or preincubation of antigen to assure the specificity prior to the staining of NSC.
Quantitative Analysis
Both intensity and density of the immunostaining were considered for analysis in the study. Because the sizes of neurospheres were not all identical, the migration density of cells (i.e., number of differentiated cells per neurosphere) would be affected by this variable. We thus did not analyze the epigenetic marks by cell number but rather used the ratio of representative cells of specific intensity. Furthermore, because all cells in the neurosphere were not differentiated equally, the intensity of the epigenetic markers and phenotype expression were individually different, which are hypothesized to correlate with their differentiation status. Thus, it is reasonable that we analyze the population of cell intensity, particularly along the axis of their migration path.
Distribution of Histone Marks and DNA Methylation Proteins in NSC Throughout the Differentiation Stages of Neural Stem Cells
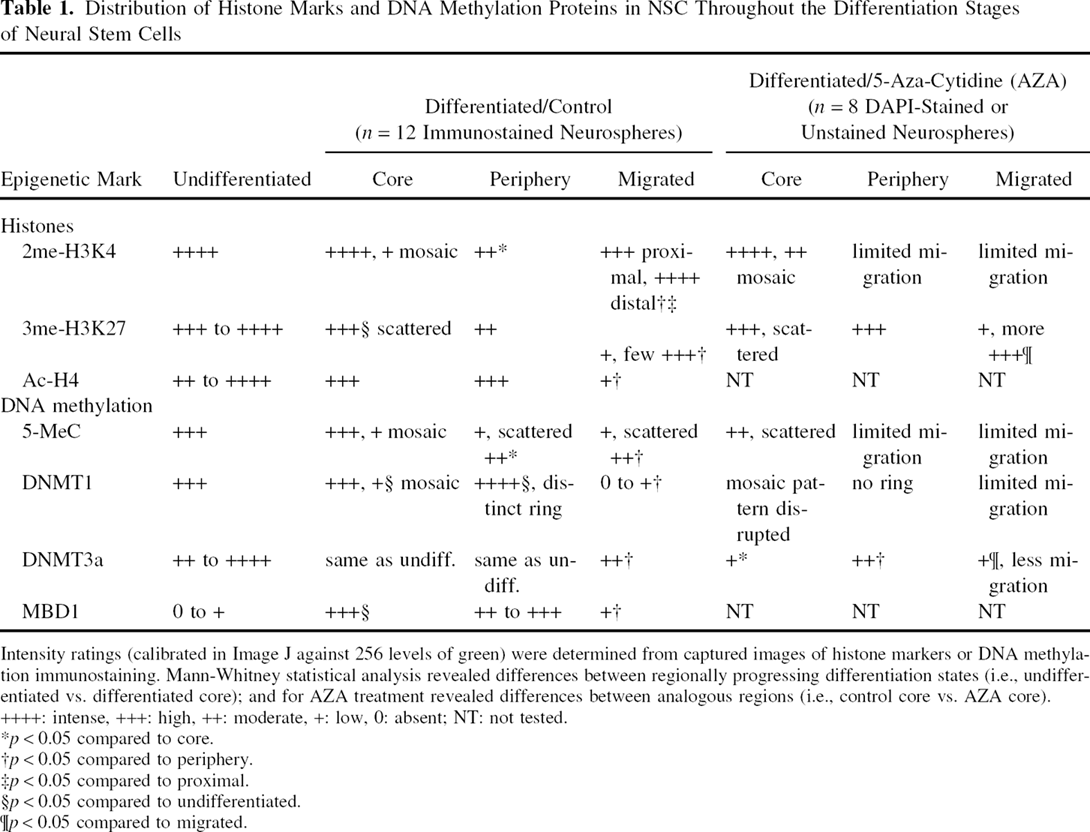
Intensity ratings (calibrated in Image J against 256 levels of green) were determined from captured images of histone markers or DNA methylation immunostaining. Mann-Whitney statistical analysis revealed differences between regionally progressing differentiation states (i.e., undifferentiated vs. differentiated core); and for AZA treatment revealed differences between analogous regions (i.e., control core vs. AZA core). ++++: intense, +++: high, ++: moderate, +: low, 0: absent; NT: not tested.
p < 0.05 compared to core.
p < 0.05 compared to periphery.
p < 0.05 compared to proximal.
p < 0.05 compared to undifferentiated.
p < 0.05 compared to migrated.
Quantitation of the effect of AZA on migration of differentiated NSCs was conducted. Fluorescent or bright-field images taken at 10x magnification were overlaid with a 1 × 1-in. grid using Adobe Photoshop software (Adobe Systems, Boston, MA). The neurosphere was divided into three regions: core, corresponding to the densely packed inner mass of tightly clustered cells; periphery, a zone stretching out approximately 100 μm from the edge of the core, consisting of early differentiating cells that were less densely packed, starting to leave the neurosphere, changing morphologically from round neuroepithelial cells to tear-drop shaped neural-like cells, and some at the outer edge of the periphery with extended neurites; and the migrated zone, consisting of all cells beyond the periphery, which have varying degrees of differentiation. The cells in the migrated zone were counted in eight neurospheres. Positive cells were stained with DAPI or had a clearly distinguishable cytoplasm in bright-field from their nearest neighbor. Tightly clustered or multilayered areas were excluded from analysis. Statistical analysis t-tests were done using StatView (SAS, Carey, NC).
Results
Epigenetic Marks Transition From Quiescence to Differentiation
The floating neurospheres obtained from the cultures remained morphologically undifferentiated: cells were round and small and had a distinct single nucleus in the center of the cytoplasm. Many cells in the undifferentiated neurosphere (Fig. 1A, C, E) were OCT4+ with a small fraction also expressing Sox2+, indicating a mixed heterogeneous population with various advanced stem cell status. Low expression of glial fibrillary acidic protein (GFAP) was seen in undifferentiated neurospheres. After 4 days of culture on substrate-coated chamber slides, the NSCs demonstrated a transition of differentiation and migration out from the center of the neurosphere as reported previously (22). In the core of the differentiating neurosphere, the NSCs were round and small, OCT4+ (Fig. 1B), nestin negative, and dividing cells were noted by immunostaining for PCNA (not shown). Dividing nuclei were also occasionally present. In the periphery of the neurosphere, much like the undifferentiated groups, many NSCs remained round, but a subpopulation of the cells formed angular cytoplasmic expansions, some with fiber extensions. In the migrated zone, more differentiated cells migrated out of neurosphere, some retaining Sox2 expression (Fig. 1D), and acquired glial or neuronal morphology. The NSCs in the periphery and those that migrated out of the neurospheres were often stained with GFAP (Fig. 1F) and Hu (not shown). The epigenetic marks and their modifications were present in the undifferentiated neurospheres and during transition to each differentiation zone: the core and periphery of the neurosphere, and the migrated region (outside of the neurosphere).
DNA methylation marks in undifferentiated and differentiated neural stem cells. High levels of OCT4 (A) and Sox2 immunostaining (C) are evident in undifferentiated NSCs, but GFAP imunostaining remained low (E). Moderate OCT4 (B) was expressed after differentiation; many cells were Sox2 immunostained (D) and GFAP expression (F) was highly evident in the neurosphere and in migrating cells. DNMT1 expression was highly evident prior to differentiation (G). During differentiation, a ring-like distribution of DMNT1+ cells was present at the neurosphere periphery (H, arrows) where cells began to differentiate. Prior to differentiation, MBD1 (I) expression was weak or absent, initiating as differentiation proceeded (J; arrowhead, nucleus; arrow, cytoplasm). 5-MeC methylation marker (K) was highly evident prior to differentiation, and remained at a high level of intensity (L) following differentiation. Scale bars: 100 μm (A, C, E, G, H, K, L); 10 μm (B, D, I, J).
DNA Methylation
The undifferentiated neurospheres contained high expression of DNMT1, while the expression in the core of the differentiating neurospheres was a mosaic of highly expressing and weakly expressing NSCs that were more intensely stained (p < 0.05), compared to the undifferentiated (Fig. 1G). In cells beginning differentiation at the periphery of the neurosphere, a notable ring (edge of neurosphere) of relatively strong DNMT1 expression (Fig. 1H) was observed (p < 0.05), compared to the undifferentiated. Migrated NSCs, however, significantly downregulated DNMT1 (p < 0.05), compared to the periphery. Interestingly, the expression of MBD1 was very low or absent in NSCs of the undifferentiated neurospheres (Fig. 1I). The NSCs at the core and periphery of the differentiating neurospheres expressed MBD1 at moderate levels, differing from the undifferentiated (Fig. 1I vs. J). Migrated NSCs downregulated MBD1 significantly (p < 0.05) compared to the cells at the periphery of the neurospheres. Nearly all of the NSCs of the undifferentiated neurospheres contained 5-MeC (Fig. 1K). The core of the differentiating neurospheres exhibited a mosaic of high and weak levels of 5-MeC markers (Fig. 1L). The periphery and migrated zones generally exhibited little 5-MeC immunostaining, but moderate levels of 5-MeC immunostaining were occasionally seen scattered throughout these zones. The expression of DNMT3a in the undifferentiated neurospheres was variable; the core and periphery of differentiating neurospheres was similar to undifferentiated neurospheres, while the migrated NSCs downregulated DNMT3a.
Histone Modifications
The state of histone marks was found to evolve with the development of NSCs. After 4 days of culture, the NSCs in the core of the differentiating neurosphere exhibited a mosaic pattern of 2me-H3K4 immunostaining (Fig. 2, top panel) with weakly stained cells interspersed among groups of highly stained cells (as per intensity calibrations) (Fig. 2, bottom panel); many cells in the core retained OCT4 expression. NSCs beginning to differentiate at the periphery of the neurosphere showed significantly decreased 2me-H3K4 marks (p < 0.05), compared to the differentiated core. As their differentiation program advanced, they began to exhibit a significant increase (p < 0.05) in 2me-H3K4 marks as they migrated out from the neurosphere periphery (Fig. 2, top panel). A few small groups of migrated neural progenitors in the distal areas had a further increase in 2me-H3K4 immunostaining (p < 0.05), compared to the periphery and proximal areas (Table 1, Fig. 2, top panel, compare E, F, G; periphery, migrated proximal, migrated distal, respectively). Many of the migrated population of 2me-H3K4+ cells also expressed PCNA, indicating continued proliferation at the time of subplating. Double-staining with nestin revealed a colocalization of 2me-H3K4 in the migrated population, although some of the nestin+ cells had very low levels of 2me-H3K4.
The 3me-H3K27 marks appeared in a scattered, random fashion in the core of both undifferentiated and differentiating neurospheres (Fig. 2, middle panel), similar to 2me-H3K4 marks, but a sharp decrease was noticed beginning at the periphery of the core and continuing into the migrated zone. Some small clusters of NSCs in the distal migrated areas, however, regained 3me-H3K27 marks at high levels seen in the core and were significantly different (p < 0.05) from the periphery (see Fig. 2K). Further, bright-field (Fig. 2L) indicated that these cells were full of granulation particles in the cytoplasm and were much less differentiated compared to the less intense 3me-H3K27 immunostained neighboring cells that were well differentiated with fiber extensions. Ac-H4 marks appeared similar to 2me-H3K4 marks, except in the migratory zone: 2me-H3K4 increased whereas Ac-H4 decreased (see Table 1). Notably, the migrated Ac-H4 marks were significantly diminished (p < 0.05) compared to undifferentiated, core, and periphery.
Translocation of Epigenetic Markers and Differentiation
The compartmentalization of histone marks was first assessed for their association with DAPI counter-staining dense DNA staining regions (DAPI-bright)—presumably heterochromatin—and the light DNA staining (DAPI-dim) regions—presumably euchromatin (13)—in undifferentiated NSC neurospheres. Nuclear 2me-H3K4 generally correlated DAPI-dim areas indicative of DNA-sparse and euchromatin orientation (Fig. 3A, B, arrowheads). The 3me-H3K27 associated closely with the DAPI-bright DNA, as indicated by the overlapping DAPI and 3me-H3K27 immunostaining granulation (Fig. 3C, D, arrows). Ac-H4 also appeared to associate with heterochromatin (Fig. 3E, F, arrows) in the undifferentiated neurospheres. The exception was when 2me-H3K4 associated with heterochromatin during metaphase (Fig. 3A, B, crossed arrows).
Upper panel: Regional distribution of 2me-H3K4 during neural stem cell differentiation. 2me-H3K4+ cells in immunofluorescence (A), bright-field (B), and merged (C) images. Intense 2me-H3K4 staining remained in the neurosphere core (I), but subsided in the peripheral zone (II). The 2me-H3K4 mark reappeared (moderately intense) in the proximal zone (III) and further intensified in the distal zone (IV). High-power images from each zone are shown in (D–G). A noticeable duplication of 2me-H3K4 marks is evident in the cell during division processes (G, arrow). Middle panel: Regional distribution of 3me-H3K27 during neural stem cell differentiation. High intensity of 3me-H3K27 remained in the core of the neurosphere, but declined in the periphery of the neurosphere and migrated cells, as shown by immunofluorescent staining (H), corresponding bright-field image (I), and the merged (J). The dashed line delineates the boundary between the high-intensity core and the low-intensity periphery in the neurosphere. Migrated NSCs with high intensity of 3me-H3K27 in the nucleus (K, bright-field, and L, immunofluorescence of the same field; arrows) were matched with granular cytoplasmic features (K, L; arrowheads). Scale bars: 100 μm (A, C, H–J); 10 μm (D–G, K, L). Lower panel: Calibration of immunofluorescent intensity was done using Image J. Intensity was classified into five levels: Intense (++++) >0.100 (4), high (+++) 0.090–0.099 (3), moderate (++) 0.080–0.089 (2), low (+) <0.080 (1), or absent (0). The resulting distribution is graphed. Scale bar: 10 μm (all). Correlation of histone marks (A, C, E) and DAPI (B, D, F) in undifferentiated NSCs. 3me-H3K27 (A, arrow) had a granular pattern that correlated well with DAPI-bright staining for DNA (B, arrow), presumably heterochromatin. Likewise, high-intensity Ac-H4 nuclei (C, arrow) preferentially correlated with DAPI-bright counterstaining (D, arrow). The 2me-H3K4 mark largely correlated with DAPI-dim staining, potentially indicating association with euchromatin (E, arrowhead; F). An exception for 2me-H3K4-DAPI-dim association was also evident when 2me-H3K4 associated with brighter DAPI staining (E, crossed arrow). Scale bar: 10 μm (all).

The distributions of 5-MeC, DNMT1, DNMT3a, MBD1, and Ac-H4 changed upon differentiation (summarized in Table 2). DNA methyltransferase demonstrated a dramatic translocation during differentiation. 5-MeC was present throughout the nucleus of undifferentiated NSCs, evacuated from nucleoli of NSC nucleus in the core of differentiating neurospheres, and further translocated into the perinuclear compartment in migrated and differentiated NSCs (Fig. 4A, B). DNMT1 was found in both the nucleus and the cytoplasm in undifferentiated neurospheres, but translocated entirely into the cytoplasm in differentiating core and in migrated NSCs (Fig. 4C, D). DNMT3a was distributed exclusively in the nucleus of undifferentiated NSCs, but nearly all expression translocated into the cytoplasm at the beginning of differentiation, as seen in the core and periphery of differentiated neurospheres and migrated cells. Interestingly, MBD1 was not expressed (or expressed at very low levels) in undifferentiated NSCs (Fig. 1C), but was seen in both the nucleus and cytoplasm of differentiating core and migrated NSCs (Fig. 1F, arrow). It is worthwhile to note that DNMT1, DN-MT3a, and MBD1 were the only marks to be found in the cytoplasm.
Changes in nuclear distribution of DNA methylation and 2me-H3K4 with NSC differentiation. In undifferentiated NSCs, 5-MeC immunoreactivity distributed throughout the nucleus (A, arrow), but upon differentiation, 5-MeC was perinuclear (B). In undifferentiated NSCs DNMT1 was expressed in the nucleus and cytoplasm (C); however, following differentiation, DNMT1 expression became exclusively cytoplasmic (D). 2me-H3K4 in undifferentiated and differentiated NSCs was found in the nucleus, but not nucleoli (E, F). Scale bar: 10 μm (A–F). Nuclear and Regional Distribution of Epigenetic Marks and DNA Methylation Proteins Neural stem cells were analyzed at various stages of differentiation for comparison of the influence of 5-aza-cytidine on nuclear distribution of epigenetic marks and DNA methylation proteins. Differentiating neurospheres were divided regionally into core (center) and migrated (NSCs leaving the neurosphere) for assessment of immunostaining. Nuclear or perinuclear distributions were confirmed by DAPI counter-staining. NT: not tested.

Ac-H4 avoided the center of the nucleus (presumably nucleolus) in undifferentiated NSCs, but filled it in all cells upon differentiation. 2me-H3K4 was found in the nucleus, similarly circumventing supposed nucleolus (Fig. 4E, F), while 3me-H3K27 exhibited a characteristic granule-like staining throughout the nucleus (Fig. 2K, L, arrowheads). Nuclear localization of 2me-H3K4 and 3me-H3K27 was not changed upon differentiation or migration. However, a clear transfer of the histone mark from parental cell to daughter cells was demonstrated during mitosis; the 2me-H3K4 marks divided into two comparable amounts, associating with DNA (indicated by DAPI) in two progeny (Fig. 2G).
Effect of 5-Aza-Cytidine Treatment
The 5-aza-cytidine (AZA) treatment altered histone and DNA methylation, although preferentially affected DNA methylation. AZA significantly increased (p < 0.05) the intensity of 3me-H3K27 in the migrated cells, compared to the differentiating migrated control (Fig. 5A, B), but did not affect 2me-H3K4 (Ac-H4 was not studied). AZA treatment disrupted the mosaic pattern of 5-MeC in the core and considerably altered the normal ring-shaped distribution of DMNT1 found in the periphery of neurospheres (Fig. 5C, D). DMNT3a immunostained cells notably declined in all zones of differentiation, compared to their respective differentiated controls (Table 1).
Effect of AZA on NSC differentiation. The predominant effect of AZA was particularly noticeable in 3me-H3K27 and DNMT1 expression. Normal differentiated NSCs had a gradient of 3me-H3K27 intensity (A) from the neurosphere core (high) to the migrated zone (low, with a few at high intensity). AZA further inhibited migration (B) and increased the presence of intense 3me-H3K27 in the migrated zone (B). Expression of DNMT1 in control neurospheres had a mosaiclike pattern in the core and a peripheral ring (C). AZA disrupted DNMT1 distribution pattern throughout the neurosphere (D). DAPI-stained image of control (E) and AZA-treated cells (F) used to assess the effect of inhibited methylation on stem cell differentiation and migration. Scale bars: 100 μm (all).
Effect of 5-Aza-Cytidine on Migration of DRG Neural Stem Cells
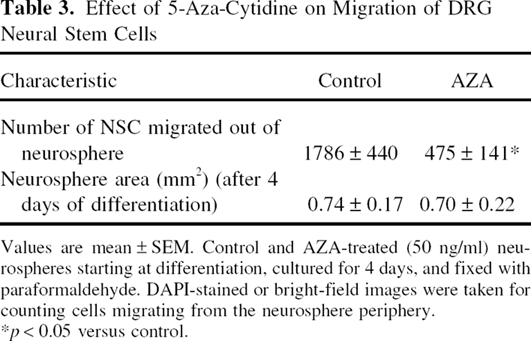
Values are mean ± SEM. Control and AZA-treated (50 ng/ml) neurospheres starting at differentiation, cultured for 4 days, and fixed with paraformaldehyde. DAPI-stained or bright-field images were taken for counting cells migrating from the neurosphere periphery.
p < 0.05 versus control.
AZA also affected the intracellular distribution of epigenetic markers. AZA treatment changed the intracellular distribution of migrated cells in 5-MeC. 5-MeC, originally only perinuclear, was found throughout the nucleus, but excluded from the nucleoli. Some cells with perinuclear distribution of 5-MeC appeared to be at the initial stage of mitosis. Although the expression profile of DNMT1 was altered due to the AZA treatment, the intracellular distribution of DNMT1 did not change.
Discussion
Epigenetic State of Quiescent NSCs
The large presence of OCT4+ that associates with progenitor cells in the neurospheres confirms that NSCs from adult DRG are maintained as progenitors in nature and are capable of long-term, if not indefinite, renewal. Not all NSCs were in the same stage of stem cellness, thus presenting an opportunity to observe a relationship between the differentiation state and the cellular level of epigenetic marks. For example, the major euchromatin histone marks 2me-H3K4 and Ac-H4 were found to associate with OCT4+ cells and obviously prevailed in the NSC neurospheres over the period of long-term maintenance. These observations indicate that these gene activation histone marks might associate with genes in the active recycling of general stem cells in the neurospheres. On the other hand, the heterochromatic 3me-H3K27 also prevailed in the nondifferentiated NSCs. This is similarly demonstrated in embryonic stem (ES) cells. It is suggested that lineage-specific genes are primed for expression in ES cells but are held in check by opposing histone marks or chromatin state (5). The pluripotency of ES cells is characterized by a specific epigenetic profile where lineage-specific genes may be accessible, but carry repressive H3K27 trimethylation modifications. H3K27 methylation is functionally important for preventing expression of these genes in ES cells; 2me-H3K4 is a bivalent marker associated with both repressed and active transcription genes, while the further methylated form 3me-H3K4 is associated with active gene transcription (20). Acetylated H4 is associated with the genes of active transcription. Thus, the presence of these histone marks associating with opposing chromatin states indicates that they are either associated with genes in check to prevent further lineage differentiation, or for the maintenance of NSC renewal. Chromatin-immunoprecipitation-on-chip (ChIP-on-Chip) or ChIP sequencing analysis will allow further identification of the histone mark-associated genes prevailing during stem cell maintenance.
The DNA methylation (5-MeC) and the enzymes for DNA methylation (DNMTs) were also present in quiescent NSCs during maintenance. This observation indicates that DNA methylation was dynamic and active during renewal and maintaining progenitor cells. DNA methylation marks, generally associated with gene repression, are likely associated with the genes for differentiation, resulting in the maintenance of the quiescent or undifferentiating state of the neurosphere. However, MBD1, which recognizes methyl-CpG and represses transcription, was expressed minimally in the undifferentiated neurospheres. It is reported that MBD1 can facilitate repression during DNA replication and have a silencing role during S phase of the cell cycle (21). Thus, the low MBD1 binding to the specific cell cycle genes would favor the continuous renewal of the NSCs. The role of MBD1 in mediating the suppression of cell proliferation in NSCs is in agreement with our finding that expression of MBD1 increased in the differentiating neurosphere as proliferation declined and differentiation began.
Epigenetic Modification During Differentiation of NSCs
The current data indicated that the state of epigenetic marks evolved with differentiation of NSCs. The topographical co-registration of epigenetic modifications and the various differentiation states of differentiating cells in zoning in and out of neurospheres allowed us, in part, to discern the epigenetic program of differentiating NSCs (Fig. 2). During the 4-day culture, some NSCs remained undifferentiated in the core of neurospheres; others began, or were about to begin, the differentiation process in the periphery of the neurosphere and advanced into differentiation as they migrated away from the neurosphere. In parallel, the histone marks that remained highly prevalent in the neurosphere core were greatly reduced in the periphery zone of neurospheres, and largely diminished in the migrated NSCs. This temporal and spatial correlation suggests that turning off the high-profile Ac-H4, 2me-H3K4, and 3me-H3K27 marks in association with the previously engaged genes for stem cell maintenance is a prerequisite of the NSC restriction into neural differentiation. This is demonstrated by migrated cells that: contained diminished histone marks, OCT4-negative immunostaining, and acquired neural morphology with neural fibers and smooth outlines, all indicating that reduction of these histone marks allowed for neural differentiation. In contrast, mixed among the migrated and differentiated cells, was a scattered group of cells with a highly granulated cytoplasm and undifferentiated morphology, which were OCT4 negative and maintained or regained high 3me-H3K4 and 3me-H3K27 marks. We believe that this subpopulation of cells with high H3K4 and H3K27 methylation, which is obviously not associated with the expression of OCT4, might be associated with a new set of genes for a distinct heterogeneous subpopulation. The high granulation in the cytoplasm and the nondifferentiated morphology suggest that this migrated subpopulation may undergo further differentiation into other phenotypes similar to the migrated neural crest cells in peripheral tissue. Deciphering methylated H3K4 and H3K27 associated genes would provide insight on this phenotype cell development and is in progress.
DNMT3a and DNMT1, for de novo and maintenance DNA methylation, respectively, adopted a program distinct from the histone marks. Their activities increased at the beginning of differentiation, as indicated by contrasting the core and peripheral zones of the neurosphere. The expression of these two DNA methylating enzymes is higher in the periphery ring than in the core of the neurosphere during early differentiation. This suggests an increase in de novo and maintenance of DNA methylation just prior to differentiation. A characteristic expression level of DNMT1 for maintenance of DNA methylation in the differentiating neurosphere was found, as indicated by the high-expression ring formed by DNMT1 imunostaining in the periphery of the neurosphere (Fig. 1D). This development supports the notion that a larger population of genes is suppressed during differentiation into restricted cell types. Genome-wide gene expression analysis revealed that mouse stem cells, such as embryonic stem cells and neural stem cells, express approximately 40–60% of the total genes in a genome; in contrast, most differentiated cells express only 10–20% of the total genes (1,4). Further, as we demonstrated, the rise of these methylation activities at the beginning of differentiation subsided after NSCs migrated and proceeded with advanced differentiation, indicating that the DNA methylation activities were low in mature neural cells in which housekeeping and functional activity genes are active. These observations indicate that the transient rise in DNMT activities for DNA methylation is a required program prior to differentiation. Our high throughput MeDIP-chip analysis of genome-wide DNA methylation agrees that there is actively increased DNA methylation as well as decreased DNA methylation in genes with moderate methylation level in the NSCs going through differentiation (manuscript in preparation). This hypothesis is supported by the retardation of migration and differentiation of NSCs by DNA methylation inhibitor AZA. This mechanism of AZA-inhibited gene methylation has proven to be a useful strategy to increase transgene expression following transplantation (19). In the AZA-treated NSCs, a disruption of 3me-H3K27 marks and DNMT1 distribution was also observed, which appears to be in line with retarded migration and differentiation. Further support of the role of histone markers and DNA methylation markers on differentiation is shown by their intranuclear/intracellular translocation indicated in the section below.
Chromatin Remodeling During Differentiation
The distribution of the epigenetic marks within the NSCs is closely related to the chromatin state. Our results indicated that all of the epigenetic marks were located within the nucleus of NSCs, but the DNA methylation-associated enzymes/protein (DNMTs, MBD1) were not; the major histone marks and the DNA methylation mark 5-MeC are confined to the nucleus through differentiation, while the enzymes for DNA methylation transfer and the DNA methylation binding protein were more dynamic in different compartments of the nucleus and also expanded into the cytoplasm upon differentiation. The compartmentalization of the epigenetic marks within the nucleus is the key to the heterochromatin and euchromatin states. The examined epigenetic markers were each characteristically distributed: Ac-H4 was ubiquitously distributed in the nucleus, 2me-H3K4 was in the nucleus, but not the presumably nucleoli, and 3me-H3K27 aggregated in granule-like forms. Because the major epigenetic markers mediate chromatin state and accessibility of the gene for transcription, their distribution and reorganization are likely to have significant outcomes. For instance, 5-MeC distinctly relocated from its originally homogeneous distribution in the nucleus, gradually evacuated nucleolus, and finally became confined to the perinucleus (close to nuclear membrane) (Table 2). This transition was concurrent with the progression of the differentiation program of NSCs from the undifferentiated neurosphere, to the differentiating neurosphere core, and finally to the migrated NSCs. The confinement of the inhibitory DNA methylation mark to the perinucleus of more heterochromatin loci and arrangement of euchromatin in the core of nucleus may facilitate transcription of functional related gene clusters during dynamic phase of differentiation.
The intracellular relocation of the DNMTs was also associated with differentiation. The nuclear DNMTs prevailed in the undifferentiated state of NSCs, while cytoplasmic DNMTs were dominant in differentiating NSCs. This is consistent with the compartmentalization of the 5-MeC from the nucleus to the perinucleus. This relocation may have effects on remodeling of the heterochromatin state in NSCs. A clear support of this finding comes from bright-field microscopy double registration, which demonstrated that those migrated cells containing bright nuclear 5-MeC were not well differentiated, but the migrated NSCs containing dim and perinuclear 5-MeC were well differentiated with neural fiber extensions (Fig. 4). These translocations of 5-MeC and DNMT transition along the differentiation profile are the first report of this kind, which is critical for understanding epigenetic regulation of neural stem cells differentiation, and warrants further investigation of its associated genes.
In conclusion, we demonstrated that the epigenetic marks 3me-H3K27, 2me-H3K4, Ac-H4, and 5-MeC are prevalent throughout quiescent NSCs. Reduction of these epigenetic marks right before differentiation of the NSCs indicates that these epigenetic marks are associated with the genes that maintain the quiescent state of the NSCs. A new wave of epigenetic marks appears as further differentiation proceeds in a subpopulation of NSCs. Meanwhile, characteristic translocation of Ac-H4, 5-MeC, DNMT1, and DNMT3a occurred during differentiation, which may mediate the heterochromatin and euchromatin dynamics. AZA disrupted intracellular distribution patterns of 2me-H3K4, DNMT1, and 5-MeC of the migrated NSCs, affecting chromatin remodeling at differentiation. These alterations are in parallel with the retarded migration and differentiation of the NSCs. The reported epigenetic dynamics in these distinct states of the NSC provide useful information for future investigation, including chromatin immunoprecipitation analysis of the specific genes, which associates with the epigenetic marks in mediating the awakening of neural stem cells from quiescent states.
Footnotes
Acknowledgments
This study is supported by AA016698 to F.C.Z. The authors thank Lijun Ni for maintaining the neural stem cells and Mahdi Hematian Ashrafian for his assistance in AZA quantitation. The authors of this manuscript have no financial or other relationship with any company whose products may have been used in preparation of this work.