
Abstract
Magnetic resonance imaging (MRI) has proven to be effective in tracking the distribution of transplanted stem cells to target organs by way of labeling cells with superparamagnetic iron oxide particles (SPIO). However, the effect of SPIO upon labeled cells is still unclear on a cellular level. With this study, the proliferation and viability of New Zealand rabbit peripheral blood endothelial progenitor cells (EPCs) labeled with SPIO were evaluated and in vitro images were obtained using a 1.5 T MR scanner. Mononuclear cells (MNCs) were isolated from peripheral blood of the adult New Zealand rabbit and cultured in fibronectin-coated culture flasks, in which EPCs were identified from cell morphology, outgrowth characteristics, and internalization of DiI-Ac-LDL and binding to FITC-UEA I. EPCs were incubated with the self-synthesized poly-L-lysine-conjugated SPIO (PLL-SPIO) particles in a range of concentrations. The prevalence of iron-containing vesicles or endosomes in the cytoplasm of labeled cells was confirmed with Prussian blue staining and transmission electron microscopy. Tetrazolium salt (MTT) assay, cell apoptosis, and cycle detection were assessed to evaluate proliferation and function of various concentrations, magnetically labeled EPCs. The quantity of iron per cell was determined by atomic absorption spectrometry. The cells underwent MRI with different sequences. The result showed that rabbit EPCs were efficiently labeled with the home synthesized PLL-SPIO. There was found to be no statistically significant difference in the MTT values of light absorption measured on the third and fifth days. Between labeled and unlabeled cells, there were also no aberrations found in the cell cycles, apoptosis, or growth curves. The atomic absorption spectrophotometer showed that the intracellular content of Fe decreased as more time elapsed after labeling. The labeled EPCs demonstrated a loss of MRI signal intensity (SI) when compared with the SI of unlabeled cells. These signal changes (ΔSI) were visible when cells were labeled with more than 5 × 10⁴/ml of SPIO. The change in SI corresponded to the amount of iron in the EPCs, which reached a maximum at T2*WI. These data demonstrate that EPCs from the peripheral blood of the New Zealand rabbit can be effectively labeled with self-synthesized PLL-SPIO with minimal effects on cell proliferation and activity. Magnetically labeled EPCs can be imaged at 1.5 T MR and can therefore be used as an MR tracker of implanted EPCs.
Keywords
Introduction
Endothelial progenitor cells (EPCs) originating from bone marrow play a significant role in neovascularization of ischemic tissues and in reendothelialization of injured blood vessels. In 1997, Asahara et al. (2) first isolated EPCs from human peripheral blood with the magnetic bead selection technique and demonstrated that EPCs differentiate by in vitro methods into endothelial cells. Since then, many studies have been conducted and have shown the great therapeutic potential of EPCs in cardiovascular and tissue repair, refractory diabetic wound healing, and the bioengineering of prosthetic grafts, etc. (4, 6, 8, 19, 22).
It has been well known (17, 20) that EPCs exist in the systemic circulation, which migrate and incorporate into the sites of damaged endothelium and neovascularization. They may be helpful in therapeutic strategies of repairing endothelium and angiogenesis. A noninvasive in vivo technique that permits an evaluation of the efficiency of transplantation and the potential migration of the transplanted cells would prove to be an important tool for treatment assessment. Additionally, it may serve to illuminate certain mechanisms in cell therapy. In our laboratory, we have developed the technique to use superparamagnetic particles (PLL-SPIO, a complex of iron oxide nanoparticles conjugated with amino acid polymer poly-L-lysine) to label EPCs for visualization with MR imaging. We have successfully visualized the SPIO-labeled New Zealand rabbit EPCs locally transplanted into a rabbit atherosclerotic model (13).
However, it is not very clear whether the in vitro labeling technique in EPCs is safe. The purpose of our study was to investigate whether and how the labeling of EPCs with PLL-SPIO affects the biological properties of EPCs and how effectively labeled cells are tracked by MR imaging.
Materials and Methods
EPC Isolation and Culture
EPCs were isolated from newly collected rabbit blood. Six New Zealand white rabbits, weighing 2.5 kg each (Jingling Farm Center for Animal Experiments, Nanjing, China), were anesthetized with a 10 mg/kg pentobarbital sodium IV. Fresh blood (20 ml) was collected from each by a direct puncture into the left ventricle with a 14-gauge needle. The blood was heparinized (100 IU/ml, heparin sodium, Qianhong Inc., Jiangsu, China), diluted to a 1:1 ratio with phosphate-buffered saline (PBS), and centrifuged in a density-gradient centrifuge Histo-Paque 1077 (Sigma-Aldrich, St. Louis, MO) at 400 g for 30 min. A sedimented layer of peripheral blood mononuclear cells (PB-MNCs) was collected, washed twice with PBS, adjusted to a concentration of 5 × 10⁵/ml, and suspended in 5 ml of microvascular growth medium-2 (EGM-2 MV; Cambrex, Walkersville, MD). The cells were placed in two 25-mm2 culture flask or three wells of a six-well culture plate (Corning Inc., Corning, NY) and cultured at 37°C under 100% humidity and 5% CO2. After 4 days, the suspended cells were removed and the cells adhering to the plate wall were fed every 3 days with a fresh culture medium. EPCs in the experiment were passaged up to nine times after reaching confluence. To ensure the healthy growth of EPCs in the culture, cell morphology was checked on a daily basis with an inverted phase-contrast microscopy (Axioscop; Zeiss Co. Ltd., Oberkochen, Germany).
EPC Characterization
To characterize the cultured EPCs, their capacity to uptake DiI-labeled acetylated low-density lipoprotein (DiI-Ac-LDL) and ability to bind to fluorescein isothiocyanate (FITC)-labeled Ulex europaeus agglutinin I (FITC-UEA I), which is a function of endothelial cells, were tested. First, 1 × 10⁶ EPCs that had been cultured for 10 days were incubated in one well of a six-well culture plate with 2.5 ml of culture medium containing 10 μg/ml DiI-Ac-LDL (Biomedical Technologies Inc., Stoughton, MA) at 37°C for 24 h. Then the cells were fixed in 4% paraformaldehyde for 20 min. The fixed cells were then incubated with 1 ml (10 μg/ml) FITC-UEA I (Vector Laboratories Inc., Burlingame, CA) at 37°C for 1 h. EPCs were observed under a laser scanning confocal microscope (LSM 510; Zeiss Co. Ltd., Oberkochen, Germany). The adherent cells that stained positive with both FITC-UEA I and DiI-Ac-LDL were indicated to be differentiating endothelial cells (1).
PLL-SPIO Synthesis and EPC Labeling
PLL-SPIO was prepared in our laboratory by the previously reported methods (11). Briefly, a mixture of Fe2+ and Fe3+ ions (pH 1.7) was reacted under a pH of 9 for 30 min. The precipitant, Fe3O4 was collected, purified, and oxidized by Fe(NO3)3 to obtain Fe2O3. Fe2O3 was diluted with deionized water to a concentration of 8 g/L and then reacted with 1% poly-L-lysine (PLL) for 2 h to obtain PLL-capped Fe2O3 (PLL-SPIO) nanoparticles. The PLL that bonded on the PLL-SPIO surface was only 0.01% of the total mass.
To label the EPCs with PLL-SPIO, 4 × 10⁷ EPCs collected from the first confluent passage in the 5 ml EGM-2 culture media were added to the PLL-SPIO with a 25 μg iron/ml concentration and incubated in a 50-ml flask at 37°C for 24 h. Then the free PLL-SPIO in the supernatant was discarded and labeled EPCs were collected.
To verify the intracellular uptake of PLL-SPIO, Prussian blue (Stain kit; Rainbow-Bridge Medical Technology Co. Ltd., Shanghai, China) was used to stain the iron component in the EPCs. EPCs were incubated with 2% potassium ferrocyanide in 6% hydrochloric acid at 37°C for 15 min and then counterstained with nuclear fast red at room temperature for 2 min. The intracellular distribution of the iron particles was examined under an electron microscope. To quantify the iron uptake and stability within EPCs, labeled cells were cultured for 1 and 7 days, and 5.0 × 10⁶ cells were collected each time. The labeled cells were deliquesced in 37% HCl and measured with a polarized atomic absorption spectrometer (Shengyang Huaguang HG-9602A, Shengyang, China). Each measurement was repeated three times to obtain a mean value.
Effects of PLL-SPIO Labeling on Cell Proliferation, Cell Cycling, and Apoptosis
Tetrazolium salt (MTT) assay was performed to assess the toxicity and the effect of PLL-SPIO labeling on EPC proliferation. Two wells in a 96-well culture plate were filled with 1 × 10⁴ EPCs and 100 μl of EGM-2 MV culture medium. This was cultured at 37°C for 24 h. Then in the first plate, 25 μg/ml PLL-SPIO was added into 42 wells and the remaining 42 wells, to which PLL-SPIO was not added, served as a control. In the second plate, seven concentrations of PLL-SPIO at of 10, 20, 40, 80, 120, 160, and 200 μg/ml were each added into 12 wells. The remaining 12 wells without PLL-SPIO served as controls.
In the first plate, the absorbance values of unlabeled EPCs (42 wells) and EPCs labeled with 25 μg/ml PLL-SPIO (42 wells) were measured from day 1 to day 7 of the culture process (six wells per day). In the second plate, absorbance values of half the wells were measured on the third day while the values for the remaining plates were measured on the fifth day.
Before the assay, the supernatant of the medium with free PLL-SPIO was discarded. Twenty microliters of MTT (5 mg/ml, Fluka Co., St. Gallen, Switzerland) was added into each well and incubated at 37°C in 5% CO2 for 4 h. Dimethyl sulfoxide (DMSO, 150 μl, Sigma-Aldrich, St. Louis, MO) was added and the medium was stirred for 10 min. When the indigo crystals (formazan crystals) were dissolved evenly in the medium, the light absorption value of each well was measured with a spectrophotometer (Model 680; Bio-Rad Laboratories. Inc., Hercules, CA) using a 490-nm wavelength.
The cell cycle analysis was performed with a flow cytometer (FACSCanto™, BD Co. Inc., Franklin Lakes, NJ) in 5 × 10⁵ cells (labeled and unlabeled), after they were fixed in 70% ethanol at 4°C for 24 h, coincubated with 5 μl (10 μg/ml) RNase inhibitor at 37°C for 30 min and 5 μl (50 μg/ml) propichium iodide (PI) at 4°C for 5 min.
To assess cell apoptosis, 5 × 10⁴ EPCs with and without PLL-SPIO labeling, respectively, were suspended in 50 μl annexin medium. After adding 5 μl annexin V-FITC, the cells suspension was kept in the dark for 10 min. Then, after adding 10 μl of PI, the suspension was stored in the dark for another 5 min. The cells were resuspended with 300 μl of annexin and placed on fluorescent plates for fluorescent reading. The percentages of dead cells and cells undergoing apoptosis were determined with a flow cytometer. The annexin/PI- indicates cells undergoing early apoptosis while annexin/PI indicates cells undergoing late apoptosis or cell death. The cell apoptosis/cycle analysis was repeated three times to obtain a mean value.
In Vitro MR Imaging of PLL-SPIO Labeling EPCs
In eight Eppendorf tubes loaded with 0.5 ml of 1% agarose, PLL-SPIO-labeled EPCs at three concentrations (5 × 10⁵, 1 × 10⁵, 5 × 10⁴) harvested after 1 and 7 days of culture, respectively, were added. In another two Eppendorf tubes, 5 × 10⁵ unlabeled cells were added to one, while the remaining tube to which no cells were added was designated as the control.
MRIs for the eight tubes were conducted on a 1.5 T MR imager (Eclipse, Philips Medical Systems, Netherlands) with a 12.7-cm receive-only surface coil. MR sequences were a T1-weighted spin-echo 500/17.9 (repetition time: ms/echo time: ms), a T2-weighted fast spin-echo (4000/108; echo train length, 16), and a T2*-weighted gradient-echo (620/15.7; flip angle, 35°) sequence. Two measurements were acquired from images that were obtained with a section thickness of 2 mm, a matrix size of 256 × 256, and field of view of 13 × 13 cm. The region of interest (ROI) for signal intensity (SI) measurement was 14.6 mm2. The percentage change of SI (ΔSI) was calculated by using the equation: ΔSI = (SIl – SIul)/SIul × 100%, where SIl and SIul are the SI of the labeled cells and unlabeled cells, respectively. Three ROI were randomly selected and measured in each tube for a mean value.
ΔSI of all three MR sequences were compared to the quantity of intracellular iron 1 and 7 days after labeling.
Statistical Analysis
Data are presented as the mean ± SD. To compare the differences between the labeled and unlabeled EPCs in various tests, the Kruskal-Wallis rank sum test was used to decide the difference in absorbance of MTT, the unpaired t-test was to compare the differences in cell cycle and apoptosis, a one-way analysis of variance followed by a post hoc Fisher protected least significant difference test was used to identify statistical differences in SI within a series of labeled and unlabeled groups, and to identify the differences in ΔSI in MR imaging within various concentrations of labeled groups and pulse sequences, correlation analysis followed by Spearman test was used to analyze the correlation of change between the SI of the labeled groups and the intracellular iron 1 and 7 days after labeling. A value of p ≤ 0.05 was considered statistically significant.
Results
Morphological Observation of Cultured EPCs
Inverse microscopy of EPCs during culture showed that freshly isolated EPCs appeared as round cells with variable sizes. After 4 days in culture, the cells became spindled, polygonal, or triangular in shape with a single, centrally located nucleus and tended to form cluster-like colonies. The cells divided rapidly, changing rapidly from packed round cells into a contact inhibited monolayer (Fig. 1a). On the 13th day in culture, the clustered cells were seen to be in contact each other and grew in confluent monolayers, which was mostly completed by the 18th day in culture (Fig. 1b). The cultured EPCs showed the typical “cobblestone” appearance of endothelial cells. The cells expanded through nine confluent passages in culture without showing significant signs of senescence (Fig. 1c).

Phase-contrast microscopy of the morphological changes of New Zealand white rabbit blood EPCs. (a) On the 9th day, EPCs appeared as spindle-shaped and cell clusters (magnification 200×). (b) On the 18th day of culture, EPCs showed endothelium-like cobblestone morphology with characteristic formation of clusters (magnification 200×). (c) The ninth passage cells appeared as spindle-shaped and regularly clusters arrangement (magnification 100×).
Incorporation of Dil-Ac-LDL and Binding of FITC-UEA I
Confocal microscopy demonstrated that cultured EPCs that have taken up DiI-ac-LDL displayed red fluorescent aggregates surrounding the nucleus in the cytoplasm and cultured EPCs bound to the endothelial cell-specific FITC-UEA I was green fluorescent aggregates surrounding the nucleus in the cytoplasm. EPCs that have taken both DiI-ac-LDL and FITC-UEA I displayed yellow fluorescence in the cytoplasm (Fig. 2).

EPCs obtained by 10-day culture were observed with confocal microscopy. Cells taken up DiI-ac-LDL were red fluorescence (upper left panel), bound to FITC-UEA I displayed green fluorescence (upper right panel), and the double-stained cells showed yellow fluorescence in cytoplasm (magnification 400×).
PLL-SPIO Particles, Observation, and Quantitative Analysis of Intracellular Irons
PLL-SPIO particles were viewed to be spherical under the electron microscope and contained an iron core of 15 ± 5 nm (Fig. 3b). Because their minimum sizes were within the nanometer range, their saturated magnetization (60 emu/g) was lower than that of the larger iron particles (11, 12). The PLL-SPIO magnetic fluids obtained were stable for 3 months while stored at 4°C.
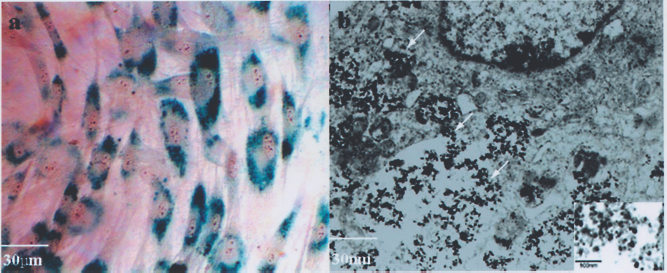
Intracytoplasmic iron oxide nanoparticles were observed by optical and electron microscope. (a) Intracytoplasmic blue particles were clearly visible with Prussian blue staining under optical microscopy. The labeling rate of passage 1 EPCs reached almost 100% (magnification 400×). (b) Intracytoplasmic iron oxide nanoparticles (arrows) were demonstrated under electron microscopy (magnification 8,000×). Transmission electron microscopic image of Fe2O3 nanoparticles is showed in lower right inset (magnification 10,000×).
It was determined through light microscopy that Prussian blue would stain iron particles in labeled EPCs (Fig. 3a), but not in unlabeled cells. Transmission electron microscopy verified that the iron particles were less than 20 nM and were contained within the vesicles enclosed with membrane in cytoplasm (Fig. 3b), indicating endocytotic of iron uptake.
By using a polarized atomic absorption spectrometer, the mean iron concentration in 5.0 × 10⁶ cells, cultured for 1 and 7 days after labeling was measured to be 1.47 ± 0.24 and 0.92 ± 0.16 μg/ml, respectively, equivalent to mean values of 18.30 ± 3.04 and 29.35 ± 4.79 pg iron per cell, respectively. There was a statistically significant difference between the two groups (t = 3.373, p < 0.05).
Labeling Effects on Cell Biology
Cell Proliferation
There was no statistically significant difference between time points from day 1 to day 7 observed from the MTT assay growth curve of labeled and unlabeled EPCs (Table 1, Fig. 4a). The MTT absorbance values of EPCs labeled with PLL-SPIO (10, 20, 40, 80, 120, 160, and 200 μg/ml iron), when compared with unlabeled EPCs on the third and fifth day also showed no significant difference between the labeled and unlabeled EPCs at each concentration and each time point (Kruskal-Wallis rank sum test) (Table 2, Fig. 4b).

MTT assay. (a) Cell growth curves of EPCs. SPIO-labeled and unlabeled EPCs (the first passage) present similar growth rate; there was no statistically significant difference between them. (b) Among different concentrations of SPIO-labeled and unlabeled EPCs, there were no statistical differences in MTT values.
Light Absorption Value of Labeled and Unlabeled Cells

Values are mean ± SD.
Light Absorption Value of Cells Labeled With Different Concentrations of Fe

Values are mean ± SD.
Cell Cycle
The flow cytometer assay of the cell cycle revealed that 93% of cells were in the G0/G1 phase while the rest were in the (S + G2 + M) phase. There was no significant difference between unlabeled and labeled cells: 94.57 ± 3.66% versus 93.74 ± 3.52% (t = 0.283, p = 0.791) (Fig. 5).

Cell cycle analysis showed that unlabeled and labeled EPCs in G0/G1 state at 4 days were 94.57% and 93.74%, respectively.
Apoptosis
Annexin-V and PI double stain analysis by flow cytometry showed that the ratio of pristine apoptosis in groups with unlabeled to labeled EPCs was 11.67 ± 1.19% to 12.89 ± 1.81%, respectively, without any statistically significant difference (t = 0.977, p = 0.384) (Fig. 6). The values for late apoptosis and dead cells were 0.43 ± 0.07% and 0.51 ± 0.09%, in unlabeled and labeled EPCs, respectively, without significant difference (t = 1.19, p = 0.300).
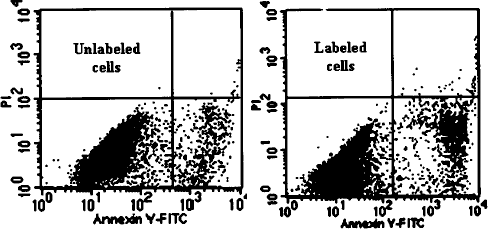
Annexin-V/PI double stain showed the pristine apoptosis (lower right panel) and the late apoptosis or decease (upper right panel) of cells. The pristine apoptosis and late apoptosis in unlabeled cells at 4 days accounted for 11.67% and 0.43%, while labeled cells were 12.89% and 0.51%, respectively.
In Vitro MRI Detection of Labeled EPCs
MR images using three sequences (T1WI, T2WI, and T2*WI) from 5 × 10⁵, 1 × 10⁵, and 5 × 10⁴ labeled cells, cultured 1 and 7 days after labeling, respectively, all showed hypointense signals (Fig. 7), and showed signal strength in labeled cells to be statistically significantly lower than that in unlabeled cells (p < 0.01). The signal intensity of labeled cells was lower on day 1 than day 7 (Table 3, Fig. 8a). Of T1WI, T2WI, and T2*WI, ΔSI on T2*WI was the greatest, and smallest on T1WI (Table 4, Fig. 8b). Among all the sequences, there were statistically significant differences between all labeled groups (F = 79.28, 99.83, and 61.66, p < 0.01). When the concentration of labeled cells reached 5 × 10⁴ or higher, the contrast image became visible when studied with a clinical 1.5 T MR scanner.

Cellular imaging in vitro by MRI (axial view: T1WI, T2WI, and T2*WI). MR images of phantoms were showed in various concentrations of 5 × 10⁵, 1 × 10⁵, and 5 × 10⁴ labeled EPCs at 1-day culture and 5 × 10⁵ unlabeled EPCs on upper row of four tubes from the left to the right, while in concentrations of 5 × 10⁵, 1 × 10⁵, and 5 × 10⁴ labeled EPCs at 7-day culture and gelatin without cells on lower row of tubes. Nonhomogeneities in the phantom images were caused by the moderate sedimentation of cells while the gelatin was setting.

Bar graphs showed the signal intensity (SI) or the percentage change of signal intensity (ΔSI) of different cells cultured for 1/7 day(s) on T1WI, T2WI, and T2*WI, respectively. (a) The SI of labeled cells decrease in all three sequences compared to that of unlabeled cells. (b) The signal decay was the most manifest on T2*WI.
SI on Different Sequences of MRI
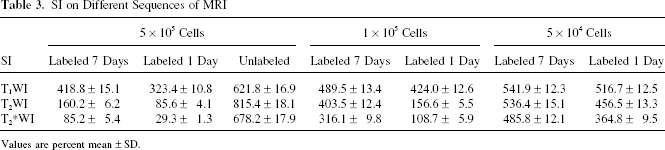
Values are percent mean ± SD.
ΔSI on Different Sequences of MRI

Values are percent mean ± SD.
A strong correlation was observed between SI variability on all three sequences and a change in iron concentrations in the EPCs. The correlation coefficients between SI on T1WI, T2WI, and T2*WI and the quantity of intracellular iron was 0.886, 0.829, and 0.943 in 5 × 10⁵ cells and 0.690, 0.714, and 0.714 in 1 × 10⁵ cells, respectively (p < 0.05).
Discussion
EPCs are precursors to vascular endothelial cells that originate from the bone marrow. They play a pivotal role in postnatal neovascularization (i.e., vasculogenesis) and in maintaining vascular homeostasis in adults (i.e., angiogenesis) (15, 22). Studies have shown that EPCs promote tissue vascular regeneration when introduced in vivo and thus provide potential therapies for cardiac ischemia, vascular insufficiency, wound healing, tumor inhibition, etc. (16). There are two techniques to obtain EPCs: (1) sorting CD34-, CD133-, or VEGFR2-positive cells from bone marrow by magnetic beads, and (2) ex vivo expanding of mononuclear cells isolated from peripheral blood and inducing them to differentiate into EPCs (5, 9). The magnetic bead technique is complex and expensive. The ex vivo expansion technique, which we used in this experiment, has the advantage of being simple, safe, and highly efficient (18).
In our study, EPCs collected from blood and isolated by using a density-gradient centrifuge (Histo-Paque 1077) were composed of diversified cell types with heterogeneous cell morphology. After culture in an endothelial cell culture medium, the cells appeared quite uniformly in a spindle shape and formed a confluent monolayer with a typical cobblestone appearance and with a single centrally located nucleus with a tendency to form cluster-like colonies. At the first confluent passage, the EPCs derived from PB-MNCs are a diverse complex of cells; the heterogeneity is apparent in terms of cell morphologies and sizes during the first few days of culture. We cannot exclude the possibility that PB-MNCs contained a few types of EPCs without specific markers. This study showed that EPCs incorporated DiI-Ac-LDL and bound to FITC-UEA I, which are endothelial features, and additionally, the proportion of DiI-Ac-LDL and FITC-UEA I double-positive cells increased through the course of maturation and purification.
After the transplantation of stem cells, recognition of the donor cells is essential for a better understanding of their migration and differentiation. Several studies have described the feasibility of intracellular labeling with SPIO or magnetodendrimers using fluid phase or receptor-mediated endocytosis (3, 7, 14). These methods allow the magnetic particles to be retained intracellularly over time and thus make in vivo cell tracking possible under MRI. There are several advantages to using MR imaging over other molecular imaging techniques such as nuclear imaging: (1) it offers high spatial resolution and good tissue contrast, especially in soft tissue; (2) it does not require radioactive isotopes; (3) it is noninvasive; and (4) it can track cellular events in vivo in living animals, continuously and repeatedly in real time.
Recently, Jendelová et al. (10) and Weber et al. (21) reported results in an experimental study that the peripheral blood CD34+ MNCs isolated from total MNCs were tracked with MRI by using colloidal superparamagnetic beads conjugated to anti-CD34+ antibodies. However, few studies have investigated the biologic effect of labeling EPCs with superparamagnetic iron oxide (SPIO).
SPIO is the contrast agent of choice when labeling cells in MR imaging. Its efficiency in generating MR signal change has been well proven. SPIO also has advantages because of its biological compatibility and low toxicity. When degraded, the iron component can be integrated into serum to form hemoglobin. In our laboratory, we conjugated our home-prepared SPIO with the cationic amino acid polymer poly-L-lysine (PLL) to form a positively charged complex, which facilitates the phagocytosis of the nanoparticles by the negatively charged surface of the EPCs without affecting cells properties. In the present study, we limited our goals to clarify the efficacy and safety of labeling EPCs using self-synthesized PLL-SPIO, and in vitro MRI with a conventional 1.5 T MR machine.
In this study, electron microscopy revealed that PLL-SPIO particles were spherical with iron core within nanometer ranges (15 ± 5 nm) and low saturated magnetization (60 emu/g) (11, 12). A polarized atomic absorption spectrometer provided EPCs with 29.30 and 18.30 pg iron per cell cultured for 1 and 7 days after labeling, respectively. Iron content per cell decreased with increased culture time. PLL-SPIO could label EPCs efficiently, which are confirmed by both Prussian blue stain and transmission electron microscopy.
On the other hand, magnetically labeled EPCs were visualized by a conventional 1.5 T high-quality MRI when the cell quantity is more than 5 × 10⁴ cells/ml. Furthermore, our study indicated that PLL-SPIO-labeled cells at concentrations from 10 μg/ml to 200 μg/ml do not interfere with cell proliferation. After considering safety and efficiency, we selected the relatively low concentration of 25 μg/ml SPIO to label the EPCs. Although the labeled EPCs did not show significant differences in cell activity and proliferation after being cultured at different times (up to 7 days) when compared to the unlabeled cells, atomic absorption spectrotype analysis revealed that the amount of intracellular SPIO decreased as the duration of the culture increased. The imaging of the same amount of cells, labeled for 7 days and 1 day, indicated that the ΔSI decreased in MRI, which also demonstrated that the amount of intracellular iron oxide nanoparticles decreased. This may be caused by the dilution effect of cell proliferation, as well as by the amount of contrast agent diminishing over time.
The MR signal results from the behavior of protons in a magnetic environment. This is referred to as the T2 effect of tissues. The T2 characteristics of tissue are related to local interactions among protons. These interactions cause protons dephasing, which leads to the decay of the MR signal over time. T2* decay yields a dark signal intensity on images. Local magnetic field distortions caused by SPIO-labeled cells, therefore, can be captured with MRI as hypointensity, particularly on T2*WI. Our study on labeled EPCs imaging in vitro by MR showed that signal intensity decreased in T1WI, T2WI, and T2*WI when compared to unlabeled cells, and the signal decay was the most significant on T2*WI. Additionally, the degree of dark signal intensity was associated with the quantity of labeled cells and the labeling time. When the number of labeled cells decreased or when labeling time increased, the degree of dark signal intensity fell off. Can we judge the proliferation speed of labeled cells from the observing the change in SI? This requires further research.
Conclusions
In summary, our study shows that EPCs are able to grow in cultures derived from PB-MNCs of New Zealand white rabbits on the basis of requirements for adherence and endothelial cell-specific growth conditions without further enrichment steps. EPCs are efficiently labeled through in vitro methods with iron oxide nanoparticles and are visualized using a conventional 1.5 T MRI unit. Moreover, we have demonstrated that the iron oxide nanoparticles used have little toxicity and few side effects for cell proliferation and activity. These results are important in the use of MRI to track and precisely localize the transplanted, magnetically labeled EPCs by in vivo methods.
Footnotes
Acknowledgments
This project was supported by National Natural Science Foundation of China (NSFC #90606007 and #30670604). Authors thank Dr. Zuxing Kan from M.D. Anderson Cancer Center and Ms. Rui Dong, from Class of 2011, Duke University, for their efforts on the manuscript revision.